The Y Beam 32484
This document was ed by and they confirmed that they have the permission to share it. If you are author or own the copyright of this book, please report to us by using this report form. Report 2z6p3t
Overview 5o1f4z
& View The Y Beam as PDF for free.
More details 6z3438
- Words: 4,920
- Pages: 7
l
Paper: Taylor ef al
Ordinary Meeting Papers to be presented at the Institution of Structural Engineers on Thursday 17 January 1991 at
6 pm.
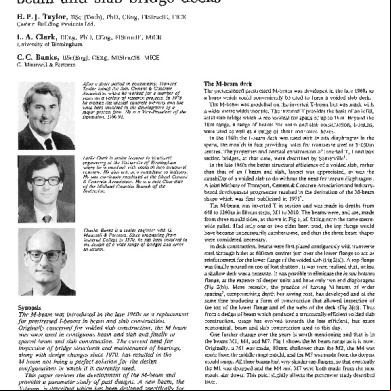
The Y-beam: a replacement for the M-beam in beam and slab bridge decks H.P. J. Taylor, BSc (Tech), PhD, CEng, FIStructE, FICE Costain Building Products Ltd.
L.A. Clark, BEng, PhD, CEng, FIStructE, MICE University of Birmingham
C. C. Banks, BSc(Eng), CEng, MIStructE, MICE G . Maunsell & Partners After a short period in consultancy, Howard Taylor ed the then Cement & Concrete Association where he worked for a number of years on a variety of research projects. In 1978 he entered the precast concrete industry and has since been involved in the development of a major precast firm. He is a Vice-president of the Institution,1990-91.
L Leslie Clark is senior lecturer in structural engineering at the University of Birmingham where he is involved with research into structural concrete. He also acts as a consultant to industry. He was previously employed at the (then) Cement & Concrete Association. He is a past Chairman of the Midland Counties Branch of the Institution.
-.
Charles Banks is a senior engineer with G . Maunsell& Partners. Since graduating from Imperial College in 1970, he has been involved in the design of a wide range of bridges and other structures.
Synopsis The M-beam was introduced in the late 1960s as a replacement for prestressed I-beams in beam and slab construction. Originally conceived for voided slab construction, the M-beam was soon used in contiguous beam and slab and finally in spaced beam and slab construction. The current need for inspection of bridge structures and maintenance of bearings, along with design changes since 1970, has resulted in the M-beam not being a perfect solution for the design configurations in which it is currently used. This paper reviews the development of the M-beam and provides a parameter study of past designs. A new beam, the Y-beam, is described which has been designed specifcally for modern circumstances. It is proposed that this beam more properly is suitable for medium-span construction of 15 to 29m and that this should replace the M-beam as the appropriate standard. The paper describes design andphysical developments of the proposed new Y-beam, developments which involved trial beam strip and deck designs. The design of bridge decks for continuity is considered, and the various continuity options are outlined. '
The
68lNo.2314 December 1990
The M-beam deck The pretensioned prestressed M-beam was developed in the late 1960s as a beam which could conveniently be used to form a voided slab deck. The M-beam was modelled on the inverted T-beam but was made with a wider metre width module. The inverted T provides the basis of an infill, solid slab bridge which is economical for spans of up to 18m. Beyond the 18m range, a range of beams for beam and slab construction, I-beams, were used as well as a range of shear connected boxes. In the 1960s the I-beam deck was used with in situ diaphragms in the spans, the moulds in fact providing holes for transverse steel at 3.050m centres. The properties and normal construction of inverted T, I and box section bridges, at that time, were described by Somerville'. In thelate 1960s the better structural efficiency of a voided slab, rather than that of an I-beam and slab, layout was appreciated, as was the capability of a voided slab to dowithout the need for inspan diaphragms. A t Ministry of Transport, Cement & Concrete Association and industrybased development programme resulted in the derivation of the M-beam shape which was first publicised in 1971*. The M-beam was inverted T in section and was made in depths from 640 to 1360m in 80mm steps, MI toM10. The beams were, and are,made from three mould sides, as shown in Fig 1, all fitting onto the samemetrewide pallet. Had only one or two sides been used, the top flange would have become unnecessarily cumbersome, and thus thethree beam shapes were considered necessary. In deck construction, beams were first placed contiguously with transverse steel through holes at 600mm centres just over the lower flange to act as reinforcement for thelower flange of the voided slab (Fig 2(a)). A top flange was finally poured on topof lost shutters. It was soon realised that, unless a shallow deck wasa necessity, it was possible to eliminate the in situ bottom flange, at theexpense of deeper units and have only two end diaphragms (Fig 2(b)). More recently, the practice of having M-beams of wider spacing3, compromising depth but saving cost, has developed and at the same time producing a form of construction that allowed inspection of the top of the lower flange and of the webs of the deck (Fig 2(c)). Thus from a design of beam which produced a structurally efficient voided slab construction, usage has evolved towardsthe less efficient, butmore economical, beam and slab construction used to this day. One further change over the years is worth mentioning and that is in the beams M1, M4, and M7. Fig 1 shows the M-beam range as it is now. Originally, a MI was made, 80mm shallower than the M2, the M4 was made from themiddle range mould, and the M7 was made from the deepest mould range. AU these beams had very slender top flanges, so that eventually the M1 was dropped and the M4 andM7 were both made from thenext mould size down. This point slightly affects the parameter study described later.
The need for change The M-beam was designed specifically for use in the voided deck application, and therefore has the following features: - a wide lower flange to produce a complete soffit with a minimum number of units - a shallow lower flange to allow the bottom flange of thevoided slab to be made without excessive depth Design criteria and loading enhancement since the introduction of theMbeam have resulted in beams generally now having greater prestress and
459
Paper: Taylor et al
I 1i-
I
.M10 MS .M8 L
M4 M3 M2
1
,;,
l
80 50
_-
160
p - 2 O X 20
Standard sections M2, M3 and M 4
Standard sections M8, MS and M10
Standard sections M 5 , M6 and M7
Fig 1.
1400
1200
1000 L
Q
2
800 6.0.0
400
I
I
I
10
I
15
I
I
20
I
I
I
I
25
30
25
30
I
Span m Years 1971-76 'M' beam depth
- span
1400
1200
1000
600 400
(c 1 'M' beam decks
Fig 2. 10
secondary reinforcement than that originally envisaged, making it difficult to fit the reinforcement, with the higher covers now demanded by durability requirements, into the narrow web and flanges of the beam. This change in design has come from theincreasingly rigorous approaches in analysis. In the 1960s the approach to thedesign for shear was changed in response to some reported failuresin the USA. The new shear provisions required, in general, less designed links but required nominal links in more cases. At thesame time, thewidespread use of grillage analysis allowed torsional effects to be considered easily, and a method of torsional design was developed and put into ourCodes. The provisions for torsion have generally led to increasing amounts of secondary steel in M-beams.
460
15
20 Span m
Years 1981- 86 'M' beam depth- span
Fig 3.
A simple parameter study was carried out by looking at the records of M-beam contracts in two periods, theearly 1970s and the early 1980s. The records were for all contracts, but with M-beams used for jetty and building use being excluded. The designs were carried out by a wide range of clients as well as inhouse by one manufacturer.
The Structural Engineer/Volume 68/No.23 /4December 1990
Paper: Taylor et al
30 1400 1200
25
10 9
8
7 1000
6 5
4 800 3
20
2
C
oa
600
v)
400
15
200
10
400
200
0
600
800
1000
Years 1971- 7 2
200 600
800
400
lobo
ASvfyv
PS Tonnes force
= 'M' beam type specified near
sv
to SV
Years 1971- 72 PS Tonnes-span
1400 1200 1000 800
600 400 200
0
'
200
'
400
'
600
ed0
1000
Years 1981- 82 Asv fyv SV
l
400
2oo
600
800
1000
PS Tonnes force
= 'M' beam type specified near to
SV
Fig 5.
Years 1981- 82 PS Tonnes- span
Fig 4.
Fig 3 shows the comparative span-depth records of the periods 1971-76 and 1981-86. The two inclined lines show the span-depth range recommended in the current bridge beam manual, a range agreed by all the current manufacturers and the Department of Transport. The line defining the right-hand side of the range tends to give an approximation for the 10 070 exceedence line and the line defining the left-hand side of the range gives an approximation to themean when the outliers with very low span-depth are excluded. These latter beams are in schemes where a bridge has side spans shorter than the main span but made to the same depth as the main span for aesthetic reasons. Careful study of Fig 3 shows a just discernible trend in the higher span ranges for beams in the early 1980s to be designed with lower span-to-depth ratios. This probablyreflects the changes brought by the move from voided to beam and slab construction, increases of loading, and design changes in the IO-year period. Figs 4 and 5 show the changes in reinforcement content in the same time. Fig 4 shows that, despite beams becoming slightly deeper, they also tended to have more prestress. Similar increases in web steel are indicated in Fig 5 . The few beams with very high values of secondary steel presumably come
The Structural Engineer/Volume 68/No.23 /4 December 1990
from skew decks or from misunderstanding of the rules for shear and torsion design in our Code rules which are complex and can have a wide range of interpretation. The result of the parameter studyand of the consideration of the needs of a beam designed specifically for spaced beam and slab construction, to current design and loading standards, led to the development of the new shape, the Y-beam. The relevant criteria were: (i) A range of beams was required which could ideally be cast from one mould, in contrast to the three mould shapes needed for M-beams. (ii) The beam should have a narrower bottom flange than M-beams, so as to allow space between for access and inspection. (iii) The beam should cover the existing M-beamrange M2 - M10, although inverted T-beams and U-beams can be used as alternatives at each end of the range. (iv) The lower flange of the beam should be deeper than in a M-beam to allow for the increased prestress used in recent designs and also to allow higher coversfor links without impinging on manufacturing tolerances and without requiring links to be bent through non-standard radii. (v) The lower flange should have a more steeply sloping top surface than on M-beams to keep it clean of debris and to allow it to be cast without air bubbles and water gain under the shutter forming the upper surface of the bottom flange.
461
Paper: Taylor et al
16 14 40-
12 10
371 l-----i----
l
1400 1300
T
xEa 8 y8
N
4 Y7
5
Z
6
Y
S
4 2
z b x 106mm3 Beam weight - bottom fibre modulus relationship
Fig 7.
l
7 50
Standard sections Y1 to Y8
Fig 6. 14 15 19 18 17 16
20 21 22 23 24 25 26 27 28 29 30 Span m
(vi) The beam should ideally not have a discrete top flange in order to eliminate the need for such a top flange to be provided with a set of small torsion links, as is increasingly the case with M-beams. (vii) The beam should have a top flange that would allow it to have an end cross-diaphragm which is notthe full depth of the deck. This configuration is common in standard U-beam bridges and allows access for jacks for bearing maintenance and replacement.
Deck weight - span relationship
Fig 8.
The beam is designed to have only one set of mould sides for all depths but does produce a heavier beam than the similar M-beam at its greatest depth. This was not thought to be a great disadvantage, as the M-beam is not the most popular for spansover 27 m, U and box beams being more often used instead.
The Y-beam The shape of the new beam came from the preceding logic and is shown in Fig 6. The section properties are shown in Table 1 .
TABLE I - Y-beam section properties
7Section
Depth
lo00 1100 1200 1400
462
Area (mm2)
309202 339882 373444 409890 449220 491433 536530 584708
Height Of centroid above bottom fibre (mm Yb)
255 24 298 * 68 347- 12 399.71 455 - 72 514.50 575 54 63854
Section modulus mm3 Top fibre
X
lo6
Bottom fibre
Approximate self-weight (kN/m)
(2,)
24- 85 35 -02 4788 63.53 82-06 103-58 128- 15 155.98
43 -40 58 *78 7627 95.41 116.02 138.00 161.31 186.01
7 -42 8 - 14 8-95 9.82 10.78 l1 -78 12-86 14-02
The Structural Engineer/Volume 68/No.23/ 4 December 1990
Paper: Taylor et al 15
1400
14 13
1300
12 11
1200
E
E 10
Z
In9
E 1100 E
5 a
2l 5
1000
8 7
E
6
m
5
S
900
800
700 13 14 45
16 17 18 192021
22 23 24 25 26 27 28 29 30 Span m
Beam depth- span relationship
Fig 9.
Beam properties comparison The various properties of the Y-beam have been compared with those of the M-beam, when used in its T-beam form, at beam spacings of either 1.Om or 1-5m. In each case a 160mm-thick top slab has been assumed, although it should be noted that the top slab thickness is often increased to 200mm in practice, particularly when M-beams are spaced at 1 5 m. The maximum span for each M-beam size was taken from the beam selection data given in refs3 and4 for beams at 1*Omand 1 -5m centres, respectively. The maximum span for each Y-beam was estimated from the M-beam selection data on the basis of equality of bottom fibre section modulus. Beam weights are shown as a functionof bottom fibre section modulus in Fig 7 where it can be seen that Y-beam is up to 15 070 heavier than a M-beam for a comparable section modulus. This is primarily because the Y-beam has a thicker web. Weights of deck (beam plus 160mm top slab)/unit area are shown as a function of span in Fig 8. Since there is a 250mm gap between adjacent Y-beams at 1 mcentres, the Y-beam should really be compared with the M-beam at 1 -25m centres. In this case, a Ybeam deck is up to about 28 070 heavier than a M-beam deck. However, it should be noted that M-beams at 1-25m centres can be used only up to about 27m spanwhereas Y-beams can be used up to 29m.The increased weight ofa Y-beam deck is compensated by the reduced construction depth. Fig 9 shows that the depth of a deck of M-beams at 1-25m centres could be reduced by up to about 200mm using a Y-beam deck. Finally, stresses due solely to self-weight (beam plus 160mm top slab) are compared in Fig 10. It can be seen that the Y-beam stresses are similar to those of M-beams at 1 mcentres but, as one would expect, larger than those for M-beams at 1 5 m centres.
Grillage analyses Four Y-beam decks were analysed using a grillage analysis. The deck crosssection, which is shown in Fig 11, accommodated a dual two-lane road. Each deck had a tat its longitudinal centreline. Deck 1 hadY3 beams, a span of 19m and zero skew; deck 2 had Y8 beams, a span of 29m and
1000 Hard shoulder
1000 Hardstrip
zero skew; deck 3 had Y3 beams, a span of 19m and 45" skew; and deck 4 had Y8 beams, a span of 29m and 45" skew. In each case, longitudinal grillage beams were spaced at 2m centres, and, thus, each represented two physical beams. Transverse grillage beams were at right-angles to the longitudinal beams, except for those representing the end diaphragms in the skew decks. Grillage stiffnesses were calculated in accordance with ref 5 except that end diaphragm stiffnesses were taken as 50 070 of their calculated values as recommended by Clark & West6. Grillage output moments, etc., were apportioned to physical beams in proportion to the stiffnesses of the latter. Four load cases were considered for each deck: maximum moment in outer lane, maximum shear in outer lane, maximum moment in inner lane, and maximum shear in inner lane. In each case the loading consisted of surfacing, footpath, parapet, 45 units of HB loading in one notionallane, and full HA loading in the other two notional lanes7.'. The BS5400 partial safety factors7", as amended by theDepartment of Transport', were adopted. In order to limit the number of computer runs, analyses were performed only for the serviceability limit state. It was assumed that stress resultants at the ultimate limit state were 1.5/1- 1 = 1 -36 (the ratio of the Y, values for HB loading) x those at the serviceability limit state.
Central reservation 2506 6 1 0 0 0 Hardstrip
h
1000 Hard shoulder
I
I 7300
-450
Carriageway
Beams a t l m centres
Y3 or v8 Beams c
Longitudinal grillage beams at 2m centres
Fig I I . Typical section through deck
The Structural Engineer/Volume 68/No.23 / 4 December 1990
463
Paper: Taylor et
Q]
---
TABLE 2 - Summary of trial designs
TABLE 3 - Summary of longitudinal strip designs
Deck
l
2
Skew (")
0
0
Beam
End strands ecc (mm) Min. R12 link spacing (mm)
45
Y3 Edge
Y8 Edge 41 206 432 428
31 31
19 19 19 21 171 171
84
78
80
45
3
45
29 19
Span (m) Midspan strands ecc (mm)
4
29 19 Y3 Edge
Y8 Edge
31 31 45 41 206 432 391
82
75
The precast beams were designed as class 1 under load combination 1, and class 2 under load combination 3(i.e. when temperature effects were The precast units had a concrete of grade 50, with a strength at transfer of 40 N/mm2, and the tendons were assumed to be 15-2mm low relaxation strands with an initial force of 174 kN. Losses wereassumed to total 12 Vo at transfer and 35 Vo finally. Links were assumed to be 12mm diameter of grade 250. The results of the trial designs are summarised in Table 2. If compacted strands were adopted, the number of strands would reduce by about 22 Vo. The minimum link spacings are those required to resist torsion and shear and do not include an allowance for 'end block' effects. The maximum main reinforcement in the end diaphragms was 5T20 and the smallest spacings of R12 links were 69mm. The latter spacing is rather small and, in practice, it would be better to use T12 or R16 links.
Strip analyses In order to compare Y-beam and M-beam designs, simply ed longitudinal deck strips consisting of a single internal beam plus its top slab were designed for right spans of 19m and 29 m. For the 19m span the following beams were considered: Y3 at 1.Om centres; M3 at 1.Om centres; and M5 at 1-25m centres. For the 29mspan the following beams were considered: Y8 at 1- 0 m centres; M10 at 1 - 0 m centres; and M10 at 1.25m centres. In each case the top slab was 160mm thick and the material properties were the same as those assumed in the grillage analyses. Both HA and 45 units of HB loading were considered in load combinations 1 and 3 of BS 5400. In order to calculate the maximum HB moment, the transverse moment distribution for the cross-section shown in Fig. 11 was estimated using Morice & Little's charts". The maximum shear force due to HB loading was estimated using statics and by assuming a 45" spread of load to a . The results of the strip designs are summarised in Table 3. When the Y-beams at 1.Om centres are compared with the M-beams at 1-25m centres, it can be seen that the Y-beams are heavier, but require less links. The number of strands required for the two types of beam are similar. It should be noted that the 29m span is slightly excessive for M10 beams at 1-25m centres, and the bottomfibre is overstressd by 0.34 N/mm2 in compression at transfer and 0.04 N/mm* in tension finally.
Continuity For bridges of more than one span the designer has the choice between isolated individual spans or a single continuous structure. In practice this choice can be exercised twice, first to decide whether the bridge will be continuous for horizontal loading and then, if continuity is chosen, whether to choose continuity for vertical loading also. If isolated spans are chosen, each will need its own set of bearings at each pier and each will be separated from the next by a movement t. Since points of movement are notoriously difficult to waterproof,sooner or later these ts will leak, and water with all its dissolved corrosioninitiating chemicals will penetrate the bridge structure. If the bridge is made continuous for horizontal loads but not forvertical loads, individual bearings for each span are still required at each pier to carry at least the vertical loads. The junction between spans no longer needs a physical gap since horizontal loads are to be transmitted across it, but it must be able to accommodate the rotations required to prevent vertical shear and bending from being transmitted. In short, a hinge is required. This is usually provided by either leaving a short section of the deck slab uned by the main beams and thus reducing its bending stiffness or by introducing protected tie bars across the t and expecting the deck
464
I
19 M5
Beam Spacing (m) Beam weighthnit deck area (kN/m2) Beam depth (mm)
6.70
Midspan strands ecc (mm)
19 1919 27 300 317 171 171 300 305 84 75 84
-r
Span (m)
18 148
Min. R12 link spacing (mm)
111 82
19 148
1-25 1.0
M10 M10 1.25
10-8 14.0 8-64 1360 1400 1360 960
27
43 31 426 218352
40 388
19
22 29 306 184
22 303 309
I
End strands ecc (mm)
29 Y8 1-0
81 94 140 129
concrete to crack locally. In both cases, since there is no translational movement but only rotational, waterproofing is easier. However it must be said that reinforced concrete is not well suited to absorbing rotational deformation, so that the design is necessarily a compromise. The third possibility is a continuous structure for both vertical and horizontal loading. Only one set of bearings is required at each pier head which can therefore be made slimmer and, since there is no relative movement between the spans, waterproofing is easier. Larger ts are of course required at the ends of each continuous length, but then special provision can be made in these relatively few locations. On the other hand, the connection between the spans must be designedfor all the loading effects that will occur due to continuity and a structuralarrangement devised that can be conveniently built. Bending moments in continuous bridges are in principal lower than those in simply ed bridges but, as will be seen later, this advantage can be reducedin prestressed beam bridgesby the required construction sequence and by the effects of creep. It is often argued that the design of continuous bridges is more complex than that of simply ed bridges but, provided that a reasonably conservative design for hogging moments over the piers is accepted and adjacent spans are of similar length, the increased work need be only marginal. However additional work is sometimes required to design for the longitudinalmovements and forces. Table 4summarises the advantages and disadvantages of the three options discussed. It is also necessary to consider the effects of the upward creep of the precast beamsdue to prestress continuing to occur after continuity has been established. This creep gives sagging moments at the pier positions. It is difficult to provide an adequate tensile connection between the bottom of the beams to carry such amoment, and differentialtemperature and settlement effects can increase it significantly. It must, however, be said that, since the net moment is the sum of opposing effects, creep effects are critically dependent on the prestress arrangement, the local humidity and the age of the beam when continuity is established. A wide range of values can be obtained in different circumstances. sagging moment is a compatibility effect and would lead to cracking at the beam soffit, which is in a sheltered location and would not affect the ultimate capacity of the bridge deck. However, consideration of such a crack must be made in the design of the bearings under the in situ diaphragm. A similar situation occurs in relation to the stresses in the precast beam near the under hogging moments. The hogging bending stresses add to the prestress stresses, giving extra tension at the top of the beam and compression at the bottom, which can be difficult to accommodate in a prestressed concrete design as used for the adjacent diaphragm. The effect can probably be ignored, as is the American practice. Research has been carried out on this effect and is described in a further paper. Research to investigate these matters is now under way, and it is hoped that this will allow this most advantageous system to be used more widely. With its large bottom flange and robust web, the Y-beam would be particularly suitable for use in a continuous bridge of this type.
Conclusion The need for a new standard bridge to replace the M-beam has been demonstrated, and the development of such a new beam (the Y-beam) described. Trial designs have been compared with M-beam designs to demonstrate the viability of the Y-beam. Finally, problems associated with achieving continuity have been discussed.
The Structural Engineer/Volume 68/No.23/4 December 1990
Paper: Taylor et TABLE 4 - Advantages and disadvantages of different articulation schemes
Articulation scheme
Advantages
Disadvantages
Discontinuous for both horizontal and vertical loads
Movement ts small
Many movement ts with both translational and rotational movement making waterproofing difficult
Design need only consider each span separately
Less robust as the spans are independent Bearings need only cater for small movements
Two lines of bearings required at each pier, needing wider piers Each pier must carry the horizonal loads applied to the spans above Advisable to jack both spans at a pier equally when removing bearings, etc.
Most ts have to take rotation only making waterproofing much more effective
Continuous for horizontal loads Discontinuous for vertical loads
Some larger movement ts required Two lines of bearings required at each pier
Some increase in robustness against collapse The partial connection between spans makes the bridge more susceptible to progressive collapse Detailing and construction of the connecting slabs between spans is difficult Bearings must accommodate large movements
Continuous for both horizontal loads
and vertical
The designer can choose where to take out longitudinal forces
Where longitudinal forces are taken out, they are larger
Isolated transverse forces can be distributed between piers, reducing pier loading
Both spans at a pier must be jacked equally when removing bearings, etc.
Only isolated movement ts required
Movement ts must accommodate large movements
Waterproofing simplified
Some increase in design work for continuity effects
Detailing and construction of the connection between spans simplifed Only one line of bearings required at each pier allowing narrower pier heads
Bearings must accommodate larger movements
Maximum robustness against collapse Some reduction in design bending moments
The moment induced by creep should be considered
The designer can choose where forces can be distributed between adjacent piers
Loads on piers taking longitudinal forces are larger
Only one set of jacks required at each pier for raising deck
References 1. 2.
3.
4. 5.
r/Volume ctural The
Clark, L. A.,and West, R.: ‘Thetorsional stiffness of diaphragms in beam and slab bridges’, Technical Report 42. 510, London, Cement & Concrete Association, 1975, pp20 7. BS 5400 Steel, concrete and composite bridges: Part 2; Specification f o r loads, London, British Standards Institution, 1978 8. Department of Transport: ‘Loads for highway bridges’, Departmental Standard BD/37/88, London; 1989 9. BS 5400 Steel, concrete and composite bridges: Part 4: Code of practice f o r design of concrete bridges, London, British Standards Institution, 1984 10. Department of Transport: ‘Design of concrete bridges. Use ofBS 5400: Part 4, 1984,’ Departmental Standard BD/24/84, London, 1984 11. Rowe, R. E.: Concrete bridge design, London, CR Books, 1965 6.
Somerville, G.: ‘Standard bridge beams for spans from 7 m to 36m’, London, Cement & Concrete Association, 1970 pp32 Manton, B. H., and Wilson, C. B.: ‘MoT/C&CA standard bridge beams, prestresed inverted T-beams for spans from 15m to 29m’, London, Cement & Concrete Association, March 1971, pp36 Kirkpatrick, J., Long, A. E., and Thompson, A.: ‘Load distribution characteristics of spaced M-beam bridge decks’, TheStructural Engineer, 62B, No. 4, December 1984, pp86 Prestressed Concrete Association: Prestressed concrete bridge beams, 2nd ed., Leicester, British Precast Concrete Federation, 1984, pp10 Hambly, E. C.: Bridge deck behaviour, London, Chapman & Hall, 1976, pp272
68 /No.23 / 4 December 1990
465
Paper: Taylor ef al
Ordinary Meeting Papers to be presented at the Institution of Structural Engineers on Thursday 17 January 1991 at
6 pm.
The Y-beam: a replacement for the M-beam in beam and slab bridge decks H.P. J. Taylor, BSc (Tech), PhD, CEng, FIStructE, FICE Costain Building Products Ltd.
L.A. Clark, BEng, PhD, CEng, FIStructE, MICE University of Birmingham
C. C. Banks, BSc(Eng), CEng, MIStructE, MICE G . Maunsell & Partners After a short period in consultancy, Howard Taylor ed the then Cement & Concrete Association where he worked for a number of years on a variety of research projects. In 1978 he entered the precast concrete industry and has since been involved in the development of a major precast firm. He is a Vice-president of the Institution,1990-91.
L Leslie Clark is senior lecturer in structural engineering at the University of Birmingham where he is involved with research into structural concrete. He also acts as a consultant to industry. He was previously employed at the (then) Cement & Concrete Association. He is a past Chairman of the Midland Counties Branch of the Institution.
-.
Charles Banks is a senior engineer with G . Maunsell& Partners. Since graduating from Imperial College in 1970, he has been involved in the design of a wide range of bridges and other structures.
Synopsis The M-beam was introduced in the late 1960s as a replacement for prestressed I-beams in beam and slab construction. Originally conceived for voided slab construction, the M-beam was soon used in contiguous beam and slab and finally in spaced beam and slab construction. The current need for inspection of bridge structures and maintenance of bearings, along with design changes since 1970, has resulted in the M-beam not being a perfect solution for the design configurations in which it is currently used. This paper reviews the development of the M-beam and provides a parameter study of past designs. A new beam, the Y-beam, is described which has been designed specifcally for modern circumstances. It is proposed that this beam more properly is suitable for medium-span construction of 15 to 29m and that this should replace the M-beam as the appropriate standard. The paper describes design andphysical developments of the proposed new Y-beam, developments which involved trial beam strip and deck designs. The design of bridge decks for continuity is considered, and the various continuity options are outlined. '
The
68lNo.2314 December 1990
The M-beam deck The pretensioned prestressed M-beam was developed in the late 1960s as a beam which could conveniently be used to form a voided slab deck. The M-beam was modelled on the inverted T-beam but was made with a wider metre width module. The inverted T provides the basis of an infill, solid slab bridge which is economical for spans of up to 18m. Beyond the 18m range, a range of beams for beam and slab construction, I-beams, were used as well as a range of shear connected boxes. In the 1960s the I-beam deck was used with in situ diaphragms in the spans, the moulds in fact providing holes for transverse steel at 3.050m centres. The properties and normal construction of inverted T, I and box section bridges, at that time, were described by Somerville'. In thelate 1960s the better structural efficiency of a voided slab, rather than that of an I-beam and slab, layout was appreciated, as was the capability of a voided slab to dowithout the need for inspan diaphragms. A t Ministry of Transport, Cement & Concrete Association and industrybased development programme resulted in the derivation of the M-beam shape which was first publicised in 1971*. The M-beam was inverted T in section and was made in depths from 640 to 1360m in 80mm steps, MI toM10. The beams were, and are,made from three mould sides, as shown in Fig 1, all fitting onto the samemetrewide pallet. Had only one or two sides been used, the top flange would have become unnecessarily cumbersome, and thus thethree beam shapes were considered necessary. In deck construction, beams were first placed contiguously with transverse steel through holes at 600mm centres just over the lower flange to act as reinforcement for thelower flange of the voided slab (Fig 2(a)). A top flange was finally poured on topof lost shutters. It was soon realised that, unless a shallow deck wasa necessity, it was possible to eliminate the in situ bottom flange, at theexpense of deeper units and have only two end diaphragms (Fig 2(b)). More recently, the practice of having M-beams of wider spacing3, compromising depth but saving cost, has developed and at the same time producing a form of construction that allowed inspection of the top of the lower flange and of the webs of the deck (Fig 2(c)). Thus from a design of beam which produced a structurally efficient voided slab construction, usage has evolved towardsthe less efficient, butmore economical, beam and slab construction used to this day. One further change over the years is worth mentioning and that is in the beams M1, M4, and M7. Fig 1 shows the M-beam range as it is now. Originally, a MI was made, 80mm shallower than the M2, the M4 was made from themiddle range mould, and the M7 was made from the deepest mould range. AU these beams had very slender top flanges, so that eventually the M1 was dropped and the M4 andM7 were both made from thenext mould size down. This point slightly affects the parameter study described later.
The need for change The M-beam was designed specifically for use in the voided deck application, and therefore has the following features: - a wide lower flange to produce a complete soffit with a minimum number of units - a shallow lower flange to allow the bottom flange of thevoided slab to be made without excessive depth Design criteria and loading enhancement since the introduction of theMbeam have resulted in beams generally now having greater prestress and
459
Paper: Taylor et al
I 1i-
I
.M10 MS .M8 L
M4 M3 M2
1
,;,
l
80 50
_-
160
p - 2 O X 20
Standard sections M2, M3 and M 4
Standard sections M8, MS and M10
Standard sections M 5 , M6 and M7
Fig 1.
1400
1200
1000 L
Q
2
800 6.0.0
400
I
I
I
10
I
15
I
I
20
I
I
I
I
25
30
25
30
I
Span m Years 1971-76 'M' beam depth
- span
1400
1200
1000
600 400
(c 1 'M' beam decks
Fig 2. 10
secondary reinforcement than that originally envisaged, making it difficult to fit the reinforcement, with the higher covers now demanded by durability requirements, into the narrow web and flanges of the beam. This change in design has come from theincreasingly rigorous approaches in analysis. In the 1960s the approach to thedesign for shear was changed in response to some reported failuresin the USA. The new shear provisions required, in general, less designed links but required nominal links in more cases. At thesame time, thewidespread use of grillage analysis allowed torsional effects to be considered easily, and a method of torsional design was developed and put into ourCodes. The provisions for torsion have generally led to increasing amounts of secondary steel in M-beams.
460
15
20 Span m
Years 1981- 86 'M' beam depth- span
Fig 3.
A simple parameter study was carried out by looking at the records of M-beam contracts in two periods, theearly 1970s and the early 1980s. The records were for all contracts, but with M-beams used for jetty and building use being excluded. The designs were carried out by a wide range of clients as well as inhouse by one manufacturer.
The Structural Engineer/Volume 68/No.23 /4December 1990
Paper: Taylor et al
30 1400 1200
25
10 9
8
7 1000
6 5
4 800 3
20
2
C
oa
600
v)
400
15
200
10
400
200
0
600
800
1000
Years 1971- 7 2
200 600
800
400
lobo
ASvfyv
PS Tonnes force
= 'M' beam type specified near
sv
to SV
Years 1971- 72 PS Tonnes-span
1400 1200 1000 800
600 400 200
0
'
200
'
400
'
600
ed0
1000
Years 1981- 82 Asv fyv SV
l
400
2oo
600
800
1000
PS Tonnes force
= 'M' beam type specified near to
SV
Fig 5.
Years 1981- 82 PS Tonnes- span
Fig 4.
Fig 3 shows the comparative span-depth records of the periods 1971-76 and 1981-86. The two inclined lines show the span-depth range recommended in the current bridge beam manual, a range agreed by all the current manufacturers and the Department of Transport. The line defining the right-hand side of the range tends to give an approximation for the 10 070 exceedence line and the line defining the left-hand side of the range gives an approximation to themean when the outliers with very low span-depth are excluded. These latter beams are in schemes where a bridge has side spans shorter than the main span but made to the same depth as the main span for aesthetic reasons. Careful study of Fig 3 shows a just discernible trend in the higher span ranges for beams in the early 1980s to be designed with lower span-to-depth ratios. This probablyreflects the changes brought by the move from voided to beam and slab construction, increases of loading, and design changes in the IO-year period. Figs 4 and 5 show the changes in reinforcement content in the same time. Fig 4 shows that, despite beams becoming slightly deeper, they also tended to have more prestress. Similar increases in web steel are indicated in Fig 5 . The few beams with very high values of secondary steel presumably come
The Structural Engineer/Volume 68/No.23 /4 December 1990
from skew decks or from misunderstanding of the rules for shear and torsion design in our Code rules which are complex and can have a wide range of interpretation. The result of the parameter studyand of the consideration of the needs of a beam designed specifically for spaced beam and slab construction, to current design and loading standards, led to the development of the new shape, the Y-beam. The relevant criteria were: (i) A range of beams was required which could ideally be cast from one mould, in contrast to the three mould shapes needed for M-beams. (ii) The beam should have a narrower bottom flange than M-beams, so as to allow space between for access and inspection. (iii) The beam should cover the existing M-beamrange M2 - M10, although inverted T-beams and U-beams can be used as alternatives at each end of the range. (iv) The lower flange of the beam should be deeper than in a M-beam to allow for the increased prestress used in recent designs and also to allow higher coversfor links without impinging on manufacturing tolerances and without requiring links to be bent through non-standard radii. (v) The lower flange should have a more steeply sloping top surface than on M-beams to keep it clean of debris and to allow it to be cast without air bubbles and water gain under the shutter forming the upper surface of the bottom flange.
461
Paper: Taylor et al
16 14 40-
12 10
371 l-----i----
l
1400 1300
T
xEa 8 y8
N
4 Y7
5
Z
6
Y
S
4 2
z b x 106mm3 Beam weight - bottom fibre modulus relationship
Fig 7.
l
7 50
Standard sections Y1 to Y8
Fig 6. 14 15 19 18 17 16
20 21 22 23 24 25 26 27 28 29 30 Span m
(vi) The beam should ideally not have a discrete top flange in order to eliminate the need for such a top flange to be provided with a set of small torsion links, as is increasingly the case with M-beams. (vii) The beam should have a top flange that would allow it to have an end cross-diaphragm which is notthe full depth of the deck. This configuration is common in standard U-beam bridges and allows access for jacks for bearing maintenance and replacement.
Deck weight - span relationship
Fig 8.
The beam is designed to have only one set of mould sides for all depths but does produce a heavier beam than the similar M-beam at its greatest depth. This was not thought to be a great disadvantage, as the M-beam is not the most popular for spansover 27 m, U and box beams being more often used instead.
The Y-beam The shape of the new beam came from the preceding logic and is shown in Fig 6. The section properties are shown in Table 1 .
TABLE I - Y-beam section properties
7Section
Depth
lo00 1100 1200 1400
462
Area (mm2)
309202 339882 373444 409890 449220 491433 536530 584708
Height Of centroid above bottom fibre (mm Yb)
255 24 298 * 68 347- 12 399.71 455 - 72 514.50 575 54 63854
Section modulus mm3 Top fibre
X
lo6
Bottom fibre
Approximate self-weight (kN/m)
(2,)
24- 85 35 -02 4788 63.53 82-06 103-58 128- 15 155.98
43 -40 58 *78 7627 95.41 116.02 138.00 161.31 186.01
7 -42 8 - 14 8-95 9.82 10.78 l1 -78 12-86 14-02
The Structural Engineer/Volume 68/No.23/ 4 December 1990
Paper: Taylor et al 15
1400
14 13
1300
12 11
1200
E
E 10
Z
In9
E 1100 E
5 a
2l 5
1000
8 7
E
6
m
5
S
900
800
700 13 14 45
16 17 18 192021
22 23 24 25 26 27 28 29 30 Span m
Beam depth- span relationship
Fig 9.
Beam properties comparison The various properties of the Y-beam have been compared with those of the M-beam, when used in its T-beam form, at beam spacings of either 1.Om or 1-5m. In each case a 160mm-thick top slab has been assumed, although it should be noted that the top slab thickness is often increased to 200mm in practice, particularly when M-beams are spaced at 1 5 m. The maximum span for each M-beam size was taken from the beam selection data given in refs3 and4 for beams at 1*Omand 1 -5m centres, respectively. The maximum span for each Y-beam was estimated from the M-beam selection data on the basis of equality of bottom fibre section modulus. Beam weights are shown as a functionof bottom fibre section modulus in Fig 7 where it can be seen that Y-beam is up to 15 070 heavier than a M-beam for a comparable section modulus. This is primarily because the Y-beam has a thicker web. Weights of deck (beam plus 160mm top slab)/unit area are shown as a function of span in Fig 8. Since there is a 250mm gap between adjacent Y-beams at 1 mcentres, the Y-beam should really be compared with the M-beam at 1 -25m centres. In this case, a Ybeam deck is up to about 28 070 heavier than a M-beam deck. However, it should be noted that M-beams at 1-25m centres can be used only up to about 27m spanwhereas Y-beams can be used up to 29m.The increased weight ofa Y-beam deck is compensated by the reduced construction depth. Fig 9 shows that the depth of a deck of M-beams at 1-25m centres could be reduced by up to about 200mm using a Y-beam deck. Finally, stresses due solely to self-weight (beam plus 160mm top slab) are compared in Fig 10. It can be seen that the Y-beam stresses are similar to those of M-beams at 1 mcentres but, as one would expect, larger than those for M-beams at 1 5 m centres.
Grillage analyses Four Y-beam decks were analysed using a grillage analysis. The deck crosssection, which is shown in Fig 11, accommodated a dual two-lane road. Each deck had a tat its longitudinal centreline. Deck 1 hadY3 beams, a span of 19m and zero skew; deck 2 had Y8 beams, a span of 29m and
1000 Hard shoulder
1000 Hardstrip
zero skew; deck 3 had Y3 beams, a span of 19m and 45" skew; and deck 4 had Y8 beams, a span of 29m and 45" skew. In each case, longitudinal grillage beams were spaced at 2m centres, and, thus, each represented two physical beams. Transverse grillage beams were at right-angles to the longitudinal beams, except for those representing the end diaphragms in the skew decks. Grillage stiffnesses were calculated in accordance with ref 5 except that end diaphragm stiffnesses were taken as 50 070 of their calculated values as recommended by Clark & West6. Grillage output moments, etc., were apportioned to physical beams in proportion to the stiffnesses of the latter. Four load cases were considered for each deck: maximum moment in outer lane, maximum shear in outer lane, maximum moment in inner lane, and maximum shear in inner lane. In each case the loading consisted of surfacing, footpath, parapet, 45 units of HB loading in one notionallane, and full HA loading in the other two notional lanes7.'. The BS5400 partial safety factors7", as amended by theDepartment of Transport', were adopted. In order to limit the number of computer runs, analyses were performed only for the serviceability limit state. It was assumed that stress resultants at the ultimate limit state were 1.5/1- 1 = 1 -36 (the ratio of the Y, values for HB loading) x those at the serviceability limit state.
Central reservation 2506 6 1 0 0 0 Hardstrip
h
1000 Hard shoulder
I
I 7300
-450
Carriageway
Beams a t l m centres
Y3 or v8 Beams c
Longitudinal grillage beams at 2m centres
Fig I I . Typical section through deck
The Structural Engineer/Volume 68/No.23 / 4 December 1990
463
Paper: Taylor et
Q]
---
TABLE 2 - Summary of trial designs
TABLE 3 - Summary of longitudinal strip designs
Deck
l
2
Skew (")
0
0
Beam
End strands ecc (mm) Min. R12 link spacing (mm)
45
Y3 Edge
Y8 Edge 41 206 432 428
31 31
19 19 19 21 171 171
84
78
80
45
3
45
29 19
Span (m) Midspan strands ecc (mm)
4
29 19 Y3 Edge
Y8 Edge
31 31 45 41 206 432 391
82
75
The precast beams were designed as class 1 under load combination 1, and class 2 under load combination 3(i.e. when temperature effects were The precast units had a concrete of grade 50, with a strength at transfer of 40 N/mm2, and the tendons were assumed to be 15-2mm low relaxation strands with an initial force of 174 kN. Losses wereassumed to total 12 Vo at transfer and 35 Vo finally. Links were assumed to be 12mm diameter of grade 250. The results of the trial designs are summarised in Table 2. If compacted strands were adopted, the number of strands would reduce by about 22 Vo. The minimum link spacings are those required to resist torsion and shear and do not include an allowance for 'end block' effects. The maximum main reinforcement in the end diaphragms was 5T20 and the smallest spacings of R12 links were 69mm. The latter spacing is rather small and, in practice, it would be better to use T12 or R16 links.
Strip analyses In order to compare Y-beam and M-beam designs, simply ed longitudinal deck strips consisting of a single internal beam plus its top slab were designed for right spans of 19m and 29 m. For the 19m span the following beams were considered: Y3 at 1.Om centres; M3 at 1.Om centres; and M5 at 1-25m centres. For the 29mspan the following beams were considered: Y8 at 1- 0 m centres; M10 at 1 - 0 m centres; and M10 at 1.25m centres. In each case the top slab was 160mm thick and the material properties were the same as those assumed in the grillage analyses. Both HA and 45 units of HB loading were considered in load combinations 1 and 3 of BS 5400. In order to calculate the maximum HB moment, the transverse moment distribution for the cross-section shown in Fig. 11 was estimated using Morice & Little's charts". The maximum shear force due to HB loading was estimated using statics and by assuming a 45" spread of load to a . The results of the strip designs are summarised in Table 3. When the Y-beams at 1.Om centres are compared with the M-beams at 1-25m centres, it can be seen that the Y-beams are heavier, but require less links. The number of strands required for the two types of beam are similar. It should be noted that the 29m span is slightly excessive for M10 beams at 1-25m centres, and the bottomfibre is overstressd by 0.34 N/mm2 in compression at transfer and 0.04 N/mm* in tension finally.
Continuity For bridges of more than one span the designer has the choice between isolated individual spans or a single continuous structure. In practice this choice can be exercised twice, first to decide whether the bridge will be continuous for horizontal loading and then, if continuity is chosen, whether to choose continuity for vertical loading also. If isolated spans are chosen, each will need its own set of bearings at each pier and each will be separated from the next by a movement t. Since points of movement are notoriously difficult to waterproof,sooner or later these ts will leak, and water with all its dissolved corrosioninitiating chemicals will penetrate the bridge structure. If the bridge is made continuous for horizontal loads but not forvertical loads, individual bearings for each span are still required at each pier to carry at least the vertical loads. The junction between spans no longer needs a physical gap since horizontal loads are to be transmitted across it, but it must be able to accommodate the rotations required to prevent vertical shear and bending from being transmitted. In short, a hinge is required. This is usually provided by either leaving a short section of the deck slab uned by the main beams and thus reducing its bending stiffness or by introducing protected tie bars across the t and expecting the deck
464
I
19 M5
Beam Spacing (m) Beam weighthnit deck area (kN/m2) Beam depth (mm)
6.70
Midspan strands ecc (mm)
19 1919 27 300 317 171 171 300 305 84 75 84
-r
Span (m)
18 148
Min. R12 link spacing (mm)
111 82
19 148
1-25 1.0
M10 M10 1.25
10-8 14.0 8-64 1360 1400 1360 960
27
43 31 426 218352
40 388
19
22 29 306 184
22 303 309
I
End strands ecc (mm)
29 Y8 1-0
81 94 140 129
concrete to crack locally. In both cases, since there is no translational movement but only rotational, waterproofing is easier. However it must be said that reinforced concrete is not well suited to absorbing rotational deformation, so that the design is necessarily a compromise. The third possibility is a continuous structure for both vertical and horizontal loading. Only one set of bearings is required at each pier head which can therefore be made slimmer and, since there is no relative movement between the spans, waterproofing is easier. Larger ts are of course required at the ends of each continuous length, but then special provision can be made in these relatively few locations. On the other hand, the connection between the spans must be designedfor all the loading effects that will occur due to continuity and a structuralarrangement devised that can be conveniently built. Bending moments in continuous bridges are in principal lower than those in simply ed bridges but, as will be seen later, this advantage can be reducedin prestressed beam bridgesby the required construction sequence and by the effects of creep. It is often argued that the design of continuous bridges is more complex than that of simply ed bridges but, provided that a reasonably conservative design for hogging moments over the piers is accepted and adjacent spans are of similar length, the increased work need be only marginal. However additional work is sometimes required to design for the longitudinalmovements and forces. Table 4summarises the advantages and disadvantages of the three options discussed. It is also necessary to consider the effects of the upward creep of the precast beamsdue to prestress continuing to occur after continuity has been established. This creep gives sagging moments at the pier positions. It is difficult to provide an adequate tensile connection between the bottom of the beams to carry such amoment, and differentialtemperature and settlement effects can increase it significantly. It must, however, be said that, since the net moment is the sum of opposing effects, creep effects are critically dependent on the prestress arrangement, the local humidity and the age of the beam when continuity is established. A wide range of values can be obtained in different circumstances. sagging moment is a compatibility effect and would lead to cracking at the beam soffit, which is in a sheltered location and would not affect the ultimate capacity of the bridge deck. However, consideration of such a crack must be made in the design of the bearings under the in situ diaphragm. A similar situation occurs in relation to the stresses in the precast beam near the under hogging moments. The hogging bending stresses add to the prestress stresses, giving extra tension at the top of the beam and compression at the bottom, which can be difficult to accommodate in a prestressed concrete design as used for the adjacent diaphragm. The effect can probably be ignored, as is the American practice. Research has been carried out on this effect and is described in a further paper. Research to investigate these matters is now under way, and it is hoped that this will allow this most advantageous system to be used more widely. With its large bottom flange and robust web, the Y-beam would be particularly suitable for use in a continuous bridge of this type.
Conclusion The need for a new standard bridge to replace the M-beam has been demonstrated, and the development of such a new beam (the Y-beam) described. Trial designs have been compared with M-beam designs to demonstrate the viability of the Y-beam. Finally, problems associated with achieving continuity have been discussed.
The Structural Engineer/Volume 68/No.23/4 December 1990
Paper: Taylor et TABLE 4 - Advantages and disadvantages of different articulation schemes
Articulation scheme
Advantages
Disadvantages
Discontinuous for both horizontal and vertical loads
Movement ts small
Many movement ts with both translational and rotational movement making waterproofing difficult
Design need only consider each span separately
Less robust as the spans are independent Bearings need only cater for small movements
Two lines of bearings required at each pier, needing wider piers Each pier must carry the horizonal loads applied to the spans above Advisable to jack both spans at a pier equally when removing bearings, etc.
Most ts have to take rotation only making waterproofing much more effective
Continuous for horizontal loads Discontinuous for vertical loads
Some larger movement ts required Two lines of bearings required at each pier
Some increase in robustness against collapse The partial connection between spans makes the bridge more susceptible to progressive collapse Detailing and construction of the connecting slabs between spans is difficult Bearings must accommodate large movements
Continuous for both horizontal loads
and vertical
The designer can choose where to take out longitudinal forces
Where longitudinal forces are taken out, they are larger
Isolated transverse forces can be distributed between piers, reducing pier loading
Both spans at a pier must be jacked equally when removing bearings, etc.
Only isolated movement ts required
Movement ts must accommodate large movements
Waterproofing simplified
Some increase in design work for continuity effects
Detailing and construction of the connection between spans simplifed Only one line of bearings required at each pier allowing narrower pier heads
Bearings must accommodate larger movements
Maximum robustness against collapse Some reduction in design bending moments
The moment induced by creep should be considered
The designer can choose where forces can be distributed between adjacent piers
Loads on piers taking longitudinal forces are larger
Only one set of jacks required at each pier for raising deck
References 1. 2.
3.
4. 5.
r/Volume ctural The
Clark, L. A.,and West, R.: ‘Thetorsional stiffness of diaphragms in beam and slab bridges’, Technical Report 42. 510, London, Cement & Concrete Association, 1975, pp20 7. BS 5400 Steel, concrete and composite bridges: Part 2; Specification f o r loads, London, British Standards Institution, 1978 8. Department of Transport: ‘Loads for highway bridges’, Departmental Standard BD/37/88, London; 1989 9. BS 5400 Steel, concrete and composite bridges: Part 4: Code of practice f o r design of concrete bridges, London, British Standards Institution, 1984 10. Department of Transport: ‘Design of concrete bridges. Use ofBS 5400: Part 4, 1984,’ Departmental Standard BD/24/84, London, 1984 11. Rowe, R. E.: Concrete bridge design, London, CR Books, 1965 6.
Somerville, G.: ‘Standard bridge beams for spans from 7 m to 36m’, London, Cement & Concrete Association, 1970 pp32 Manton, B. H., and Wilson, C. B.: ‘MoT/C&CA standard bridge beams, prestresed inverted T-beams for spans from 15m to 29m’, London, Cement & Concrete Association, March 1971, pp36 Kirkpatrick, J., Long, A. E., and Thompson, A.: ‘Load distribution characteristics of spaced M-beam bridge decks’, TheStructural Engineer, 62B, No. 4, December 1984, pp86 Prestressed Concrete Association: Prestressed concrete bridge beams, 2nd ed., Leicester, British Precast Concrete Federation, 1984, pp10 Hambly, E. C.: Bridge deck behaviour, London, Chapman & Hall, 1976, pp272
68 /No.23 / 4 December 1990
465
Related Documents c2h70
The Y Beam 32484
December 2021 0
Conectar Y Usar Video Beam q353m
April 2021 0
The Beam- From The 5th Dimension 4e2324
September 2021 0
Gerber Beam i1513
December 2019 53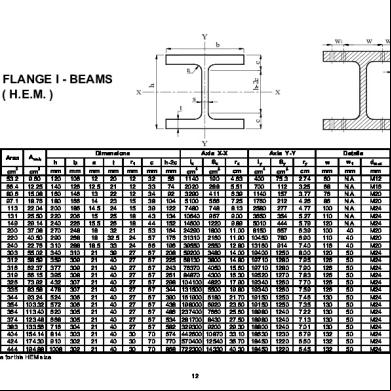
Hem Beam 6e2k3p
August 2022 0
Beam Diagrams 2f6x13
November 2022 0More Documents from "Sivakumar" 4rf2h

Welcome To Far East Packaging Ind (melaka 35163j
April 2022 0
Best Erotic Novels - Must-read Erotic Books 692l1p
November 2019 111
Glenium 51 2l4c3y
November 2021 0
Tds - Glenium 51 5rh2i
December 2021 0
The Y Beam 32484
December 2021 0