Tgbl Annual Report 2015 16 Web Pdf Filefbe7b6881a2368caa65dff02001c5be1 1z1r49
This document was ed by and they confirmed that they have the permission to share it. If you are author or own the copyright of this book, please report to us by using this report form. Report 2z6p3t
Overview 5o1f4z
& View Tgbl Annual Report 2015 16 Web Pdf Filefbe7b6881a2368caa65dff02001c5be1 as PDF for free.
More details 6z3438
- Words: 92,042
- Pages: 228
A N N UA L R E P O R T 2015-16
Connect with every sip
In this report Corporate Overview TGB at a Glance Vision, Purpose and Values Managing Director & CEO’s Message Performance Highlights (Consolidated) Strategic Priorities Consumer Insights
Develop Deliv Deligj develop deliver
delight
02 04 06 08 10 12
Develop Making the Perfect Cup of Chai A Brew to Drawing out Flavour and Fun
13 14 16 18
Deliver Building Sustainability into our Products Making Healthy Fun Brewing Connections over Coffee Super Teas to Supercharge your Day
20 21 24 26 28
Delight Reaching the Rural Indian Consumer Socially Responsible and Responsive In Keeping with Culture Coffee with F.R.I.E.N.D.S. Hello Mr. Barista! Consumer Relationship Service
30 31 35 36 38 41 42
Board of Directors Executive Office 10-Year Financial Highlights
44 46 48
Statutory Reports Notice
Directors’ Report Management Discussion and Analysis Report on Corporate Governance
49 58 97 104
Financial Statements STANDALONE Independent Auditors’ Report Annexure to Independent Auditors’ Report Balance Sheet Statement of Profit & Loss Cash Flow Statement Notes forming part of Financial Statements
125 127 132 133 134 136
CONSOLIDATED Independent Auditors’ Report Consolidated Balance Sheet Consolidated Statement of Profit & Loss Consolidated Cash Flow Statement Notes to Consolidated Financial Statements Subsidiary Companies’ Financial Highlights
169 174 175 176 178 219
connect every sip CORPORATE OVERVIEW 01-48
STATUTORY REPORTS 49-124
FINANCIAL STATEMENTS 125-220
WITH
Consumers are the centre of a business’ existence. They us, challenge us and inspire us to go the extra mile. Our beverage offerings and our business have consumer centricity embedded in them, we believe this is essential for business success. The theme of this year’s annual report ‘Connect with every sip’ is an exploration of how Tata Global Beverages (TGB) pursues consumer centricity in everything we do. Building a connect with consumers is a way of life for us. It is this connect that helps us build iconic brands, new routes to market and innovative beverage offerings. At TGB, we believe consumer centricity has to be part of the way the
organisation operates rather than being confined to just products or marketing campaigns. It starts right from the way we source our products to the way we craft our blends, respond to consumer queries, leverage Consumer Insights to innovate, decide on the best route to market and communicate our brand offerings. Within the pages of this report, you will find examples of our efforts in these areas. We take pride in the fact that over 300 million servings of our brands are consumed everyday across the globe. With the ability to touch the lives of many comes a sense of responsibility. TGB upholds the Tata Group’s promise on consumer centricity: - D EVELOP a deep understanding of the unique needs of our customers. - D ELIVER pioneering products and services of outstanding quality and value. - D ELIGHT our customers with great experiences at every touchpoint. The beverage landscape in tea, coffee and water is evolving faster than ever before. This has its roots in consumer trends such as isation, health
& wellness and convenience. Keeping pace with evolving consumer tastes across various geographies is both an opportunity and a challenge. It gives us the inspiration to constantly push our boundaries and reimagine the way we create and market our products. At TGB, we believe tea, coffee and water are beverages which can sprinkle subtle magic on your day. But they can do that only if our brands are in tune with consumer needs. Whether it is infusing tea with vitamins to meet consumers’ health & wellness needs, breaking barriers between consumers and farmers through our Farmers First Hand digital initiative, developing blends to deliver enhanced beverage experiences or delighting consumers with unique marketing campaigns - the common thread running through all these efforts is building a connect with the consumer. We hope you enjoy reading this report along with a cup of your favourite beverage. We aim to connect with every sip!
Annual Report 2015-16
•
Connect with every sip
TGB at a Glance Tata Global Beverages (TGB) is a natural beverages business with a heritage of innovation and development and an aim to be the most ired brand in the world. Our focus is to expand our global footprint by entering new markets and strengthening our brand portfolio in Tea, Coffee and Water.
Financial highlights 2015-16
Rs.
8111CR
Consolidated Revenue from Operations
Rs.
675 CR
Rs.
5.16
EBITDA
Earnings per Share
3000+
Employees worldwide
2nd
Largest player in branded tea in the world
60%+
of consolidated revenue from markets outside India
40+
Countries with significant brand presence
2
CORPORATE OVERVIEW 01-48
STATUTORY REPORTS 49-124
FINANCIAL STATEMENTS 125-220
Geographic Distribution
USA & Canada
Africa
Tetley Teapigs Tata Tea Good Earth
Tetley Joekels
Europe, Russia & The Middle East
Tetley Jemca Vitax Tata Tea Teapigs
South Asia
Australia
Tetley Tata Tea
Tetley Teapigs
Tata Coffee Grand
MAP
Eight O’ Clock Grand Coffee
Brand portfolio
Tata Gluco + Tata Water Plus Himalayan
Tata Tea brands National: Tata Tea , Tata Tea Gold, Tata Tea Life and Tata Tea Agni Regional: Tata Tea Chakra Gold, Tata Tea Kannan Devan and Tata Tea Gemini
3
Annual Report 2015-16
•
Connect with every sip
Vision, Purpose and Values
VISION
VALUES
To be the most ired natural beverages company in the world by making a big and lasting difference in Tea,
Coffee and Water.
PURPOSE We will focus on creating
magical beverage moments
for consumers and an eternity of sustainable goodness for our communities.
4
We recognise that agility is key to driving growth. We have a bias for action, seizing opportunities and responding to challenges proactively. We are committed to building an agile and responsive organisation, ed by equally nimble processes. With detailed action plans, timelines and measures we are focused on delivery.
Our goal is to evolve brilliant products and services that meet future consumer needs. We recognise that this requires a spirit of innovation and stretch, and a mindset that keeps consumers at the centre. We will continuously challenge status quo and seek alternative solutions, pursuing both global ‘new growth’ and strong ‘local’ innovations with equal zeal.
CORPORATE OVERVIEW 01-48
Our brands aren’t just products; they are promises we keep and experiences we deliver. With a structured approach we seek to develop valuable insights about what our consumers need – today, tomorrow and years later. For us, quality is foremost; we will not tolerate quality that falls short of promises and expectation. We are committed to building a strong ‘consumer first’ mindset, ed by rigorous consumer metrics. We will engage with our customers and build mutually beneficial business relationships.
STATUTORY REPORTS 49-124
We recognise that our ambitious goals can be realised only through cohesive teamwork. We encourage collaboration and gain commitment by involving the team in decisionmaking by creating excitement around common goals. With an open mind, we are willing to change our ideas or perceptions based on new information or contrary evidence.
FINANCIAL STATEMENTS 125-220
We do the right thing for the environment and community around us, while inspiring and empowering others to do the same. We are fair and ethical with all our stakeholders. It is important for us to provide an approachable and caring work environment and a physical workplace that is safe, healthy and clean.
5
Annual Report 2015-16
•
Connect with every sip
Managing Director & CEO’s Message
“We take pride in the fact that over 300 million servings of our brands are consumed everyday across the world.” Ajoy Misra Managing Director & CEO
Dear Shareholders, The year saw Tata Global Beverages initiating key product launches, strong marketing campaigns and category expansion, in a challenging market environment marked by macroeconomic volatility, high competitive intensity and sluggish category growth in some markets. Your Company is meeting these challenges through strengthening its core businesses, innovating for growth and tapping white spaces in the market. In order to ensure execution of our business plans, we will also focus on improving distribution reach and cost efficiency. Our profit after tax increased significantly, however profit from operations saw a decline due to commodity price increases, higher investment in brand building, promotional intensity and category decline in some developed markets. The fundamentals of the business remain strong with robust brands, extensive distribution networks, a healthy innovation pipeline and effective monitoring of cost efficiency. We see significant headroom for growth in many
6
of the markets we operate in and we are well positioned to leverage this with our strong brands and a heritage of expertise in natural beverages. Meeting challenges in the market, strengthening the business and ensuring long-term sustainable growth requires us to be keenly aware of our consumers’ needs and changing trends across the world which are impacting lifestyles and beverage consumption patterns. We do this through embedding this focus across our business and making sure we are consumer centric in whatever we do.
Connect with every sip
Our theme for this year’s annual report showcases the various ways through which your Company connects with consumers. We take pride in the fact that over 300 million servings of our brands are consumed everyday across the world. This means we have immense opportunity to build a connect with every sip. Consumer centricity is not new to Tata Global Beverages. In India, many years ago we launched tea in poly
packs at a time when no other brand did so, and created a revolution in the way tea was packaged and sold. Since then, your Company has evolved to become a branded beverages company, it has expanded its global presence, launched innovative products, expanded into the coffee and water business. But it has never lost sight of what lies at the core of it all - understanding the consumer. This, we believe is an intrinsic part of who we are and as we keep pace with fast moving trends and market developments, it will continue to be key to achieving our goals.
Leveraging the health & wellness trend
Over the last year, Tata Global Beverages has focused on leveraging the health & wellness trend across its markets. We see this trend manifest in different ways and at different stages in our markets, so our product offerings are customised accordingly. We continue to maintain a strong focus on our green tea portfolio. This is especially relevant given that we’re seeing the black tea category de-growing in some developed markets while green,
CORPORATE OVERVIEW 01-48
fruit & herbal and specialty teas are showing strong growth. Tetley Super Green Tea, launched in UK, has vitamins blended with the tea and is the UK’s first functional green tea. Encouraged by the excellent consumer response to Tetley Super Green Tea, we also launched a range of Tetley Super fruit teas. Intriguing flavour combinations and benefits relevant to the younger consumer were also made available. In the water segment, Tata Gluco Plus which is being marketed by NourishCo (a t Venture between Tata Global Beverages and PepsiCo) has performed very well during the year clocking a volume growth rate of 84%. The energy benefit the brand promises and its revamped communication has found favour with consumers and resulted in strong growth for the brand.
Innovating to stay ahead
Across markets, we’ve seen a clear emphasis on innovation based on strong Consumer Insights. In India, we entered the branded instant coffee segment with the launch of Tata Coffee Grand, which innovates both in of the blend as well as in its packaging and communication. We also launched a Tata Tea blend in India specifically customised for the Maharashtra market. This market was a white space for us and the launch enabled us to strengthen our presence there. Rural India is a challenge and an opportunity for beverage brands. With ‘Gaon Chalo,’ our rural distribution initiative we wanted to not just reach out to these markets, but do so in an innovative way that provided livelihood opportunities for people there. The Gaon Chalo model has proven very effective and currently covers over 74,000 villages across 19 states. Eight O’ Clock coffee in the US developed a specially crafted instant coffee blend for one of the largest retailers in that market. The brand has also adopted innovative ways of connecting with consumers such as inviting consumers to explore the flavours of Eight O’ Clock coffee through coffee thins - a tasty treat made of Eight O’ Clock coffee beans.
STATUTORY REPORTS 49-124
isation is a key trend we’re seeing in the beverages category with consumers seeking more indulgent beverage experiences. In response to this we’ve crafted a number of our offerings to cater to this need such as our super brand Teapigs in the UK. Teapigs offers innovative flavour combinations such as chilli chai and chocolate & mint tea.
Riding the digital wave
The digital medium is changing the way consumers interact with brands. Most of our brand launches during the year integrated digital communication into their marketing plans in order to create a stronger consumer connect. Whether it was Tata Coffee Grand using virtual reality to take consumers on a tour of the plantations, Himalayan mineral water inviting consumers to ‘Live Natural’, Tetley in Canada using a YouTube series to generate awareness and engagement around its specialty teas or the Tetley Farmers First Hand initiative which broke communication barriers between consumers and the farmers who grow their tea - innovative digital initiatives were a key focus area.
Connecting through sustainability
In all we do, sustainability continues to play a vital role. We focus on sustainability through our five pillars: Sustainable Sourcing, Climate Change, Water Management, Waste Management and Community Development. We live in a world where consumers are increasingly aware and interested in the way the products they buy are grown or made. So, integrating sustainability with our business also contributes to being consumer centric. Over the last year, we made good progress in Project S-PPF (Sustainable Plant Protection Formulation), an initiative to develop ecological solutions for plant protection in tea. We continue to stay actively involved with the trustea initiative in India and with the Ethical Tea Partnership and play a key role in these initiatives. We also commissioned a Climate Change report during the year on the
FINANCIAL STATEMENTS 125-220
74,000 villages across 19 states are currently covered by The Gaon Chalo model
impact of climate change in the tea growing regions of Assam. We believe this initiative will help us contribute to a sustainable and progressive future for the tea industry that also creates a positive societal impact. In conclusion, I would like to express my appreciation and gratitude for the we have always received from all our stakeholders. I trust that as you read through the pages of this Annual Report, you will obtain a clear view of the many ways in which we uphold consumer centricity to strengthen and grow our business. The consumer centricity principle is one of our core values and we believe in embedding it throughout our business. With warm wishes, Ajoy Misra Managing Director & CEO
7
Annual Report 2015-16
•
Connect with every sip
Performance Highlights (Consolidated) Revenues from Operations FY 2011-12
(Rs. cr)
6640
FY 2012-13
7351
FY 2013-14
7738
FY 2014-15
7993
FY 2015-16
8111
EBITDA
(Rs. cr)
FY 2011-12
623
FY 2012-13
768
FY 2013-14
752
FY 2014-15
775
FY 2015-16
675
Profit Before Tax
(Rs. cr)
FY 2011-12
574
FY 2012-13
637
FY 2013-14
707
FY 2014-15
500
FY 2015-16
545
Group Net Profit FY 2011-12
(Rs. cr) 356
FY 2012-13
373
FY 2013-14 FY 2014-15 FY 2015-16
8
481 248 326
CORPORATE OVERVIEW 01-48
Earnings per share (EPS) FY 2011-12
FINANCIAL STATEMENTS 125-220
STATUTORY REPORTS 49-124
(Rs.)
5.76
FY 2012-13
6.03
FY 2013-14
7.77
FY 2014-15
3.93
FY 2015-16
5.16
Segmental Revenue
(%) 1%
1%
25%
26% FY 2014-15
FY 2015-16
74%
Tea
73%
Coffee
Others
Brand Wise Sales
(%) 16%
16% 34% 14%
FY 2014-15
36%
33% 14%
FY 2015-16
37%
Tetley
Eight O’Clock
India Tea Brands
Others & Speciality brands
9
Annual Report 2015-16
•
Connect with every sip
Strategic Priorities TGB is the 2nd largest tea company in the world, and we aim to become the global leader in branded natural beverages. We aspire to grow our business by focusing on innovation that is enhancing the way consumers enjoy beverages, by growing our brands and investing in new and exciting opportunities to expand our business. We are building a global business, with 60% of the consolidated
Our strategy is built around 4 key pillars: Base Business Rejuvenation
Drive Innovation Agenda
Invest for Growth
Organisational Effectiveness
revenues coming from markets outside India. Our strategy focuses on product innovation, building global brands, strengthening our core markets and achieving success in new channels and markets, coupled with greater efficiency. We are focused on building unique competencies, differentiated offerings, appealing brands, and significant scale in the three natural beverage categories of tea, coffee and water.
Base Business Rejuvenation: TGB is home to iconic brands across the globe. As part of our strategy, we will continue to invest significantly to build our power brands in our 3 core categories - tea, coffee and water. We are committed to delivering profitable growth in our core businesses. A clear set of actions will drive this: • Focus on brand building, isation and enhancing distribution reach Our brands are what differentiate us in the marketplace. So, we will continuously engage with the end consumer through our brands. isation is one of the most prominent trends in the beverage category. We will leverage this trend by increasing the number of super and brands in our portfolio. Distribution reach remains critical to our business, we will focus on further enhancing reach through deepening existing channels and building new ones. • Grow non-black tea segments green, fruit & herbal The green, fruit and herbal tea segments are experiencing exponential growth. With multiple variants of green tea and fruit and herbal tea, in our portfolio, TGB is leveraging this trend. • Develop alternate channels Consumers are increasingly shopping for even their basic supplies online, and e-commerce has emerged as one of the most important trade channels across developed and emerging markets. At TGB, we recognise the importance of this changing consumption pattern. Therefore, across many markets we are working to build a strong presence in this channel.
10
CORPORATE OVERVIEW 01-48
Invest for Growth • Continue to invest in JVs At TGB, we have partnered with some of the biggest players in the beverages category to deliver products and innovations that delight our consumers. Our strong alliances and partnerships complement our vision of making a lasting difference in tea, coffee and water. We will continue to drive growth momentum through our JVs in India - Tata Starbucks (a JV between TGB and Starbucks Coffee Company) and NourishCo (a JV between TGB and PepsiCo) • Accelerate expansion of our super brand Teapigs into new markets Teapigs, our much loved super brand of tea from the UK, now retails in Australia, USA and Canada. We will focus on expanding Teapigs’ presence across more markets. • Scale up businesses in evolving markets We are committed to pursuing growth opportunities in new and evolving markets with potential. From exploring the vast tea-drinking markets in the Middle East, to building our strength in different categories across markets, we are continuously evaluating new and exciting options for growth.
STATUTORY REPORTS 49-124
Drive Innovation Agenda • Bolster R&D pipeline and launch new product lines with a focus on isation, health & wellness and convenience (new formats) We are challenging and changing the way consumers think about our beverages and how they enjoy them. Our growth will be driven by new products crafted to deliver on consumer needs. isation, health and convenience are key trends for our industry. Consumers want quality products that resonate with their goal to ‘live better’ in keeping with their preferred lifestyle choices. From single estate teas and coffees, to fruit flavoured and infused teas, flavoured coffees, functional water, and new formats of delivery we are committed to delivering enhanced beverage experiences to delight our consumers. • Strengthen innovation and new product development processes Sharp, well defined processes are required for us to innovate quickly, continuously and efficiently. We are continuously reviewing, improving and streamlining our innovation and NPD processes to help deliver and our strategy.
FINANCIAL STATEMENTS 125-220
Organisational Effectiveness • Reinforce organisational capabilities At TGB, our success is driven by ionate people. We are committed to creating a high-performance culture with high levels of engagement. Our goal is an organisation that is diverse, inclusive and global like the communities we serve. With ambitious goals, a unique culture and focused ‘talent’ strategy, we are making TGB ‘the place to be’. • Actively manage commodity costs - strategic buying and blending optimisation A well-thought strategy needs the of robust internal processes to succeed. We continuously refine our supply chain to ensure that we are connected, agile, cost conscious and sustainable. Best-in-class commercial processes and buying strategies are critical for us to be competitive in the market and are therefore an important part of our strategic focus. • Cost management Our global ambitions need to be underlined by a cost conscious mindset. We continue to look for opportunities to optimise costs while maintaining the quality of our products and services.
Our strategy is designed to deliver long-term financial performance and sustained shareholder value. We are committed to growing our revenues while improving profitability and optimising return on investment.
11
Annual Report 2015-16
•
Connect with every sip
Consumer Insights What does it mean to be consumer centric?
The first step to being truly consumer centric is a deep and insightful understanding of consumer needs. At TGB, the Consumer Insights team leads this mandate, interacting with thousands of consumers across the globe annually and helping functions across TGB leverage the power of Consumer Insights. How do you attract the consumers of tomorrow with new products? Will your new advertising campaign convince consumers to buy your products? How will you set your product apart in the cluttered retail environment? Will consumers notice your packaging on the shelves? These are questions the business faces daily and can only be answered by our consumers. How do we ensure that the consumer is represented at the table? At TGB, we do this by bringing the focus back to consumer centricity. At TGB the value of consumer centricity is based on two pillars: 1. The Tata Group’s Consumer Promise - the 3 D’s which help us answer relevant questions and deliver the right products 2. Cultivating and embedding a consumer first mindset, across the business.
The 3D’s
We use the 3D’s – Develop, Deliver and Delight – to generate insights and answer business questions: • We start by developing a deep understanding of the unique needs of our consumer. Annually, the Consumer Insights and marketing teams, speak to over 100,000 customers through multiple media such as digital, telephone, face-to-face etc. The team
12
uses cutting edge technology like Neuro-focus (that measures brain activity) and eye tracking to glean insights. This enables them to get a keen understanding of the consumer’s needs. For example, to attract the consumers of tomorrow, the Eight O’Clock coffee brand realised that consumers had an affinity towards the popular US sitcom F.R.I.E.N.D.S. Building on this insight, we crafted a consumer experience that brought together fans of this star studded sitcom over Eight O’ Clock coffee. Over a million consumers were exposed to this initiative through social media, PR and a pop-up store. • The Consumer Insights team works with teams across the organisation to help deliver pioneering products of outstanding value and quality. For example, our successful super tea project is built on two facts (1) over 50% of consumers in the UK take some form of vitamins and (2) tea is perceived as a healthy beverage. Marrying these two facts together enabled the team to build a powerful insight that subsequently led to the very successful super tea range. These teas have been launched in the UK and won the prestigious ‘Product of the Year’ award. • In today’s ultra-competitive world, our goal as an organisation is to go beyond delivering excellent beverages to delighting consumers at every touchpoint. While developing the new packaging for Tetley, the team discovered that consumers across the world perceived tea to be subtly magical. A cup of tea on a busy day can help one feel refreshed and relaxed. Add friends and conversations to the equation and you are connecting over a freshly brewed cup of tea. We used this insight to design the new Tetley packaging. The new
Tetley logo unit has been re-cast in the form of a smile, conveying just what the brand hopes to achieve - deliver smiles and moments of warmth. We hope this will delight consumers from the time they grab the product off the shelf to that magical moment when they have their first sip.
Embedding a consumer first mindset
The next step in our journey is ensuring that everyone within the organisation wears the consumer’s hat. That we adopt a consumer first mindset, not just within the marketing team, but across the organisation. To enable this, we are doing some things differently: • Partnering with senior leadership to ensure that consumer centricity is one of the five core values at TGB. Core values are the soul of the business, the guiding principles through which we operate. • Leveraging our Business Excellence Model (TBEM) to embed and evaluate our consumer centricity initiatives within TGB. • Creating a Global Insights function that manages research across all key markets. These global champions help functions across TGB collect, analyse and interpret consumer data across multiple touchpoints. “Truly understanding our consumers, their wants and aspirations, their challenges and needs, will define our action plan as a business and our trajectory of success. Consumer centricity is critical to TGB’s growth ambitions and embedding this across the organisation is essential.” says Mr. Garth Viegas, Director, Consumer Insights, TGB.
CORPORATE OVERVIEW 01-48
STATUTORY REPORTS 49-124
FINANCIAL STATEMENTS 125-220
Develop As we set out to achieve our ambitious plans of being the most ired natural beverages company, one thing is quite clear – our consumers will determine how successfully we undertake that journey. Developing a deep understanding of the unique needs of the consumer is really the first step towards serving them well. At TGB, consumer centricity means looking at a need or want through the lens of the consumer rather than the producer. It’s about understanding what problems consumers face in their lives and then providing mutually advantageous solutions. Take for instance Tata Coffee Grand, our foray into the branded instant coffee
segment. With Tata Coffee Grand we developed the country’s first blend of freeze dried and agglomerated coffee, for a ‘best-in-class’ taste experience for the Indian consumer. While in Canada, we introduced the string and tag/ drawstring tea bag with Tetley Signature Collection. This allowed consumers to squeeze out the last drop of flavour, without creating a mess – a key need expressed by consumers.
With the Tata Tea Chakra Gold Hot Tea Shop pack, we invited customers into the process of creating a blend which would best suit their needs. Developing a clear understanding of the diverse needs of our many consumers across the globe ensures that we are focused on giving them what they want.
13
Annual Report 2015-16
•
Connect with every sip
Making the Perfect Cup of Chai Small chai shops with regular consumers crowding around, for their cup of hot tea, is a common sight in most Indian towns, cities and even villages. Spiced with ginger and cardamom, this strong cup of tea is an integral part of the daily routine for many in India’s tea-drinking culture. It is not surprising then that out-of-home tea consumption s for almost 30% volume of the tea category.
For the country’s leading tea brand, Tata Tea, servicing the Hot Tea Shops (HTS) segment is important and Tata Tea Chakra Gold caters to many HTS consumers, with this segment ing for 30% of Chakra Gold’s total sales.
Mastering the art
The HTS customer is the most discerning of tea drinkers. HTS prepare multiple batches of tea per day as compared to household consumers.
30%
HTS segment s for 30% of Chakra Gold’s total sales
Brewing tea here is an art. Unlike the regular boiling method where all constituents are boiled together, in an HTS the water is first boiled and a decoction prepared with it. Then milk is poured in the glass with added decoction and sugar to release the required colour, aroma and aftertaste i.e. bite and strength.
The glass is then topped off with a swirl of decoction, along the rim of the glass that will flow down the sides giving it an almost two-layered look. A typical HTS outlet prepares 700 cups per day with an average of 8-15 cups per batch. Hence, it is imperative for the blend to deliver on its promise of consistent blend quality.
Putting the consumer first
Understanding the exact needs of this consumer segment is therefore critical. To better gauge this segment, multiple consumer connects were made by cross-functional teams consisting of the brand manager, sales manager, quality manager and the blender to understand the key requirements, drivers of preference and reasons for brand loyalty. Invaluable Consumer Insights were gained in these interactions and the blender translated the consumer speak to product quality using our internal tea tasting language ‘Uhuru’ to capture all deliverables of the blend, in detail. Our learnings revealed that key consumer needs of the HTS outlets were consistency, colour of the brew, strength,
14
CORPORATE OVERVIEW 01-48
aftertaste and running colour. Using the above insights, our blending team crafted multiple blends using the best Assam teas. These blends were tested across markets to identify the preferred blend. No blend is perfect till your consumer says so! In a break from tradition, we invited HTS Masters / customers to our tea tasting room in Bengaluru to
STATUTORY REPORTS 49-124
prepare tea on their own in a controlled environment and provide on these blends. The preferred blend was further optimised, using our tea blending expertise based on cues received to create a “wow” experience and achieve consumer delight. The blend was tested extensively across major outlets / markets and validated by the consumer, before we finalised and formulated the fixed recipe.
FINANCIAL STATEMENTS 125-220
A brew with a difference
Tea leaf quality and taste change across seasons due to variations in weather. To deliver a consistent blend across the year, our master blenders usually optimise the recipe by varying composition. For the first time, we arrived at a fixed recipe for the HTS consumer - year round even if it meant increased investment. Happy consumers are good for business. The results speak for themselves. The Q1 2016 volume of the Chakra Gold HTS packs have grown by 8%. A six-month loyalty programme has been kicked-off to on-board 1000 new outlets. In less than two months we were able to recruit 245 outlets, helping us fulfil our quest of keeping the consumer happy!
Consumer Speak “For us what matters is the number of cups I can make with your tea. Even a small variation in the quality of tea leaf impacts this. This new blend is able to meet our expectation and we are confident Tata Tea will give us consistent quality.” Arumugam S, HTS owner, Madurai.
15
Annual Report 2015-16
•
Connect with every sip
A Brew to Say instant coffee in a tea-drinking nation like India and only a couple of well-established brands pop into your mind. This year, one of the big initiatives for us was to disrupt the instant coffee market with a new and product that brings both experience and expertise to the table. TGB collaborated with Tata Coffee and made its foray into the branded instant coffee segment with the launch of Tata Coffee Grand in November 2015. Tata Coffee Grand has been crafted specially keeping in mind the evolving tastes of a growing breed of coffee consumers who seek the café culture coffee experience at home.
The product has been crafted, keeping the Indian coffee consumer in mind. Tata Coffee Grand offers an innovative and differentiated blend of the finest coffee powder and decoction crystals i.e. agglomerated and freeze dried coffee, for a ‘best-in-class’ taste experience.
Breaking new ground
Timing it right
The phenomenal growth of coffee cafés across India was indication that the time was just right to launch a product in the instant coffee category. With Tata Coffee Grand, TGB has set the ball rolling to drive coffee consumption in Indian households. Tata Coffee Grand’s distinct feature of ‘sourced primarily from the plantation’ is a concept which is unique and critical to the coffee segment in India. With this, we promise our consumers a delightful concoction of freshness and quality - a big differentiation in the current market scenario.
16
A gradual shift in consumption from traditional roast and ground (R&G) coffee to the instant version, led us to develop an instant coffee blend. Even in the South Indian markets, where the slow drip of R&G coffee through a steel filter is considered to be the only ‘real’ coffee, instant coffee is breaking new ground. The trend now leans towards the convenience and modernity offered by instant coffee and is sustained by an increase in household incomes. The instant coffee market s for Rs.1300 cr of the total packaged coffee market worth Rs. 2500 cr. With double digit* annual growth, there is enough room for new players to enter the instant coffee landscape.
*Source: Instant Coffee, value growth MAT March ‘16 as per AC Nielsen.
In India, TGB is a market leader in tea, in of volume and value, since 2008 and want to replicate this success in our coffee portfolio too. Our expertise and partnership with Tata Coffee, the provider of blends to some of the leading brands globally - Tata Starbucks stores in India, Eight O’ Clock in the US and Grand Coffee in Russia - we believe will help us reach this goal very soon. The instant coffee market is a competitive and challenging one which requires a strong focus on the overall brand experience presented to the consumer, in addition to a blend which perfectly balances all the product attributes.
So how did we stand out in this competitive market?
Our approach to this challenge is succinctly put by Mr. Sushant Dash, Regional President, India, at TGB - “We need to stand out and do things differently. We need to use lesser resources to get better results.” This thought translates into Tata Coffee Grand’s marketing mix which is both different and disruptive. “Besides the unique experience that we offer through Tata Coffee Grand taste, the packaging of our product breaks all category codes,”
CORPORATE OVERVIEW 01-48
DOUBLE DIGIT GROWTH
says Mr. Dash. Instead of brown, green and red, Grand’s blue packaging is clutter breaking and has images which clearly convey that the produce is fresh from the plantation. This approach has been extended to the advertising and brand communication too. The ad has at its centre a hip, South Indian granny dressed in rapper style hip-hop gear, rapping a song that tells consumers what it takes to make truly good coffee. The protagonist granny is anything but traditional. She has swag, an opinion on the latest happenings and is a tad mischievous. An active member of the Twitteratti she raps a viewpoint on everything; from the Oscars to the budget and any other topical issues. The granny’s rap is wooing consumers with her wisdom and new-age style.
Hitting the mark
Tata Coffee Grand is targeted at the young and young at heart, who are always curious about the latest in the food and beverages category. While this group of consumers want something and different, it wouldn’t be an easy shift for them to break-away from what they were originally consuming until there is enough incentive i.e. the new offering has to be superior. “You have to find the need gap which can be used to your unique advantage to build the product. Hence, TGB aims
FINANCIAL STATEMENTS 125-220
STATUTORY REPORTS 49-124
With double digit* annual growth, there is enough room for new players to enter the coffee landscape
1,300 CR
Rs.
The Instant Coffee market s for Rs. 1300 cr of the total packet coffee market worth Rs. 2500 cr
Creating a unique blend at Tata Coffee
Challenge
“For any company, one of the biggest challenges is to discover the need gap in consumer demand and fill it with a disruptive product. For us, an impending challenge was to provide customised blends to our prospective consumers. For instance, in South India, people prefer their coffee with chicory. In the North, however, people don’t want their coffee to be bitter. In order to overcome such challenges, we try to find gaps in taste through research and analysis.
Solution
An established market research firm, helped us to assess the potential of such a product. Identifying the right blend for the target consumer took a lot of effort and time. Our experts created 29 different blends for testing and selected one unique blend after doing a systematic study on consumer behaviour. The challenge that followed was to manufacture the product with consistent quality and to control operational efficiencies while manufacturing and blending the constituents.” - Mr. T Radhakrishnan, Executive Operations, Tata Coffee.
to offer consumers what they haven’t experienced yet.” adds Mr. Dash. Another interesting launch initiative was to sell the product on Amazon India as an exclusive offer for two weeks before it hit retail shelves. The result - Tata Coffee Grand entered the best sellers list. Consumer was very positive and gave us the confidence to journey on. Where to launch a product is as critical as when to launch it. South India is a mature market for coffee, and TGB expects that 70-80% of volume sales will originate here.
Way forward
Our future plans include building a complete coffee portfolio after evaluating and adding other offerings. We also plan to commence a series of ground-level activities in sampling and experiential marketing to promote Tata Coffee Grand. Growing within a traditional market, combating established competitors, winning loyal consumers with new offerings - these challenges and more lie before us. But in daring and doing things differently while meeting unique consumer needs, we are ready to face these challenges.
17
Annual Report 2015-16
•
Connect with every sip
Drawing out Flavour and Fun Tea drinking is straightforward: steep and sip. But for an avid tea lover, a richly infused sip brings a smile to their day and the flavour of tea becomes key to the tea-drinking experience.
2
70%
The brand received over 2 million impressions from promotional ads that ran for this campaign from October to December 2015
Contributed to 70% of Tetley specialty baseline growth
The need to squeeze more flavour from every tea bag, minus the mess was expressed by 52% of Canadian consumers who were interested in a tea bag with a string and tag. Consumers were also looking for more variety and taste. With ‘isation’ seeing an upward trend, Tetley leveraged the opportunity to grow share of its specialty tea, increase penetration, and ise the brand with the all new Tetley Signature Collection.
18
MN
Shaking up the specialty space
This contemporary range of teas was created to reinforce Tetley’s leadership position in specialty teas in Canada and to provide consumers with a string & tag/drawstring tea bag, which is what more than half of specialty tea consumers indicated was important. The new drawstring tea bag takes the mess out of steeping with its innovative design and 3 simple steps which allows
consumers to squeeze out all the flavour, drip-free. It also helps to maximise the flavours from your tea bag with flavours being squeezed into your tea cup and not left behind in your tea bag. We recognised that the new tea bag innovation would require education on how to use it, as it is not intuitive. So, we created a tactical ‘how to’ video and placed it on our Tetley.ca homepage. A TV commercial as well demonstrated
CORPORATE OVERVIEW 01-48
STATUTORY REPORTS 49-124
FINANCIAL STATEMENTS 125-220
Spotted on social media “Love these new teas!! Received a sample of ‘Mint to Be’ and loved it, bought all 4 flavours.” “The newly designed tea bags are a perfect solution to the problem and I just thought to let you know that I'm thankful. Also kudos to the design engineers who thought of this and came up with the idea.”
the tea bag usage very clearly. In all of our consumer communication a strong visual of how to use the tea bag is consistently evident.
These results are ed by very encouraging consumer testimonials and a positive contribution to the growth of Tetley’s baseline sales.
At TGB, listening to our consumers and developing products based on their needs is what drives us. Research showed that specialty tea drinkers enjoyed purchasing a variety of different flavours and the current offering in the Canadian market needed a boost. So, our Master Tea Taster, Mr. Mark Donovan developed 4 fun and flavourful signature blends to give consumers an eclectic mix of flavours with intriguing names to boot - ‘Keep Calm and Sip On’ (Camomile, Spearmint & Orange), ‘Mint to Be’ (Peppermint, Spearmint & Apple Mint), ‘High Tea’ (Black Tea with Vanilla) and ‘Citrus Kiss’ (Green Tea with Lemon & Grapefruit).
An exciting line of teas called for an exciting launch to garner visibility amongst consumers. But how do you increase awareness of a new technology in a category that hasn’t changed in the last 100 years? And, how do you reach an audience that is using technology to block traditional messaging? Research found that millennial audiences want a brand to entertain them; and Tetley wanted to be seen as an innovative brand, not just for its new product innovation, but also in the way they engage with their audience.
These popular flavours with a twist that infuse fun in every sip, have received great consumer response! • Innovative drawstring tea bag (78% of consumers agree). • Has exciting flavours (73% of consumers agree). • Personality/fun flavours (74% of consumers agree). (Source: Nielsen Bases Research, April 2014)
Diving into digital
Enter, Ms Labelled, Season 2 - a scripted series on YouTube and on a popular female-focused website Slice.ca. The series is set in the fast-paced world of a fashion magazine and select episodes were woven around the Signature Collection. The drawstring tea bags were cleverly integrated into the story line via a Drawstring Designer Challenge that required designers to create a piece of fashion using drawstrings. Also, for the first time in broadcast history, the web series was integrated into television and played between ‘Pitch
Perfect,’ a prime time movie and TV show featured on the Slice network. The series also travelled onto social platforms and TGB Canada was able to leverage this content and drive awareness with great consumer receptivity. • The brand received over 2 million impressions from promotional ads that ran for this campaign from October to December 2015. • 25,000 unique posts were created leading to 40,000 interactions. • In just 3 months, the show boasted almost 450,000 views on YouTube and reached over half a million people through television!
The outcome
The numbers and consumer speak for themselves: • Contributed to 70% of Tetley specialty baseline growth. • Achieved 1.2% Household Penetration (HHPEN), highest gain out of all specialty tea brands. • Gained loyalty in the Tetley Herbal segment (from 24.6% - 27.0%). • 90% of consumers liked the product after trying a sample. • 84% would recommend the product to a friend.
19
Deliver
Annual Report 2015-16
•
Connect with every sip
Delivering pioneering products of outstanding quality and value is the second step to being truly consumer centric. Having developed a good understanding of consumers’ needs, our next task is to deliver to consumers exactly what they need. For our consumers to truly cherish our products, we have to offer outstanding quality and value. Quality is non-negotiable and value always on top of the consumer’s mind. At TGB, our understanding of developing exactly what the consumer needs is wide-ranging and comprehensive. Across the world our consumers want the products they use to be sustainably sourced and produced. They want to ensure that the communities that produce
their daily cup of tea and coffee are fairly and justly treated. We understand this need, and it wholeheartedly by partnering with established organisations like Ethical Tea Partnership, Rainforest Alliance, amongst others that are committed to conserving biodiversity and ensuring sustainable livelihoods.
We are also devoted to delivering products that meet growing consumer needs. Health and wellness has been a growing trend amongst our consumers. In response, we launched Tetley Super Teas, the first functional range of teas in the UK with approved health benefits. The teas are fortified with different vitamins and minerals to benefit heart health, immune system, energy levels and hair and skin. Our endeavour to develop products of enduring quality and value also echo in our efforts with our JVs – NourishCo and Tata Starbucks.
20
CORPORATE OVERVIEW 01-48
STATUTORY REPORTS 49-124
FINANCIAL STATEMENTS 125-220
Building Sustainability into our Products Sustainable products are good for people, good for the planet and also good for business. Consumers today are increasingly aware and interested in the sustainability of the products they purchase. Has it been sourced, manufactured and packaged responsibly, is it a healthy product, is it eco-friendly? These are some of the questions that today’s consumers ask. At TGB, we believe that integrating sustainability into our products and in the way we do business is the right thing to do.
600+
50%+
FACTORIES
Currently, more than 50% of Tetley tea worldwide is Rainforest Alliance Certified™
The Trustea programme in India is targeting 500 million kg of tea from 600+ factories
As a recent World Bank Report revealed, the world today is showing improvement on many developmental indicators, but a lot of work remains which is encapsulated in the global Sustainable Development Goals (SDGs) launched by the UN in 2015. TGB’s sustainability initiatives align with many of the SDGs - sustainable production and consumption, providing productive employment, ensuring healthy lives, managing climate change and achieving gender equality. The global market no longer operates in silos, it is a networked structure, which means the way products are produced and consumed has implications across the world.
Sourcing it right
It starts from the source. Sustainable sourcing forms a key part of TGB’s strategy. In India, the Trustea initiative is a good example of this. TGB is one of the founding of the Trustea initiative in India, a multi-stakeholder initiative led by the Tea Board of India, to sustainably transform the Indian tea industry. The 5-year programme targets 500 million kg of tea from 600+ factories, and hopes to have a positive impact on the livelihoods of 5,00,000 tea plantation workers and 40,000 smallholders.
The Trustea initiative aims to protect the ecosystem while improving the quality of life for small tea growers and workers. This means that a Trustea certification for an estate certifies that production and manufacturing is being done according to sustainable principles. Globally, TGB is a founding member of the Ethical Tea Partnership (ETP), a noncommercial partnership of tea companies committed to improving the lives of tea workers and their environment, to create a thriving tea industry that is socially just and environmentally sustainable.
21
Annual Report 2015-16
•
Connect with every sip
TGB’s collaboration with Rainforest Alliance is another big effort in sustainable sourcing. Rainforest Alliance is an international non-profit organisation that works to conserve biodiversity and ensure sustainable livelihoods. It enables us to tackle specific sustainability issues within the tea sector. We are committed to sourcing 100% of our black teas from Rainforest Alliance Certified™ farms for all our Tetley-branded teas in Today, we monitor our EMEA (Europe, the Middle East carbon footprint in more and Africa) and CAA (Canada, than 70 different sites Australia and America) regions. in Asia, Africa, Europe, Currently, more than 50% of North America and Australia Tetley tea worldwide is Rainforest Alliance Certified™.
70+
Another TGB funded project focuses on training small tea growers in Assam, with the of ETP and Tea Research Association. As small growers produce around 40% of the total green leaves in India, sound training is required for better production of quality tea. The programme aims to improve yield and quality with better crop management practices. Around 2000 small growers are being trained initially in a special ‘cluster training programme’ which will continue till later this year.
Protecting the environment
Climate change is a reality and the categories we are present in – tea, coffee and water are all heavily influenced by climate change patterns. Our climate change strategy focuses on four key areas - sustainable agriculture, sustainable forestry, renewable energy and energy efficiency. TGB featured again on the Climate Disclosure Leadership Index (CDLI) in India. We have earned our position on the index by disclosing high quality carbon emissions and energy data through Carbon Disclosure Project’s (CDP’s) climate change programme with a score of 99 out of 100. Today, we monitor our carbon footprint in more than 70 different sites in Asia, Africa, Europe, North America and Australia.
22
The CDLI was developed by CDP, a global sustainability organisation that reports on behalf of 722 investors representing $87 trillion in assets. TGB is also listed on the S&P BSE Carbonex in India. It is a first-of-its-kind index that takes a strategic view of organisational commitment to climate change mitigation. Recently, TGB commissioned a study on the impact of climate change in the tea growing regions of Assam. The report aims at identifying those areas that will continue to remain suitable for tea cultivation, those areas that will require adaptation and those that may become unsuitable and hence, may need to switch from tea to other crops. TGB is also making good progress on Project S-PPF (Sustainable Plant Protection Formulations). This is an initiative between Tata Chemicals, Rallis, TGB and associate plantation companies KDHP in Munnar and APPL in Assam, to develop ecological solutions
for plant protection in tea. In a unique and fast-track collaborative effort, 20 multidisciplinary scientists from the Tata group have studied the biology and ecology of tea pests, identified alternative practices for their management, and conducted over 20 field trials on Non-Pesticidal Management (NPM) of significant tea pests such as Tea Mosquito Bug (Helopeltis Theivora), Red Spider Mites, Thrips, Blister blight, Tea Looper Caterpillar and Termites. The Indian tea industry loses 15-30% of its crops due to pests, diseases and weeds. The multi-locational field trials of plant extracts developed have shown initial success in different agro-climatic zones, especially towards controlling pest incidents of Red Spider Mites.
CORPORATE OVERVIEW 01-48
STATUTORY REPORTS 49-124
FINANCIAL STATEMENTS 125-220
Improving lives
Over 3 million workers are employed in tea estates across India alone. So, the industry s a very large number of people and livelihoods. Consumers increasingly want to be assured that the people growing their tea are well cared for and live a life of dignity. Improving the quality of life in the communities that we serve is a key part of TGB’s purpose. We are committed to the communities where we operate, and are proud to be a part of them. TGB is one of the funders of an ambitious project run by UNICEF and ETP, to improve opportunities for tens of thousands of children in the tea growing communities in Assam and reduce their vulnerability to trafficking and abuse. The project works with stakeholders ranging from community , panchayats, police force, health officers, district and state level governments. It aims to equip more than 25,000 girls with knowledge and life skills that will help them secure a better future and reduce their vulnerability to exploitation. It will give more than 10,000 community the knowledge and training to protect children from all forms of violence, abuse and exploitation as well as make families aware of children’s rights and the they can call on. We believe that the right to health is a fundamental part of human rights and of a life led with dignity. So, we have invested in hospitals in Munnar and Chubwa that provide inclusive and affordable healthcare facilities to about 100,000 people annually from local communities.
Breaking barriers
consumers can talk directly with the people who grow, harvest and produce their favourite cuppa. The thought behind FFH was to enable connection through conversation, and it does just that. With over 700,000 consumers connected on a single platform, this
digital campaign has taken on a life of its own and become a favourite - from more than a page to a platform to catch up on life. Conversations on the FFH page range from providing valuable insights into tea production and certification to sharing experiences on the farm and family life.
700,000+ CONSUMERS
With over 700,000 consumers connected on a single platform, this FFH digital campaign has taken on a life of its own and become a favourite
Consumers are increasingly interested in how products they buy are being produced or grown. Perhaps as a result of the fast paced lifestyle most of us lead, there is a yearning to connect back with nature, the ecosystem, growing practices and the very source of our daily food and beverages. TGB’s innovative digital initiative - Farmers First Hand (FFH) aims to provide that connect. FFH is an innovative social media initiative using Facebook, where
23
Annual Report 2015-16
•
Connect with every sip
Making Healthy Fun
The ‘Gas Minus Energy Plus’ drink, Tata Gluco Plus, has carved a niche for itself in the nutrient water segment. To revitalise the brand and ensure that its inherent purpose reaches the consumer, we revamped the brand’s identity last year. Real instant energy
Tata Gluco Plus, a non-carbonated energy drink from the house of NourishCo (a t venture between Tata Global Beverages Limited and PepsiCo India) was repositioned in the hydration market with a new look and a new voice. The
24
new visual design and communication proposition have lent a fun and energetic vibe to the drink. Playful imagery aided by colourful illustrations has been built into the communication to enhance the overall look and feel of the drink.
This restage was effective in reinforcing the energy credentials of Tata Gluco Plus and its ability to deliver on the need for a tasty energy alternative to carbonated soft drinks.
CORPORATE OVERVIEW 01-48
STATUTORY REPORTS 49-124
FINANCIAL STATEMENTS 125-220
Consumer Speak on Social Media
200 MN SERVINGS
Tata Gluco Plus is a young, four-year-old brand which has energised customers with more than 200 million servings
“I drink it at least once a day for instant energy! Thanks to Tata Gluco Plus, my life is energetic every day!” RAUNAK KUMAR
A significant part of the Indian population is anaemic due to Iron deficiency. Tata Gluco Plus provides instant energy through glucose, salt replenishment and iron fortification
“Really this is the best for summer. This drink is energetic, good for health and not only taste. The lime flavour is very nice.” ARUN ARUMUNGAM
“Much better than any cold drink. A healthy drink with no side effects, gives energy and keeps the body cool.” ADITHYA DHANRAJ
The genesis of this product began with identifying a need gap in the hot tropical Indian market. With a large number of people working outdoors, there was a latent need for a water-based drink that goes beyond being a mere thirstquencher. Until 2012, this was a huge unmet need in the mass segment which was looking for something delightfully refreshing coupled with convenience and affordability.
Big benefits, small package
An on-the-go, non-carbonated, re-hydration beverage, Tata Gluco Plus packs a punch in a convenient, easyto-use 200 ml plastic cup. It contains instantly energising glucose and minerals such as electrolytes and iron that recharge. A first of its kind, innovative cup format ensures product quality at a convenient price point, without any compromise on taste or flavour.
Outcome
The brand has doubled its volume following the restage in 2015. With more than 200 million servings to customers the current overall volume growth is 84%. (Source: Volume Market Share of LRB Ex. Water as per AC Nielsen March ‘16)
With Tata Gluco Plus, our main focus was to deliver a quality product in the health and wellness segment, offering a healthy drink at an affordable price. Based on consumer we delivered well on that front.
25
Brewing Connections over Coffee
Starbucks prides itself in creating a consistent, welcoming environment so customers, both new and regular, all over the world can enjoy their cup of coffee, exactly as they want it. Three primary components which Starbucks defines as the foundation of the Starbucks Experience are ‘our products, our places and our people’. Customers come for coffee, stay for the inviting warmth and return for the human connection. It is this commitment and connection that Starbucks is known for globally.
In October 2012, the Starbucks Experience entered India through Tata Starbucks Private Limited, a 50/50 t venture between Starbucks Coffee Company and Tata Global Beverages Limited. Since then, this partnership has grown to over 80 Starbucks stores across six cities. Consumers in India
26
have embraced the elevated coffee house experience for its highest quality Arabica coffee, delicious handcrafted Starbucks beverages and locally-relevant food in an unparalleled store environment driven by ionate and knowledgeable partners - our employees.
A fitting tribute
To mark the one year anniversary of Tata Starbucks Private Limited in India, the Company launched a special India sourced coffee, aptly named India Estates Blend - a unique whole bean offering to Starbucks consumers across India.
CORPORATE OVERVIEW 01-48
India Estates Blend captures the essence and rich heritage of the Indian coffee history and draws inspiration from the finest Arabica beans carefully selected from Tata Coffee’s estates spread across Coorg and Chikkamagaluru, the birth place of coffee in India. It is the perfect example of the strong synergy between Starbucks and Tata Coffee, and their commitment to develop and improve the profile of Indian-grown Arabica coffees. The country-specific blend has been named to represent the origin of the coffee and the packaging has been aptly designed to reflect the nuances of traditional Indian design. This debut of Indian coffee in the Starbucks world is a balanced and medium-bodied roast with layers of chocolate and herbal flavour notes. The product has since been extended across various markets in China and Asia Pacific in 2015 and in the USA through online sales. This launch is a testimony to our pursuit of the finest coffee with a rich heritage to enhance the consumer experience which is core to who we are.
Innovating for the Indian palate
At Tata Starbucks, beverage innovation is centred round the consumer’s need with the objective of creating a seasonally relevant, emotionally evocative beverage which has a story and cultural relevance. Alphonso Mango Frappuccino is inspired by mangoes - the king of fruits, loved by Indian consumers. This coffee-free, fruit based Frappuccino is made using pure Alphonso Mango puree blended with milk, ice and unique Starbucks Frappuccino ingredients to deliver the authentic taste of rich Alphonso Mangoes in a cup. Launched in the summer of 2015, this blended beverage is a seasonal offering crafted especially for the Indian palate. The success of this summer favourite ensured a return in 2016 as well. This offering alone contributed to 10%+ beverage volume and became the second
STATUTORY REPORTS 49-124
FINANCIAL STATEMENTS 125-220
Raghu Ram & Rajiv Lakshman
10%+
Alphonso Mango alone contributed to 10%+ beverage volume and became the second highest selling Frappuccino during the launch
Sonakshi Sinha
highest selling Frappuccino during the launch. The product was so successful that some of the China Asia Pacific markets have adapted the same concept for their respective markets this financial year.
Creating the ‘Fourth Place’
The new age millennial is a huge part of Tata Starbucks’ customer base. To engage this segment, Tata Starbucks required a campaign which would appeal to the consumer who is always on the move. So, Tata Starbucks went beyond stores to extend the Starbucks Experience to the digital space as well. Digital, for the Company, is the ‘fourth place’ after home, work and our coffee house. We build online communities through storytelling and two-way dialogue using Facebook, Twitter, e-mailers, SMS and microsites for specific campaigns with interactive content. The Company has been recognised for its recent digital campaigns to create meaningful connections that delight our consumers. Tata Starbucks also launched the innovative Sip Face Challenge last summer with social influencers and bloggers, to encourage the digital audience to indulge in the ‘Frappuccino spirit’. World No. 1 Bton player, Saina Nehwal changed her profile picture
on Facebook, posing with a bton racket and the Mango Frappuccino. This post received over 200,000 ‘likes’. Other youth influencers on Indian television like Raghu Ram and Rajiv Lakshman, actress Sonakshi Sinha and fashion & lifestyle influencer Miss Malini also created Sip Face videos, which garnered great engagement on social channels.
The results
The campaign generated an overwhelming response. Some of the key metrics include the 2015 Summer Best Digital Experiential Marketing Award in Starbucks Asia Pacific and over 100,000 incremental Facebook fans, 5300+ incremental Twitter followers, 59 online media releases and 57 million social media impressions. As on June 2016, Starbucks India Facebook page had 933,711 number of fans and 61,631 followers of Twitter. The campaign also witnessed a great partner-customer connect in-stores. It gave consumers the chance to rediscover the thrill of summer and adventure while creating personal moments of connection.
27
Annual Report 2015-16
•
Connect with every sip
Super Teas to Supercharge your Day The world is abuzz with the ‘healthy’ trend coupled with the need for ‘convenience’. The prominent insight underpinning this is accessibility to ways of maintaining health and fitness in the midst of a stressful modern lifestyle. This has led to the health and wellness segment clocking substantial growth in the food and beverages category, with the rise of products promising convenient access to good health and communicating clear and specific benefits.
28% Y-O-Y
The momentum behind Super Green Tea has enabled Tetley in UK to grow value share by 28% year-on-year
25%
OF TOTAL TETLEY GREEN TEA SALES In the last 12 months, Super Green Tea equates to 25% of our total Tetley Green value sales
28
The vitamin market in UK is growing rapidly with 1 in 3 consumers taking vitamin supplements every day, a practice that many find expensive and inconvenient. Consumers want to enjoy their healthy food and beverages without compromising on taste while achieving their health goals. Tea has benefited from its positive health association, especially green teas and fruitbased and herbal teas; and as a significant player in the tea industry, we responded to this growing trend. We sharply focused on the overall well-being that our products provided by launching a ground-breaking, innovative line - Tetley Super Teas.
CORPORATE OVERVIEW 01-48
STATUTORY REPORTS 49-124
The right mix
have been turning away from tea. To further drive penetration, more intriguing flavour combinations and relevant benefits to the younger consumer were made available this year, relating to heart health, mind, detox and beauty.
Tetley Super Teas is the first functional range of teas in the UK with approved health benefits. The teas are fortified with different vitamins and minerals to benefit heart health, immune system, energy levels and hair and skin. The main challenge was to ensure that the vitamins could withstand the hot brewed process and were evenly distributed in the product without affecting the taste. We formulated the products with care and redefined the manufacturing process to ensure that every single tea bag had the right amount of vitamins based on recommended serving. The range was first introduced with four Super Green Tea variations. Super Green Tea Immune containing Vitamin C to boost the immune system was launched in two delicious flavours - Tropical and Lemon & Honey. To reduce tiredness, Super Green Tea Boost with added Vitamin B6 was brought into the market with Berry Burst and Lime flavours. In addition to the vitamin enhancement, the new range delivered on taste too.
The wide range of benefits offered by this range now gives consumers an added reason to drink green tea. The functional benefits have appealed to shoppers and repeat rates of purchase have been high. Nearly 28% of buyers are completely new to tea, thereby growing the category and reinvigorating the tea market as a whole. 25% of our total Tetley Green value sales and the line-up has propelled Tetley Green tea to the No. 2 spot making Tetley the fastest growing green tea brand in the UK.
Capturing the market
Building on the huge success of Super Green Tea, the team followed it up with another exciting launch - Tetley Super Fruits. These fruity infusions in Immune and Boost variants, met with good market response. Lemon & Ginger and Peach & Orange flavours constitute Tetley Super Fruits Immune with added Vitamin C while Tetley Super Fruits Boost with added Vitamin B6 come in Cranberry & Elderberry and Blueberry & Raspberry flavours. With more than a quarter of fruit and herbal drinks bought for health reasons there is a strong market opportunity for these new products. Unlike many fruit and herbal drinks, Tetley Super Fruits are made from natural flavours delivering a superior taste which scored highly in taste tests.
Tetley Super Green Tea soon became a hit! The taste, combined with functional benefits, has been drawing in consumers making Super Green the No. 1 NPD (New Product Developed) in the UK. In the last 12 months, Super Green Tea equates to
FINANCIAL STATEMENTS 125-220
The focus on healthier lifestyles has created a very positive market for this range. The momentum behind Super Green Tea has enabled Tetley in UK to grow value share by 28% year-on-year. With the Boost and Immune variants doing exceptionally well, it was important to extend the range to include other popular health benefits which are appealing to younger consumers who
The ‘super’ concept is being rolled out in other geographies and as a company we are pushing boundaries in the area of health with exciting innovations in the pipeline.
The outcome
The superior taste of the natural flavours used has been rewarded with a 2015 Great Taste Award for the Lime variant of Tetley Super Green Tea Boost. The Great Taste Awards is one of the world’s largest and most trusted food and drink awards where products are assessed on taste alone, by a large of food experts, top chefs, buyers, retailers and food writers. The recognition reaffirmed that Tetley has yet again delivered on the ability to provide a good quality cuppa, suited to a variety of tastes. Tetley Super Green Tea range also won the coveted 2016 Product of The Year, the largest award for product innovation voted for by consumers. Only 40 products win per year, with over 11,500 households participating in the vote. Super Green has now achieved 3.6% value share of the total green market in UK and is bigger than main competitors. We have sold over 1.7 million packs of Super Teas since the launch in early 2015, achieving £2 million retail value and securing strong distribution through this unique proposition. Being healthy never tasted so good!
29
Delight
Annual Report 2015-16
Delight, the third D of our consumer promise, is all about putting a big smile on the consumer’s face. Every brand we market has many touchpoints with consumers – the packaging and advertising of our products, the on-ground activations and promotions, our people who interact with consumers, and our website and mobile applications. We have the opportunity to delight the consumer at each of these touchpoints.
For instance Gaon Chalo, our effort in last mile distribution in rural Indian villages, is all about ensuring that we create the networks that allow us to serve consumers in far-flung geographies. While Eight O’ Clock coffee’s partnership with Warner Bros, in the US, to commemorate the 20th anniversary of the star-studded sitcom F.R.I.E.N.D.S. was all about creating an on-ground experience around coffee with a strong cultural and emotional tone. In the Middle East we are attempting to delight consumers by weaving our brand story into the local culture. And in Canada we invited consumers to select a Tetley ‘pink pack’ to Canadian Breast Cancer Foundation. Serving up consumer delight is about ensuring that at every touchpoint we produce experiences that reiterate our brand values, create an emotional resonance with consumers and ultimately lead to brand loyalty.
30
•
Connect with every sip
CORPORATE OVERVIEW 01-48
STATUTORY REPORTS 49-124
FINANCIAL STATEMENTS 125-220
Reaching the Rural Indian Consumer Close to 70% of India’s population resides in villages. This large rural market presents great opportunity for growth. And while everyone talks about the sizeable opportunity lying at the bottom of the pyramid, very few have gone down that path and succeeded.
26% OF THE POPULATION Serving the rural consumer with our brands and products presented many challenges. There existed no effective last mile distribution network that would ensure our products reach the deepest and farthest corners of this large subcontinent. Building awareness of our offerings was another concern. A huge number of villages in India are ‘media dark’ (very little media reach). There is no reliable electricity source and therefore
limited access to TV. Literacy levels are low, ruling out the print medium. Responding to the challenge for an effective distribution network, the ‘Gaon Chalo’ model, was born. The programme is our effort in last mile rural distribution. While tapping unreached rural markets, the programme also provides a means of sustainable livelihood to women, youth and small entrepreneurs, who us as
TV barely reaches 26% of the population in UP, the lowest in the country. This statistic is further endangered by the frequent power cuts which last for 12-16 hours a day
channel partners. This programme, run through NGOs, is present in more than 19 Indian states and benefits a number of women and youth.
31
Annual Report 2015-16
•
Connect with every sip
The strength of Gaon Chalo lies in understanding rural as it exists - identifying unique rural channel partners, leveraging their strengths to design a non-traditional, yet effective business model, while helping create a culture of entrepreneurship and self-sufficiency.
19%
Our next challenge was creating awareness around our offerings. We needed to craft a customised marketing strategy for the rural consumer, leveraging the media they use most. Uttar Pradesh (UP) was the market chosen for this initiative. The first step in solving this challenge was identifying the medium with the most reach. With higher reach than TV, the mobile phone emerged as the most cost-effective medium in rural UP. TV barely reaches 26% of the population in UP, the lowest in the country. This statistic is further endangered by frequent power cuts which last for 12-16 hours a day. Consequently, the mobile phone emerged as a medium of empowerment providing a window to the outside world, especially for women.
Campaign with a cause
Consumers in rural UP were hungry for entertainment. This presented an opportunity to entertain and empower
IN RURAL INDIA, PEOPLE ADOPT A SMART MONEYSAVING PRACTICE: INSTEAD OF SPENDING PHONE CREDIT ON ACTUAL CALLS,THEY GIVE A MISSED CALL PROMPTING THE OTHER PERSON TO CALL BACK.
32
Sales shot up by 19% in the campaign markets versus a mere 2% in the whole state of UP
all at once. The Gaon Chalo Mobile Activation campaign was thus devised. In rural India, people adopt a smart money-saving practice - instead of spending phone credit on actual calls, they give a missed call prompting the other person to call back. The Gaon Chalo Mobile Activation platform leveraged this very insight. The idea was simple, effective and customised to the rural audience. Consumers would give a missed call to an d toll-free number, and then receive a free call back. The return call would offer Bollywood songs interspersed with brand messaging, thus raising awareness of our products. This mobile offer was publicised through ments painted on walls. At TGB, we went a step ahead. We also used this opportunity to raise awareness on relevant social issues. The social content dispersed through the platform covered women’s issues like female foeticide, dowry and eve-teasing in a manner that was relatable. The aim with this approach was to inform and thereby empower women to make a difference in their own lives.
Some of our earlier initiatives and campaigns assisted in driving the objectives of the Gaon Chalo Mobile Activation campaign. We used the vast repository of over 8 lakh issues amassed during the “Power of 49” campaign to zero in on the issues and concerns of people at the district level in rural UP.
CORPORATE OVERVIEW 01-48
An inference made from the results was that locals were closely impacted by the issues at a micro-level as opposed to people in the urban areas who were mostly affected by macro issues. A good example of this is corruption versus black marketing. People in villages are adversely affected on a daily basis by black marketing, a micro-level issue. Thus, the social evils of black marketing along with other such pertinent concerns formed an important part of the free mobile content. Our leading social awareness platform Tata Tea ‘Jaago Re’, was also re-crafted to
STATUTORY REPORTS 49-124
better suit the rural audience. We shifted the focus from ‘National interest’ to ‘Neighbourhood upliftment’ by weaving micro issues into campaign content. The introduction and discussion of social content in this manner helped sensitise rural audiences in a subtle and engaging way. The campaign positioned itself as a good mix of social education and entertainment - it was social edutainment at its best.
FINANCIAL STATEMENTS 125-220
Our leading brand Tata Tea Agni was enlisted for the role. We personified the brand through the character of Agni, the torchbearer in solving issues. The ‘Jaago Re’ campaign was used as a launch-pad to position Tata Tea Agni as a catalyst who had the answers to drive social change. Agni was inspirational in her delivery of powerful and effective solutions for issues, in true ‘Jaago Re’ style. All of this helped awaken people’s conscience in small but important ways.
It was also important for the campaign to have a character, a voice, to effectively connect and convey the content.
Consumer Speak:
Outcome
“The entire content is heart touching. When companies , we expect them to promote their products. What I liked here, was the part where they talked about people wanting to know the gender of the baby during pregnancy. This is something which should be abolished from our system. This tradition has been there for too long a time. ”
The campaign achieved all that it set out to do and then some more: • Sales shot up by 19% in the campaign markets versus a mere 2% in the whole state of UP
-Mohan, Allahabad.
• Brand consideration for Tata Tea Agni went up by 16% and brand imagery by 19% in just 3 months (Source: Millward Brown) • Unique Reach by the media was 6 times the set target (Source: Own mobile data backend) • Consumers spent 9 minutes engaging with the campaign content versus the benchmark of 90 seconds (Source: Own mobile data backend)
This year, Gaon Chalo Mobile Activation campaign was recognised and awarded for its impact and reach with the EMVIE Gold for Best Media Strategy Consumer Goods, Ad Club Big Bang Awards and the Tata Innovista (Global & Regional) Awards
• Social benefits accrued to the Gaon Chalo campaign by way of increased sales was translated into increased income for the last mile sales representatives and also helped generate additional employment in villages through NGOs
What led to the success of this campaign?
“Keen insight into the lives of rural consumers was the defining factor for success.” says Ms. Sonia Serrao, Deputy General Manager, Media & Marketing Procurement, TGB. “The campaign was crafted by keeping the rural consumer at the very centre. The content they like, the media they subscribe to and the issues that concern them formed the building blocks for the campaign. We delivered something that not just built brand awareness and boosted sales but went a step ahead and started a conversation on social issues close to their heart. We delighted our consumer by providing a novel experience, through an unexpected touchpoint.”
33
Annual Report 2015-16
Bringing consumer centricity to the heartlands of India
Our sales force is essential in delivering our promise of consumer centricity to the heartlands of India, challenged by limited media access and poor connectivity in these areas. From understanding consumer needs to servicing rural stockists and encouraging
•
Connect with every sip
consumer trials, our sales force is critical in making the last mile connect truly effective. Gaon Chalo was conceived as a rural penetration channel as well as an opportunity for inclusive growth. Rural entrepreneurs in our Gaon Chalo initiative, serve as our de-facto sales force.
Neeraj Verma, a rural distributor from the Barabanki district of UP has been associated with Gaon Chalo for a decade now. During this time, he has grown significantly within the Gaon Chalo hierarchy and currently manages the Barabanki district (UP). A critical link between TGB and the rural stockists, Neeraj describes how we are slowly but surely building an effective network to serve rural India.
What work does your job entail on a day-to-day basis? I am responsible for two District Co-ordinators (DC), who manage the Barabanki district. My job is to supervise and fulfil requests that come in from the rural areas through my team. My team is responsible for ensuring that TGB products are transported to remote areas in good condition and in a timely manner. On a day-to-day basis I monitor the stock in my district, process requests and manage the chain of money/credit. Every day, I try and visit a market with a team member to ensure that rural stockists, who receive our stock at their doorstep for sales to micro interior village shops and houses, are being serviced appropriately. I try and understand what our consumers want. What do you like about your job? What excites you? I experience great pride in working for the Tata group, and ensuring that consumers in the heartlands of India get to experience natural products that are good for them. The Gaon Chalo programme provides employment to
34
rural youth. These small entrepreneurs earn enough to take care of their families without having to leave their homes for employment opportunities in big towns. In a small way, we are able to strengthen the rural economy and that adds meaning to my job. How do you serve your customers and resolve their queries? Both I and my team are committed to living the Tata values. I believe we do this by providing rural consumers with products of great quality that they can trust. The needs of rural consumers are not all the same - there are some who want good value for their money and others who want the best quality. We match our products to their demands. Depending on their need we sell the many variants of Tata Tea - Agni, , Gold. We also try and build awareness about the quality of our teas by organising small activations in the village hot tea shops. We brew our Tata Teas and other local teas, side-by-side. When left aside for a
short while, the local chai loses its golden colour, whereas Agni tea remains just the same. We invite consumers to taste our tea. We have found that these activations showcase the quality of our products to consumers, who are then keen to buy them. Everyone in the Gaon Chalo chain is geared to serve the consumer. Tell us more about yourself My entire family was dependent on agriculture – my two brothers and I had no other choice but to plow the fields. We come from a low-income family. With Gaon Chalo I got the opportunity to fulfil my family obligations without leaving my native town. After ten years with this initiative, I have progressed quite a bit. I have been able to construct a small house for my family, and my son and daughter attend government school. It is my hope and wish that the next generation continues to be associated with the Tata group and we together are able to build a better future for the rural economy.
CORPORATE OVERVIEW 01-48
STATUTORY REPORTS 49-124
FINANCIAL STATEMENTS 125-220
Socially Responsible and Responsive As a brand that aims to delight our consumers, we at TGB go beyond providing quality and innovation in our products. We also stand in of the social concerns that affect the lives of the communities we serve. One such grave concern is breast cancer. Breast Cancer is the second leading cause of cancer deaths in Canadian women, after lung cancer - 1 in 4 (26.1%) cancer diagnoses are breast cancer. Tetley in Canada has been a staunch er of the Canadian Breast Cancer Foundation (CBCF) since 2001. In our continued of CBCF, an organisation that assures the best in breast cancer research and breast health education and advocacy initiatives, we have donated over $550,000 ($50,000 annually) till date.
Pick the pink
Consumers are the reason for our existence; they are our final and most important stakeholder so we wanted to engage with them meaningfully on a cause that we have ed and promoted for a decade and a half. To highlight our for the CBCF and to deepen our engagement with our loyal Tetley consumers, we decided to provide them with an opportunity to pick the final pack design for our limited edition Tetley ‘pink pack’, where 15 cents from the sale of every pack would be contributed to CBCF. Tetley guaranteed a contribution of $50,000. We chose 4 potential designs and leveraging the growing power of social media, we invited our loyal community of Facebook fans to vote for the pack they liked the most. The one with the most votes would be converted into an actual Tetley pack.
Consumers were delighted with this opportunity to pick a pack design. We received instant and comments from consumers. The initiative reached over 140,000 people and received over 10,000 engagements. The campaign posts on Facebook achieved both the highest organic reach and a record-setting engagement rate of nearly 10%, which is well above industry norms. In October 2015, we released 350,000 limited edition, consumer-selected ‘Pink Packs’. The comments on our Facebook page were truly heart-warming and the love that consumers felt for the Tetley brand shone through, along with their and encouragement in the form of purchases of the limited edition packs.
“At Tetley Canada, we have been longstanding ers of CBCF. With the ‘pink pack’ initiative we wanted to not just showcase our to this great cause, but also take our consumers along on that journey. We wanted to engage in conversations, outside of the banal, that showcase our solidarity for the big issues and challenges our consumers face” stated Ms. Kathy Grant-Munoz, Senior VP, Marketing and Sales, Canada, for TGB when talking of the objective for the campaign. “The campaign not just helped promote awareness for breast cancer, but also provided an opportunity for our Facebook community to share their own experiences and the cause.” she concludes.
Consumer speak – Facebook campaign
“Hard to choose - so make all four and we can make our choices at the store or buy all four - which is what I would do. Thank you for your of this very worthy cause.” “Fabulous designs! Amazing cause! Love them all, but A is my fave! Great job Tetley!” “Two time breast cancer survivor chooses A!!”
35
Annual Report 2015-16
In Keeping with Culture TGB has been selling branded tea in the Middle East for several years and the region represents an integral part of our global expansion plan.
TGB has been selling branded tea in the Middle East for several years and the region represents an integral part of our global expansion plan. Confirming this fact is TGB’s Managing Director for the Middle East region, Mr. Danny Finney. “Our growth strategy is to capture a sizeable brand share for Tetley in the Gulf Cooperation Council (GCC) countries and to then use that as a springboard for expansion into wider Arabia. Our goal is to reach the No. 2 position in five years. In order to achieve that, we need to deliver products that suit the local palate, brand communication that cuts through and brand experiences that create delight for local consumers.” The six GCC countries which are the current focus of TGB’s efforts are Saudi Arabia, United Arab Emirates, Kuwait, Oman, Qatar and Bahrain. In these traditional tea-drinking markets, Tetley is positioned as a international brand with innovation, differentiation and local relevance at its core. For example, the brand was launched in this market with the innovative drawstring tea bag format, which allows consumers to squeeze every last drop of flavour from bag to cup. Also, our brand campaign is locally relevant. The campaign thought ‘Squeeze more out of life’, ties the benefit of the drawstring bag to the attitude of the new generation of Arabs.
36
35%
Tetley was the fastest growing brand in the GCC in 2015 with 35% growth over prior year
The next step was to make the brand more relevant in everyday life, by crafting new opportunities to experience the brand. We therefore implemented several brand building activities to delight consumers and generate product trials for Tetley Drawstring tea bags.
•
Connect with every sip
CORPORATE OVERVIEW 01-48
STATUTORY REPORTS 49-124
FINANCIAL STATEMENTS 125-220
A long drive through traffic-filled city roads can be tiring. A beverage has the potential to make this ride refreshing. Building on this very insight, we gave Tetley tea samples to consumers at petrol stations / service stations. Every motorist waiting to fuel up their vehicle was treated to a refreshing cup of Tetley Strong or Golden black tea. A team of promoters worked tirelessly every day during the peak hours of 5 pm to 10 pm. The 14 service stations were specifically selected based on high traffic volumes to optimise impact. More than 220,000 consumers across varied demographics sampled and enjoyed a cup of warm Tetley tea. Consumer sentiment was very positive with an average sample acceptance rate of 45%. Thanks to a specifically designed tray which held 4 cups together with a storage chamber, each promoter was ‘hands free’ thereby enabling him to demonstrate the unique Drawstring function to consumers.
Fitness is an emerging trend across the world, and it is no different in the Gulf. Tea has always been viewed as a refreshing, healthy and natural beverage. In Kuwait, we brought the natural goodness of a cup of tea to fitness seekers in a gym. The of Fitness First, the largest privately-owned health club group in the world were treated to samples of Tetley Drawstring black and green tea, following their gym session. Branded counter-top units holding drawstring envelopes, branded cups and water boilers were placed in their member lounges. Following the success of this campaign Tetley has signed a bigger contract with Fitness First in which Tetley will be served in all the 58 ’ lounges across the GCC gym network. Projected servings are 50,000 cups per month. As part of the tie-up, Fitness First and Tetley will also carry out t marketing activities using social media, email alerts, in-gym branding and t consumer promotions thus leading to a wider reach with consumers.
Ramadan is an important month in the GCC countries. Tetley shared the Ramadan spirit by offering free Tetley samples in mosques during “Iftar” – the evening period when Muslims break their fast after prayers. This promotional activity held in Kuwait and UAE was carried out through the presence of both stationary branded booths and mobile promoters with backpacks. The drive received a phenomenal response with Tetley being sampled by 105,000 worshippers at 80 mosques across the two countries during the holy month.
An innovative way in which these sampling drives were carried out was the use of branded backpacks used by promoters to serve consumers on the move, quickly and efficiently. A first for the region was mobile sampling conducted in a large gathering at a live televised football match in Kuwait. The Tetley brand was also featured on the perimeter LED advertising hoarding with the line ‘Squeeze more flavour from your tea’ along with pack shots of the core variants - Strong and Golden.
220,000+ More than 220,000 consumers across varied demographics sampled and enjoyed a cup of warm Tetley tea “Being locally relevant is key. In all our sampling and promotion efforts in the Middle East, we have attempted to find a space for Tetley in daily life and in local culture. Consumer delight begins with understanding consumer needs in relation to local culture. That is what we have attempted to do to drive growth in the GCC market.” Mr. Finney signs off. All of these efforts were rewarded with great revenue results. Tetley was the fastest growing brand in the GCC in 2015 with 35% growth over prior year.
45%
Consumer sentiment was very positive with an average sample acceptance rate of 45%
37
Annual Report 2015-16
•
Connect with every sip
Coffee with F.R.I.E.N.D.S. Many marketers today will argue that ‘the experience is the brand’. Achieving consumer delight is no longer just about a quality product on the shelf, or even about great engagement in-store. It is much more than that – it is about taking ownership of the entire consumer experience and steering the interface between the Company and the consumer.
beans from the world’s most popular coffee regions and expertly blends and roasts them to achieve consistent, great tasting cup profiles which have stood the test of time. It is the 3rd largest bagged coffee brand in the USA, in of volume.
Brewing a brand experience
Going beyond the product benefit and message to reimagine the whole consumer journey to deliver new signature moments, is what creating consumer delight is all about. TGB’s coffee brand in the US – Eight O’Clock (EOC) Coffee, did just that. Drawing from iconic pop-culture on the silver screen, EOC created a unique experience for coffee lovers, with a little help from F.R.I.E.N.D.S. at Warner Bros.
Coffee with a legacy
EOC, America’s Original Gourmet Coffee, has a rich legacy of 150 years and brings to consumers high quality 100% Arabica coffee at great value. EOC carefully selects coffee
38
However, the growing popularity of K-Cups was crowding out EOC bagged coffee on retail shelves and declining bag sales were impacting the business. Connecting with a younger demographic was also proving to be a challenge. EOC Coffee needed a jolt to stand out. We needed to create an experience that would excite retailers and consumers, pampered by an array of sale priced options.
Coffee with F.R.I E.N.D.S.
The star-studded iconic sitcom F.R.I.E.N.D.S. was celebrating its 20th anniversary - the perfect time to create ‘Coffee with F.R.I.E.N.D.S.’ To celebrate this milestone, EOC Coffee ed hands with Warner Bros. to open a replica Central Perk coffee shop, identical to the one frequented by the characters of the hit, Emmy®-winning comedy. The pop-up replica promised to provide a variety of unique
experiences - including complimentary coffee and F.R.I.E.N.D.S. themed fun - for fans and coffee lovers alike. This was a big idea that brought two iconic coffeecentric brands together to form one captivating campaign. The Central Perk coffee shop served as the heart of all things F.R.I.E.N.D.S. To commemorate the occasion we crafted a limited edition bag coffee product ‘Eight O’Clock Central Perk’ coffee. The fully functioning pop-up Central Perk coffee bar located at 199 Lafayette Street in Manhattan’s SoHo neighbourhood opened its doors to the public in September 2014. Fans of the long-running hit series could check out signature props from the show in the decorated storefront, relax on Central Perk’s iconic orange couch, order coffee off the famous Central Perk chalkboard or win prizes through fun and exciting in-store promotions. F.R.I.E.N.D.S. - themed merchandise and EOC Coffee’s Central Perk roast and other bagged varieties were also available for purchase in-store at Central Perk. A F.R.I.E.N.D.S. mecca was born and 60,000 fans lined up to enjoy an immersive experience. Fans waiting to get into Central Perk weren’t just local New
CORPORATE OVERVIEW 01-48
STATUTORY REPORTS 49-124
FINANCIAL STATEMENTS 125-220
Yorkers - just as F.R.I.E.N.D.S.’ popularity crossed international borders, so did the fans stopping by the pop-up – they were from diverse and faraway locales such as Australia, Brazil, China, Israel, UK and more. Special guests like Gunther, America’s best known barista from the show, and F.R.I.E.N.D.S.’ theme song artist The Rembrandts ed in the celebrations.
60,000 FANS
A F.R.I.E.N.D.S. mecca was born and 60,000 fans lined up to enjoy an immersive experience
39
Annual Report 2015-16
•
Connect with every sip
Celebrating success
This 360 degree integrated marketing promotion was a breakthrough. The Central Perk pop-up brought EOC unprecedented publicity - on the air and all over the press. Overall, there were 1.6 billion earned media impressions. And that wasn’t all! Some fun facts on this successful consumer promotion: • There were close to 2,000 consumers at Central Perk’s opening day. • Consumers waited in line up to 3 hours to enter the Central Perk shop. • Over 11,500 cups of EOC Coffee were handed out on September 29th, 2014, National Coffee Day. Visitors to Central Perk enjoyed varieties of the brand including the limitededition Central Perk Roast, Caramel Macchiato, Dark Italian Espresso and The Original Decaf. • Plus, 27,189 photos were taken on the iconic orange couch. The retail element of the programme demonstrated a contemporary brand image which appealed to a younger demographic. During the 12-week promotional period EOC achieved the following: • EOC’s Bag Coffee grew 21% versus the previous period.
What was our success mantra?
• EOC’s share of the bag category increased +0.9 points versus the prior period. • EOC’s household penetration increased by +12% which represents over 1 million new households. (Source: Nielsen)
The partnership met our dual goals - it helped engage with the younger consumer group and drive sales. In this age of viral videos and trending hash tags, an on-ground event and promotion with a strong cultural resonance drew in the right consumers.
“Engaging with the consumer today is all about creating meaningful experiences. Brands are increasingly built by the takeaway experience of the brand. To turn consumers into advocates, marketers need to produce experiences that create an emotional resonance with consumers, ultimately creating brand loyalty. The objective of the campaign was to create something exciting for our consumers, a promotion with a strong cultural and emotional tone,” says Mr. David Allen, Senior VP, Sales and Marketing, EOC. “The promotion was based on the insight
40
Media and industry peers recognised this as a brilliant promotion and the campaign bagged multiple US Industry Awards: • GOLD Reggie award in the Partnership category. • BRONZE Reggie award in the Sponsorship and Licensed Property category. • BRONZE Pro Award in the category of Best Entertainment Sponsorship or Tie in.
that coffee is a catalyst for connections with F.R.I.E.N.D.S. The t campaign was a true blockbuster, drawing thousands of devoted F.R.I.E.N.D.S. fans and coffee lovers. The overall promotion sured expectations, delivering a 21% bump in bagged ground coffee sales. The mantra here is clear – create brand experiences that are relevant for your consumer, and they will reward you with their loyalty.”
CORPORATE OVERVIEW 01-48
STATUTORY REPORTS 49-124
FINANCIAL STATEMENTS 125-220
Hello Mr. Barista! Talk of coffee and everyone has an opinion on it - from the right way to brew it to the flavours that need to go in. There is so much you can do with coffee and who better than a Barista to share the secret of a perfect brew? TGB’s MAP coffee business in Australia introduced the Mr. Barista brand in the coffee pods segment. This brand was created exclusively for Coles - Australia’s second largest grocery retailer. We partnered with Coles to their growing share within the second biggest capsule coffee system – Caffitaly. The objective was to create a coffee pod brand that would appeal to the mass market. MAP did this by creating the lovable character of Mr. Barista.
He celebrates the coffee maker by making the consumer a connoisseur who can enjoy café quality coffee at home with the Mr. Barista brand. Adding the brand to the existing MAP coffee family has added over 57% incremental capsule sales to our portfolio in Coles. Since launching Mr. Barista, sales in Coles have taken TGB’s share of the total capsules market from 9.7% to 11.9% in a capsule segment that is growing at 20%. (Source: Aztec Grocery Scan Data, June 2016)
57% Adding the brand to the existing MAP coffee family has added over 57% incremental capsule sales to our portfolio in Coles
Creating a strong brand which delights the consumer starts with a great name and a memorable pack design. Extensive brainstorming resulted in the name and visual for Mr. Barista being chosen. The brand personality was that of an everyday guy who loves a chat, is friendly and approachable and happy-go-lucky. He is the perfect guide to the perfect blend for you.
Mild Let me take you on a smooth, subtly sweet flavour journey. Made only from quality South American and Ethiopian Arabica beans, Mild Mr. Barista offers a fruity-citrus profile with an intense but smooth taste with hints of almond and hazelnut cream. Ideal as an espresso or café latte, this lightly roasted blend is delicious, perfect for a little pick-me-up.
Strong Let me introduce you to my strong and rich coffee. This superb blend is full in body thanks to its perfectly blended Arabica and Robusta beans offering hints of cocoa and cereal along with a delicious crema. Excellent as a milk-based beverage or as a strong espresso, this is one of Mr. Barista’s favourite blends as its smooth-richness is delicious. You’ll never need another coffee!
Super Strong Let me show you an intense coffee! Full in body offering hints of cocoa, dark chocolate, mild wood, this blend is crafted using quality Arabica and Robusta beans to create an extra strong profile for that punchy pick-me-up. Excellent as a milk-based beverage or as a robust espresso, this powerful dark roast is for the true coffee lovers, not for the faint-hearted.
41
Annual Report 2015-16
•
Connect with every sip
Consumer Relationship Service Our vision at TGB is ‘To be the most ired natural beverages company in the world by making a big and lasting difference in Tea, Coffee and Water.’ To ensure that we move closer to this goal each day we need to listen to our consumers. We need an in-depth understanding on how they view us, what they think of our practices and our products in order to be able to effectively cater to their needs and expectations. At TGB we value consumer centricity, and the Consumer Relationship Service (CRS) is one way to make sure we understand the pulse of our consumers.
The CRS team is the touchpoint for the consumer to share their views and queries about TGB’s products. The teams use the CRS tool to facilitate the collation, escalation and response cycle of the received. It has been designed
to manage consumer s across the business globally and we make effective use of this information in marketing and business activities. The downstream flow of consumer has been depicted below:
Consumer Telephone, Email, Website, Letter
+ve (Praise)
CRS Tool can be configured to show ‘matches’ for particular issues or products to alert the respective teams on emerging issues. Data is logged / categorised in the CRS Tool by the TGB Team
& Queries
Taste
Via Email
-ve (Complaint) Commercial
Operations Commercial Team
Product Data collected is looked into by the Complaint Investigating Teams
42
Via dashboard displays
Marketing Team
CORPORATE OVERVIEW 01-48
Consumer response volumes, country wise, annual figures: Country
Australia Canada Czech Republic India Russia UK USA Total
Consumer Response Volumes (Annual) 41,200* 3,000 60 600 424 60 15,000 10,800* 71,144
*These volumes are projected figures based on current reporting and soon to be reported through CRS.
Objective of CRS
With the deployment of CRS, the aim is to convert each direct with our consumers into an opportunity, with perfect execution of the management process and related actions in order to: • Ensure consumers receive answers that demonstrate our commitment to their satisfaction.
This flow represents the life cycle of consumer input that finds its way to the CRS team. Behind the scenes each month a Centralised Global Reporting process takes place across locations where the CRS tool is currently in
STATUTORY REPORTS 49-124
FINANCIAL STATEMENTS 125-220
• Reassure that actions are being taken to avoid problems and improve product quality. • Improve brand image.
• Allows consumer-facing teams in different regions to interact with each other to on consumer s, solve queries and share best practices.
Benefits of the CRS tool
In the pipeline
• Allows for easy management of data. • Reduces complexity e.g. many systems to one. • Improves process management with all the actions being monitored by a central team. • References single repository for all s (consumer, internal). • s the business excellence aims of process management and business results. • Breaks down information barriers to improve data visibility. • Reduces scope for istrative and human errors due to data visibility. • Generates real-time reports quickly. • Creates all correspondence to consumers, printed and electronic, through pre-planned templates for consistency and efficiency.
• A Global Consumer Service Report will reflect sales data from the SAP system to be integrated with the CRS tool. This enhancement will cater to the global reporting requirements with figures for the number of s versus total products sold in each market being readily available. • Automated Data Protection to be incorporated in compliance with regional legislation. • Integration with forms on websites across locations. • Functionality which enables consumers to the CRS team through social media. The CRS tool is the ideal culmination of TGB’s promise to every consumer – Develop, Deliver, Delight.
use. These include UK, , Russia, Czech Republic, Canada, India, USA and Australia. As part of this process, a Global Consumer Service Report is produced to give visibility to complaints in commercial, manufacturing and
taste categories segregated on the basis of region, market and complaint categories. This report forms the basis for identifying and taking action on complaints in order to protect TGB’s brands and improve consumer service.
Response to a query and acknowledgement of received is communicated to the consumer
Consumer
Agrees to opt in
CRS Team in TGB Consumer is added to a database and related data can be extracted for marketing purposes 43
Annual Report 2015-16
•
Connect with every sip
Board of Directors
Cyrus P. Mistry
Mr. V. Leeladhar
CHAIRMAN
INDEPENDENT DIRECTOR
INDEPENDENT DIRECTOR
Mr. Cyrus P. Mistry is the sixth Chairman of Tata Sons Limited. He was appointed as Chairman of the Board of Tata Global Beverages Limited in December 2012. Mr. Mistry was earlier Managing Director of the Shapoorji Pallonji Group. He graduated with a degree in Civil Engineering from Imperial College, UK in 1990. In 1997, he received an M.Sc. in Management from the London Business School. He is a recipient of the ‘Alumni Achievement Award’ from the London Business School. He is a Fellow of the Institution of Civil Engineers, London. He is a Member of the Presidential CEO Advisory Board of the Massachusetts Institute of Technology. Mr. Mistry serves as the co-Chair of the India-US CEO Forum as well as India-UK CEO Forum.
Mr. V. Leeladhar has long experience in the banking industry having served as the Executive Director of the Bank of Maharashtra, Chairman and Managing Director of Vijaya Bank and Chairman and Managing Director of Union Bank of India. He also served as the Deputy Governor of the Reserve Bank of India for over four years. Mr. Leeladhar is an expert on banking and in financial matters. He was also a member of the Securities & Exchange Board of India for about three years. His expertise is in the area of banking and finance. He is also on the Board of Tata Cleantech Capital Limited and Axis Mutual Fund Trustee Limited.
Mrs. Mallika Srinivasan is the Chairman & Chief Executive Officer of Tractors and Farm Equipment Limited, a flagship company of the Amalgamations Group. A thought leader and strategist, recognised for her commitment to excellence and contribution to Indian Industry, she has been at the helm of affairs of industry bodies and trade associations such as Tractor Manufacturers Association, Madras Management Association, Madras Chamber of Commerce & Industry and the Southern Regional Council of CII. She is the Director of five other Indian companies. She is a recipient of several business awards and has been recognised by Business Today for 7 consecutive years as one of the 25 most powerful women in Indian business. She was awarded the Pa Shri for her contributions to trade and Industry by the President of India in 2014.
Mr. S. Santhanakrishnan
Mrs. Ireena Vittal
Mr. Harish Bhat
DIRECTOR
INDEPENDENT DIRECTOR
DIRECTOR
Mr. S. Santhanakrishnan, FCA is a partner of PKF Sridhar & Santhanam, Chartered ants. He has more than 30 years of experience in Finance, s including IFRS, Strategy & Planning, Global Assurance, Corporate Laws and Consulting. He was a member of the Central Council of the Institute of Chartered ants of India (ICAI). He is actively involved in numerous industry oriented initiatives of the Reserve Bank of India and the Ministry of Corporate Affairs. He is on the Board of other Tata companies and IDBI Federal Life Insurance Co. Ltd., ICICI Home Finance Co. Ltd. and is the Non-Executive Chairman of Catholic Syrian Bank Limited.
Mrs. Ireena Vittal, a former partner with McKinsey & Co., is a recognised thought partner to consumer-facing companies looking to build large-scale, profitable businesses in emerging markets. Ms. Vittal was a founding member of the economic-development practice and the global emerging-markets practice at McKinsey & Co. She is an Independent Director on the board of select Indian companies such as Titan Company, Indian Hotels, Godrej Consumer, Tata Industries, Wipro, and on the global advisory board of IDEO.org, a non-profit organisation dedicated to applying human-centered design to alleviate poverty. She graduated in electronics and has an MBA Degree from the Indian Institute of Management, Calcutta.
Mr. Harish Bhat holds a Post Graduate Diploma in Management (PGDM) from IIM, Ahmedabad. He ed the Tata Group as a TAS probationer in 1987 and has completed 29 years of service with the Group. Mr. Harish Bhat was the CEO and Managing Director of Tata Global Beverages Limited from 1st July 2012 to 31st March 2014. He continues to serve on the Board of TGB as a Non-Executive Director from 1st April 2014. He was also previously with Tata Tea Limited from 1988 to 2000 holding various positions in the Company. He is on the Board of Directors of many Tata Group Companies including Tata Coffee Limited, Tata Starbucks Private Limited, Infiniti Retail Limited, Titan Company Limited, Tata Unistore Limited and Trent Limited.
44
Mrs. Mallika Srinivasan
CORPORATE OVERVIEW 01-48
STATUTORY REPORTS 49-124
FINANCIAL STATEMENTS 125-220
Mr. Analjit Singh
Mrs. Ranjana Kumar
INDEPENDENT DIRECTOR
INDEPENDENT DIRECTOR
INDEPENDENT DIRECTOR
Mr. Analjit Singh is the Founder & Chairman Emeritus of The Max Group. He is the nonexecutive Chairman of Vodafone India and a Director on the boards of TGB, Sofina NV/SA, Belgium and advisor to some leading international companies. Mr. Analjit Singh has been honoured with Pa Bhushan, India’s third highest civilian award by the President of India. He has been honoured with the Ernst and Young Entrepreneur of the Year Award (Service Category) and the Golden Peacock Award for Leadership and Service Excellence. He also serves as the Honorary Consul General of the Republic of San Marino in India.
Mrs. Ranjana Kumar retired as Vigilance Commissioner in Central Vigilance Commission, Government of India. She was also a Member, Governing Council, National Innovation Foundation, Ahmedabad. She had held very significant positions in her career including that as the Chairperson & Managing Director of Indian Bank, Chairperson of National Bank for Agriculture and Rural Development (NABARD), Executive Director, holding concurrent charge as Chairman and Managing Director of Canara Bank and CEO of the US operations of the Bank of India based in New York. She has also been appointed as Chairperson of the Advisory Board on Bank Commercial and Financial Frauds.
Mr. Darius Pandole holds a BA (Economics) Degree from Harvard and an MBA from the University of Chicago. He is a Partner and Executive Director at New Silk Route Advisors Pvt. Ltd., a private equity advisory firm focused on investing in India and other Asian economies. Mr. Pandole had earlier worked with Kraft General Foods in the US and returned to India in 1993. He served as Managing Director of IndAsia Fund Advisors Private Limited, the Indian advisor to the AMP-IndAsia India Fund – a private equity fund established in partnership with AMP of Australia. He ed IDFC PE Ltd. in February 2003, and was the Executive Director, and later Chief Operating Officer. He is on the Board of several companies including Tata Global Beverages Group UK and NourishCo Beverages Limited.
Mr. Ajoy Misra
Mr. L. KrishnaKumar
MANAGING DIRECTOR & CEO
EXECUTIVE DIRECTOR & GROUP CHIEF FINANCIAL OFFICER
Mr. Ajoy Misra is the Managing Director and CEO of the Company with effect from 1st April 2014. In a career spanning 35 years, 30 of which were with the Taj Group of Hotels, Ajoy Misra has led various departments of Taj Hotels from Sales and Marketing to Operations. He was the General Manager of Taj President Hotel in Mumbai and was the Area Director for Sri Lanka and Maldives and General Manager of the Taj Samudra Hotel in Colombo. He has a Bachelors Degree in Civil Engineering from BITS, Pilani and a MBA from the Faculty of Management Studies, Delhi University. He has also done the Advanced Management Program (AMP-174) at Harvard Business School, Boston.
Mr. Darius Pandole
Mr. L. KrishnaKumar graduated from Loyola Collage in Madras and subsequently obtained professional qualifications in Chartered ancy, Cost ancy and Company Secretarial. He is the Executive Director and Group Chief Financial Officer of Tata Global Beverages Limited. He supervises the Finance, Governance and IT functions. He also oversees the Global Buying and Blending and Supply Chain functions. He is also a director on the board of NourishCo Beverages Limited and several of the Company’s overseas subsidiaries. He ed the Tata Group in 2000 in the hotels business as its Vice President, Finance. He took over the head of finance function of Tata Tea in India in the year 2004 and has been part of its growth story since then.
45
Annual Report 2015-16
•
Connect with every sip
Executive Office
Mr. Ajoy Misra
Mr. L. KrishnaKumar
MANAGING DIRECTOR & CEO
EXECUTIVE DIRECTOR & GROUP CHIEF FINANCIAL OFFICER
Mr. Misra has been with Tata Group for over 30 years. Before becoming a part of Tata Global Beverages Limited, he held with distinction several leadership roles at the Taj Group of Hotels, including that of Head of Global Marketing & Sales, Area Director in the Sri Lanka and Maldives regions, and General Manager of various regions and properties of Taj. Mr. Misra is a Civil Engineering graduate from BITS Pilani and holds an MBA from the Faculty of Management Studies, Delhi University. He has also completed the Advanced Management Program from Harvard Business School.
Mr. L. KrishnaKumar ed Tata Group in 2000 as Vice President, Finance, in the Hotels business, and was then promoted as Head of Finance of Tata Tea in India in 2004. He is currently the Executive Director & Group Chief Financial Officer, and supervises the finance, governance and IT functions. He has worked with Larsen and Toubro Limited (L&T), a diversified conglomerate company, in a variety of areas. His last role with L&T, before ing Tata Group, was as General Manager, Finance, in their corporate office.
Mr. K. S. Srinivasan
Mr. Adil Ahmad
GLOBAL CHIEF HUMAN RESOURCES OFFICER
GLOBAL CHIEF MARKETING OFFICER
Mr. K. S. Srinivasan ed Tata Global Beverages Limited as Chief Human Resources Officer in 2013, and has been with the Tata Group for 24 years. He has more than 30 years of global experience in the human resources function. Prior to ing TGB, Mr. Srinivasan headed the Human Resources function, including Learning & Development, for the Americas and Europe for the Taj Group of Hotels based out of New York. His core expertise is in the areas of managing and integrating organisation culture, performance management, organisational change initiatives, reward and compensation management, industrial relations, and employee engagement.
Mr. Adil Ahmad ed Tata Global Beverages in 2015 as Chief Marketing Officer. In this role, Adil aligns our efforts and drives synergies across geographies and markets to develop a strong portfolio of global brands. As brand custodian, he focuses on overall health, profitability and isation of brands across various markets. He is also responsible for innovation and developing new growth opportunities for the global brands and businesses across regions and markets focusing on Tea, Coffee and enhanced Water. Prior to this, Adil has had a twenty year career with Reckitt Benckiser, holding leadership positions across UK, India, Mideast and East Asia, in both strategic and operational roles. Adil graduated from St. Stephen’s College, Delhi and holds an MBA from Case Western University, Cleveland, Ohio, USA.
Mr. Sushant Dash REGIONAL PRESIDENT, INDIA
Mr. Dash ed Tata Global Beverages in 2000, and has successfully handled various strategic and operational roles for the organisation. Some of his previous roles include Marketing Head for India, Team Leader of a Venture Team based in UK, and Senior Director – Marketing and Business Development – for Tata Starbucks. In his most recent role, he was the Global Brand Director of TGB. Prior to ing the Company, he worked at ORG Marg in various capacities in Consumer and Market Research. Mr. Dash holds a post graduate degree from Mudra Institute of Communication, Ahmedabad (MICA) and is a graduate in Economics from Ravenshaw University, Cuttack.
46
CORPORATE OVERVIEW 01-48
Mr. Stephen Rice
STATUTORY REPORTS 49-124
FINANCIAL STATEMENTS 125-220
Mr. Vikram Grover
REGIONAL PRESIDENT, CANADA, AMERICA AND AUSTRALIA (CAA)
PRESIDENT, WATER VERTICAL
Mr. Stephen Rice is the Regional President for the Canada, America and Australia (CAA) region of Tetley. Prior to ing Tetley, he worked for Coca-Cola, first as Financial Analyst and then as Product Manager. He then ed Cadbury Beverages, Canada, as Product Manager, moving up as Business Manager for a number of brands within Cadbury, including allied brands - Welch’s and Motts - and was then appointed as District Sales Manager. He ed Tetley in 1999 as Marketing Manager and grew to become Vice President, Marketing, in 2004. He became Regional President for the CAA region in 2010. Mr. Rice holds an Honours BComm degree, majoring in Marketing.
Mr. Vikram Grover is Head of Tata Global Beverages’ water business, responsible for product and market development of functional waters and building a global footprint for the water business. He is based in Mumbai, India and also has overall responsibility for the Company’s tea business in Bangladesh. Vikram ed TGB as Marketing Head for South Asia in 2010, and has played a key role in achieving several milestones for the Company’s branded tea business in India. Prior to ing TGB, he worked with Unilever holding significant roles such as Global Strategy and Archetypes Director for Beverages and Country Head for Beverages in India. Vikram has an MBA in Marketing from the Indian Institute of Management, Kolkata, and is an engineering graduate from the Punjab Engineering College, Chandigarh.
Mr. Sanjiv Sarin
Mr. Nigel Holland
MANAGING DIRECTOR & CEO, TATA COFFEE LIMITED
REGIONAL PRESIDENT, EUROPE, MIDDLE EAST AND AFRICA (EMEA)
Mr. Sanjiv Sarin is Chief Executive Officer and Managing Director of Tata Coffee Limited. Mr. Sarin has held the position of Regional President, South Asia, of TGB since 2010. During his tenure, he has significantly strengthened TGB’s position in the Indian branded tea market. Mr. Sarin has over 38 years of experience in a variety of significant roles. Prior to his stint at TGB, he held the position of Executive Director – Business Development, at Tata Coffee Limited. He has global experience with leading international organisations, including 16 years at Cadbury Schweppes in the Philippines, Egypt, India and the UK, his last assignment being Country Director of Cadbury Philippines. Mr. Sarin graduated from Asian Institute of Management, Manila, Philippines, with a distinction, and has a Masters in Economics from Bombay University, where he graduated with a gold medal.
Mr. Nigel Holland ed the Management team in 2011 and is responsible for the regions of Europe, the Middle East and Africa (EMEA). He is also the Executive Director and Chairman of Joekels Tea Packers Limited, South Africa, as well as the President of the UK Tea & Infusions Association (UKTIA). With a degree and MBA in Economics, Mr. Holland ed the Tetley Group in 1998 as Marketing Controller, having previously worked in various consumer marketing positions for a number of leading FMCG brands, including Scottish & Newcastle Breweries, Kraft Jacobs Suchard, and Boots Healthcare International. A year later, he became the Marketing Director. In 2002, he was appointed as the Commercial Director for the UK business, which later extended to the regions of Western Europe and Australia. In 2008, with the formation of Tata Global Beverages Limited, Mr. Holland was appointed as Regional President for UK and Africa, which was subsequently expanded to cover the Europe-Middle East-Africa region.
47
Annual Report 2015-16
•
Connect with every sip
10-Year Financial Highlights Rs. in cr 2015-16 # 2014-15 # 2013-14 # 2012-13 # 2011-12 # 2010-11 # 2009-10 2008-09 2007-08
2006-07
3190
3040
2868
2439
2129
1924
1837
1525
1263
1146
EBITDA
342
317
284
239
232
147
191
153
176
198
Operating Profits
319
297
268
222
220
135
179
142
166
179
Profit before Tax
661
349
585
321
370
230
495
229
386
350
Total Revenue
97
60
139
62
67
50
104
70
73
43
Profit after Tax
564
289
447
259
303
181
391
159
313
307
Dividend payout @
164
162
147
154
154
142
143
125
253
109
63
62
62
62
62
62
62
62
62
59
-
1
-
-
-
-
-
-
-
22
Reserves & Surplus
2833
2439
2511
2256
2148
1995
2016
1737
1742
1485
Shareholders' Funds
2896
2502
2573
2318
2210
2056
2078
1799
1804
1566
Tax
Equity Capital Share Warrants / Share Suspense
378
477
457
509
367
505
500
755
758
797
3274
2979
3030
2827
2577
2561
2578
2554
2562
2363
Net Block
209
205
162
150
143
126
111
104
98
247
Contribution to Exchequer
172
118
141
96
87
72
120
80
83
54
Payments relating to Employees
187
162
136
120
101
95
95
92
72
179
No. of Employees
2552
2549
2466
2489
2218
2373
2419
2422
2510
34506
Book value per Share (Rs.)*
45.54 +
39.29 +
41.26 +
37.13 +
35.39 +
32.90 +
332.47
287.43
288.19
261.51
Earnings per Share (Rs.)
8.93 +
4.58 +
7.23 +
4.18 +
4.89 +
2.92 +
63.30
25.72
50.79 **
53.56
Dividend per Share (Rs.)
2.25 +
2.25 +
2.25 +
2.15 +
2.15 +
2.00 +
20.00
17.50
35.00 &
15.00
Total Debt to Equity*
0.13
0.19
0.18
0.22
0.17
0.25
0.24
0.42
0.43
0.52
8181
8063
7819
7437
6735
6100
5855
4907
4376
4103
EBITDA
675
775
752
768
623
608
722
646
709
704
Operating Profits
532
642
623
663
527
509
619
547
617
608
Profit before Tax
545
500
707
637
574
494
641
1256
2059
566
Net Profit
326
248
481
373
356
254
390
701
1,543
443 359.96
Borrowings ^ Capital Employed
CONSOLIDATED FINANCIAL HIGHLIGHTS Total Revenue
89.96 +
86.38 +
93.90 +
77.08 +
73.15 +
63.37 +
596.35
580.94
557.34
Basic Earnings per Share (Rs.)
5.16 +
3.93 +
7.77 +
6.03 +
5.76 +
4.11 +
63.11
113.28
250.41 **
Total Debt to Equity *
0.18
0.21
0.21
0.25
0.16
0.21
0.38
0.53
Book value per Share (Rs.)*
# Figures as per Schedule III. @ Includes Tax On Dividend. ^ Includes current maturities of long term debts. * Computation excludes Revaluation Reserves. + Computation based on revised face value of shares. ** On the average Share capital for the year/period. & Includes one time special dividend of Rs. 20 per share.
48
0.59
77.46 ** 1.67
Corporate Overview 01-48
Statutory Reports 49-124
Financial Statements 125-220
Notice
Special Business 5.
Remuneration of Cost Auditors
Notice is hereby given that the Fifty Third Annual General Meeting of the of Tata Global Beverages Limited will be held at The Oberoi Grand, 15 Jawaharlal Nehru Road, Kolkata – 700 013 on Wednesday, 24th August 2016 at 10.30 a.m. to transact the following businesses:
To consider and if thought fit, to with or without modification(s), the following resolution as an Ordinary Resolution:
“RESOLVED THAT pursuant to the provisions of Section 148 and other applicable provisions, if any, of the Companies Act, 2013, read with the Companies (Audit and Auditors) Rules, 2014 (including any statutory modification(s) or re-enactment(s) thereof, for the time being in force), Shome & Banarjee, Cost ants, (Firm Registration Number 000001), appointed by the Board of Directors of the Company to conduct the audit of the cost records of the Company, for the financial year ending March 31, 2017, be paid a remuneration of Rs. 3,25,000 plus service tax as applicable and reimbursement of out of pocket expenses incurred by them in connection with the aforesaid audit.
RESOLVED FURTHER THAT the Board of Directors of the Company be and is hereby authorised to do all acts and take all such steps as may be necessary, proper or expedient to give effect to this resolution.”
Ordinary Business 1.
To receive, consider and adopt:
(a)
the audited financial statements of the Company for the financial year ended March 31, 2016, together with the reports of the Board of Directors and Auditors thereon; and
(b)
the audited consolidated financial statements of the Company for the financial year ended March 31, 2016 together with the report of the Auditors thereon.
2.
To declare a dividend.
3.
To appoint a Director in place of Mr. Cyrus P Mistry (DIN 00010178), who retires by rotation and, being eligible, offers himself for reappointment.
6.
Issue of Non Convertible Debentures on private placement basis
4.
Ratification of Appointment of Auditors
To consider and if thought fit, to with or without modification(s), the following resolution as an Ordinary Resolution:
To consider and if thought fit, to with or without modification(s), the following resolution as a Special Resolution:
“RESOLVED THAT pursuant to the provisions of Sections 23, 42, 71 and other applicable provisions, if any, of the Companies Act, 2013 (“the Act”) read with the Companies (Prospectus and Allotment of Securities) Rules, 2014 and Companies (Share Capital and Debentures) Rules, 2014, including any statutory modification, amendment, substitution or re-enactment thereof, for the time being in force and pursuant to SEBI (Issue and Listing of Debt Securities) Regulations, 2008 and other applicable Regulations / Guidelines and subject to the relevant provisions of the Memorandum and Articles of Association of the Company, approval of the of the Company is hereby accorded to the Board of Directors of the Company, (hereinafter referred to as “the Board” which term shall be deemed to include any Committee of the Board) to issue / offer / invite for subscription / to allot
“RESOLVED that pursuant to the provisions of Section 139, 142 and other applicable provisions, if any, of the Companies Act, 2013, and the Rules framed thereunder, as amended from time to time, the Company hereby ratifies the appointment of Lovelock & Lewes (Firm Registration No. 301056E), as Auditors of the Company to hold office from the conclusion of this Annual General Meeting (AGM) till the conclusion of the fifty-fourth AGM of the Company to be held in the year 2017 at such remuneration plus service tax, out-of-pocket, travelling and living expenses, etc. for the financial year ending March 31, 2017, as may be mutually agreed between the Board of Directors of the Company and the Auditors.”
49
Annual Report 2015-16
Secured / Unsecured Redeemable Non-Convertible Debentures (“NCDs”) including but not limited to bonds and / or other debt securities (hereinafter collectively referred as “Securities”), on private placement basis, listed or unlisted, in one or more tranches, during the period of one year from the date of ing of this special resolution, to eligible person(s), upto a limit of Rs. 350 Crores (Rupees Three Hundred and Fifty Crores), within the overall borrowing limits of the Company as approved by the of the Company from time to time.
RESOLVED FURTHER THAT the Board is hereby authorised to determine the of the issue including providing security over any of the Company’s assets, the class of investors to whom such Securities are to be issued, timing of the issue, total amount to be raised by issuance of Securities, the number of Securities, tranches, issue price, tenor, interest rate, / discount, redemption , appointment of trustee(s), security, listing etc., and to do all such acts, deeds, filings, matters and execute all such deeds, documents, instruments and writings as may be required, with powers on behalf of the Company to settle all questions, difficulties or doubts that may arise in this regard, as the Board may, in its sole and absolute discretion deem fit and to delegate all or any of its powers herein conferred to any director(s) and / or officer(s) of the Company, as it may in its absolute discretion deem necessary.”
Notes: 1. The relative Explanatory Statement pursuant to Section 102 of the Companies Act, 2013 in respect of Item Nos. 4, 5 and 6 are annexed hereto. Information under Regulation 36 (3) of the Securities and Exchange Board of India (Listing Obligations and Disclosure Requirements) Regulations, 2015 relating to the Director proposed to be reappointed is provided in Annexure to this Notice. 2.
A member of the Company entitled to attend and vote at the Annual General Meeting (AGM) is entitled to appoint a proxy to attend and vote instead of himself/ herself and the proxy need not be a member of the Company. The instrument appointing the proxy, in order to be effective, must be deposited at the Company’s ed Office, duly completed and signed, not less than forty eight hours before the commencement of the AGM. Proxies submitted on behalf of limited companies, societies etc., must be ed by appropriate resolutions / authority, as applicable. A person can act as proxy on behalf
50
•
Connect with every sip
of not exceeding fifty (50) and holding in the aggregate not more than 10% of the total share capital of the Company. In case a proxy is proposed to be appointed by a Member holding more than 10% of the total share capital of the Company carrying voting rights, then such proxy shall not act as a proxy for any other person or shareholder. 3.
The of and Transfer Books of the Company will be closed from Wednesday, 10th August, 2016 to Wednesday, 24th August 2016, both days inclusive.
4.
, Proxies and Authorised Representatives are requested to bring to the meeting, the Attendance Slip enclosed herewith, duly completed and signed, mentioning therein details of their DP ID and Client ID / Folio Number.
5.
If the Final Dividend, as recommended by the Board of Directors, is approved at the AGM, payment of such dividend will be made on or after Friday, 26th August, 2016 as under:
i)
To all the beneficial owners in respect of shares held in dematerialised form as per the data as may be made available by the National Securities Depository Limited (NSDL) and the Central Depository Services (India) Limited (CDSL) as of the beginning of the business hours on Wednesday, 10th August 2016.
ii)
To all the in respect of shares held in physical form after giving effect to all valid transfers in respect of transfer requests lodged with the Company on or before the close of business hours on Tuesday, 9th August 2016.
6.
Shareholders holding shares in physical form are requested to advise any change of address, email address, bank details immediately to Company’s Registrar and Share Transfer Agents, TSR Darashaw Limited(TSRDL). Shareholders holding shares in electronic form must advise their respective depository participants about any change in address, email address and bank details and not to the Company or the Registrars.
The Securities and Exchange Board of India (“SEBI”) has mandated the submission of Permanent Number (PAN) by every participant in securities market. holding shares in electronic form are, therefore, requested
Corporate Overview 01-48
holding shares in physical form are requested to consider converting their holdings to dematerialised form to eliminate all risks associated with physical shares and for ease of portfolio management. can the Company or TSRDL for assistance in this regard.
8.
holding shares in physical form in identical order of names in more than one folio are requested to send to the Company or TSRDL, the details of such folios together with the share certificates and self attested copies of the PAN card of the holders for consolidating their holdings in one folio. A consolidated share certificate will be returned to such after making requisite changes thereon.
9.
Shareholders holding shares in electronic form are hereby informed that bank particulars ed against their respective depository s will be used by the Company for payment of dividend. For the safety and interest of the shareholders, it is important that bank details are correctly provided to the depository participants.
10.
In case of t holders attending the meeting, the member whose name appears as the first holder in the order of names as per of of the Company will be entitled to vote.
11.
12.
Shareholders are requested to immediately notify their bank particulars giving the name of the bank and the branch, 9 digit MICR number, 11 digit IFS Code, the nature of and their Core Banking Solutions number (CBS A/c No.) to the Company’s Registrar and Share Transfer Agent, TSR Darashaw Limited (TSRDL), in respect of shares held in physical form and to their Depository Participants in case of shares held in electronic form. As per the provisions of Section 72 of the Act, the facility for making nomination is available for the in respect of the shares held by them. who have not yet ed their nomination are requested to the same by submitting Form No. SH-13. The said form can be ed from the Company’s website www.tataglobalbeverages.com (under ‘Investors’ section).
Financial Statements 125-220
holding shares in physical form may submit the same to TSRDL. holding shares in electronic form may submit the same to their respective depository participants.
to submit the PAN to their depository participants with whom they are maintaining their demat s. holding shares in physical form can submit their PAN details to TSRDL. 7.
Statutory Reports 49-124
13.
Transfer of Unclaimed / Unpaid amounts to the Investor Education and Protection Fund (IEPF):
Pursuant to Sections 205A and 205C and other applicable provisions, if any, of the Companies Act, 1956, all unclaimed / unpaid dividend, application money, debenture interest and interest on deposits as well as the principal amount of debentures and deposits, as applicable, remaining unclaimed / unpaid for a period of 7 years from the date they became due for payment, have been transferred to the IEPF established by the Central Government. No claim shall be entertained against the IEPF or the Company for the amounts so transferred prior to 31st March, 2016. Shareholders who have not yet encashed their dividend warrant(s) pertaining to the dividend for the financial year 2008-09 and /or any subsequent years are requested to make their claims without any delay to the Registrars. It may be noted that the unclaimed dividend for the financial year 2008-09 declared by the Company on 1st September, 2009 can be claimed by the shareholders by 10th September, 2016. Attention of the shareholders is also drawn to the “Corporate Governance” section of the Annual Report in respect of unclaimed dividend.
14.
In accordance with the Companies Act, 2013 read with the relevant Rules, the Notice of the AGM along with the Annual Report for 2015-16 are sent by electronic mode to those whose e-mail addresses are ed with the Company / Depositories, unless any member has requested for a physical copy of the same. For who have not ed their e-mail addresses, physical copies are being sent by the permitted mode.
15.
We request shareholders to update their email address with their Depository Participants to enable the Company to send communications electronically.
16.
Shareholders may note that the bank details ed against their in physical form will not be applicable to their electronic and vice versa. The Company or its Registrars cannot act on any request received directly from the shareholders holding shares in electronic form for any change of bank particulars or bank mandate. Such changes are to be advised only to the depository participant of the shareholders. 51
Annual Report 2015-16
17.
18.
It is in interest of the shareholders to their bank details against their and avail of facility being extended by the Company of receiving the credit of dividend directly to their bank through electronic means. The facility is available at all bank branches that have ed themselves as participating banks with National Payment Corporation of India and have ed the Core Banking System. The shareholders may please note that under instructions from the Securities and Exchange Board of India, furnishing of bank particulars by the shareholders has become mandatory.
19.
Updation of Member’s Details:
The format of of prescribed by the Ministry of Corporate Affairs under the Companies Act, 2013 requires the Company/ Share Registrar & Transfer Agents to record additional details of the , including their PAN details, email address, Bank details for payment of dividend etc. A form capturing the additional details is appended at the end of this Annual Report. holdings shares in physical form are requested to submit the filled in form to the Company or its Share Registrars and Transfer Agents, M/s TSR Darashaw Limited, 6-10 Haji Moosa Patrawala Industrial Estate, 20 Dr. E. Moses Road, Mahalaxmi, Mumbai – 400 011. holding shares in electronic form are requested to submit the details to their respective Depository Participants.
20.
Voting through electronic means:
I.
52
In compliance with the provisions of Section 108 of the Companies Act, 2013 and the Rules framed thereunder, as amended from time to time and Regulation 44 of the Securities and Exchange Board of India (Listing Obligations and Disclosure Requirements) Regulations, 2015, the Company is pleased to provide holding shares either in physical form or in dematerialised form, the facility to exercise their right to vote electronically through the e-voting services provided by National Securities Depository Limited (NSDL) on all resolutions set forth in the Notice. In this regard, your Demat / Folio Number has been enrolled by the Company for your participation in e-voting on the resolutions placed by the Company on the e-Voting
•
Connect with every sip
system. Shareholders may exercise their right to vote through remote e-voting through e-voting services provided by NSDL or vote at the 53rd Annual General Meeting (AGM) by electronic means or poll paper. The instructions for e-voting are as under:
A.
In case a member receives an email from NSDL [for whose email Ids are ed with the Company/Depository Participants]:
i.
Open email and open PDF file viz, “TGBL e-Voting.pdf” with your Client ID or Folio No. as . The said PDF file contains your ID and /PIN for e-voting. Please note that the is an initial .
ii.
Launch internet browser by typing the following URL: https://www.evoting. nsdl.com/
iii.
Click on Shareholder –
iv.
If you are logging in for the first time, please enter the ID and provided in the PDF file attached with the e-mail as initial .
v.
The change menu will appear on your screen. Change to a new of your choice, making sure that it contains a minimum of 8 digits or characters or a combination of both. On first , the system will prompt you to change your and update your details like mobile number, email id etc. in the profile of the folio, which may be used for sending future communications. You will also need to enter a secret question and answer of your choice to retrieve your in case you forget it. Note the new . It is strongly recommended not to share your with any other person and take utmost care to keep your confidential.
Corporate Overview 01-48
vi.
You need to again with the new credentials. Home page of e-voting will open.
vii.
If you are already ed with NSDL for e-voting, then you can use your existing ID and and cast your vote.
viii.
Once the e-voting Home page opens, Click on e-Voting > Active Voting Cycles.
ix.
x.
xi.
xii.
xiii.
Select “EVEN” (E-Voting event number) of Tata Global Beverages Limited which is 104330. Now you are ready for e-voting as Cast Vote page opens. Cast your vote by selecting appropriate option “For” or “Against” and click on “Submit”. A confirmation box will be displayed. Click “OK” to confirm or “CANCEL” to modify. Once you confirm, you will not be allowed to modify your vote. Upon confirmation, the message “Vote cast successfully” will be displayed. You may similarly vote in respect of all other resolutions forming part of the Notice of the Annual General Meeting. During the voting period, can any number of times till they have voted on all the Resolutions. If you wish to log out after voting on a few resolutions and continue voting for the balance resolutions later, you may click on “RESET” for those resolutions for which you have not yet cast the vote. Institutional shareholders (i.e. other than individuals, HUF, NRI etc.) are required to send scanned copy (PDF/ JPG Format) of the relevant Board Resolution/Authority letter, etc. together with attested specimen signature of the duly authorised signatory(ies) who are authorised to
Statutory Reports 49-124
Financial Statements 125-220
vote, to the Scrutinizer through e-mail to [email protected].
B.
In case a member receives physical copy of the Notice of AGM [for whose email IDs are not ed with the Company/ Depository Participants or requesting physical copy]:
i.
Initial is provided in the enclosed attendance slip along with EVEN (E Voting Event Number), ID and /PIN
ii.
Please follow all steps from Sl. No. (ii) to Sl. No. (xi) in A. above, to cast vote.
C.
who are already ed with NSDL for e-voting can use their existing Id and for casting their votes.
II.
In case of any queries, you may refer the Frequently Asked Questions (FAQs) for Shareholders and e-voting manual for Shareholders available at the s section of www.evoting.nsdl.com.
III.
The e-voting period commences on Saturday 20th August 2016 at 9.00 am and ends on Tuesday 23rd August 2016 at 5.00 pm. During this period, shareholders of the Company, holding shares either in physical form or in dematerialised form, as on the cut-off date, namely 17th August 2016, may cast their vote electronically. The e-voting module shall be disabled by NSDL for voting thereafter. Once the vote on a resolution is cast by the shareholder, the shareholder shall not be allowed to change it subsequently or cast vote again.
IV.
The voting rights of shareholders shall be in proportion to their shares in the paid up equity share capital of the Company as on the cut-off date, which is 17th August 2016 . A person whose name is recorded in the of or in the of Beneficial Owners maintained by the Depositories as on the cut-off date only shall be entitled to avail the facility of remote e-voting as well as voting at the AGM.
53
Annual Report 2015-16
V.
The facility to vote at the AGM will be provided by any electronic means or Poll paper to the shareholders who will be attending the AGM and have not cast their vote through remote e-voting.
VI.
Dr. Asim Kumar Chattopadhyay, Practicing Company Secretary (hip No. FCS 2303 & No. 880) has been appointed as the Scrutinizer to scrutinize the remote e-voting process as well as voting through Poll at the AGM in a fair and transparent manner.
VII.
The Scrutinizer shall immediately after the conclusion of voting at the Annual General Meeting, will first count the votes cast at the Meeting and thereafter will unblock the votes cast through remote e-voting in the presence of at least two witnesses not in the employment of the Company.
VIII.
54
The Scrutinizer will collate the votes cast at the Meeting, votes ed from the e-voting system and make a Consolidated Scrutinizer’s Report of total votes cast in favour or against, if any, forthwith to the Chairman of the Company or a person authorised by him in writing who shall countersign the same. Any person, who acquires shares of the Company and becomes a member of the Company after dispatch of the Notice and holding shares as of the cut-off date, may obtain the id and by sending a request at [email protected]. However, if you are already ed with NSDL for remote e-voting then you can use your existing ID and for casting your vote. If you forget
Connect with every sip
your , you can reset your by using “forget details/” option available on www.evoting.nsdl.com.
•
IX.
The results declared along with the Scrutinizer’s Report shall be placed on the Company’s website www.tataglobalbeverages.com and on the website of NSDL www.evoting.nsdl.com immediately after the results are declared. The Company shall simultaneously forward the results to BSE Limited (“BSE”) National Stock Exchange of India Limited (“NSE”) and Calcutta Stock Exchange (“CSE”), where the shares of the Company are listed. The route map showing directions to reach the venue of the fifty third AGM is annexed. By Order of the Board
V. Madan Vice President & Company Secretary
ed Office: 1, Bishop Lefroy Road, Kolkata – 700 020 CIN - L15491WB1962PLC031425 E-mail id: [email protected] Website address: www.tataglobalbeverages.com Mumbai 24th May 2016
Corporate Overview 01-48
Statutory Reports 49-124
Financial Statements 125-220
Explanatory Statement Pursuant to Section 102 of the Companies Act, 2013 (“the Act”) As required by Section 102 of the Companies Act, 2013 (“the Act”), the following explanatory statement sets out all material facts relating to the businesses mentioned under Item Nos. 4, 5 and 6 Item No. 4 Ratification of Appointment of Auditors This explanatory statement is provided though strictly not required as per Section 102 of the Companies Act, 2013. Lovelock & Lewes (Firm Registration No. 301056E), Chartered ants, were appointed as the statutory auditors of the Company for a period of three years to hold office from the conclusion of the fifty first AGM till the conclusion of the fiftyfourth AGM of the Company to be held in the year 2017 (subject to ratification of their appointment at every AGM). In pursuance of the same, their ratification for appointment from the conclusion of the fifty third AGM till the conclusion of the fifty fourth AGM is being put up to the shareholders for their ratification. The Board commends the Ordinary Resolution at Item No. 4 for approval by the . None of the Directors / Key Managerial Personnel of the Company / their relatives are, in any way, concerned or interested, financially or otherwise, in the Ordinary Resolution set out at Item No. 4 of the Notice.
Item No. 5 Remuneration of Cost Auditors The Board, on the recommendation of the Audit Committee, has approved the appointment and remuneration of M/s Shome & Banarjee as the Cost Auditors to conduct the audit of the cost records of the Company, for the financial year ending March 31, 2017. In accordance with the provisions of Section 148 of the Companies Act, 2013 read with the Companies (Audit and Auditors) Rules, 2014, the remuneration payable to the Cost Auditors as recommended by the Audit Committee and approved by the Board of Directors, has to be ratified by the of the Company. Accordingly, consent of the is sought for ing an Ordinary Resolution as set out at Item No. 5 of the Notice for ratification of the remuneration payable to the Cost Auditors for the financial year ending March 31, 2017.
from time to time, a company offering or making an invitation to subscribe to Non Convertible Debentures (“NCD”) on a private placement basis, is required to obtain the prior approval of the Shareholders by way of a Special Resolution, which can be obtained once a year for all the offers and invitations for such NCDs during the year. The Company is considering to issue NCDs/other debt securities to augment the long term resources of the Company for its business as the current NCDs are falling due for repayment. The approval of the is being sought by way of a Special Resolution under Section 42 and other applicable provisions, if any, of the Act read with the Rules made there under, to enable the Company to offer or invite subscriptions for NCDs on a private placement basis, in one or more tranches, during the period of one year from the date of the special resolution, upto an amount not exceeding Rs. 350 Crores, within the overall borrowing limits of the Company, as approved by the from time to time, with authority to the Board to determine the and conditions, including the issue price, listing, redemption , security etc. of the NCDs / other debt securities. The proposed borrowings, along with the existing borrowings of the Company, would not exceed the aggregate outstanding borrowings of the Company approved by the , from time to time. The Directors commend the Special Resolution at Item No. 6 of the accompanying Notice for the approval of the of the Company. None of the Directors / Key Managerial Personnel of the Company / their relatives are, in any way, concerned or interested, financially or otherwise, in the Special Resolution set out at Item No. 6 of the Notice. By Order of the Board
The Board commends the Ordinary Resolution set out at Item No. 5 of the Notice for approval by the . None of the Directors / Key Managerial Personnel of the Company / their relatives are, in any way, concerned or interested, financially or otherwise, in the Ordinary Resolution set out at Item No. 5 of the Notice.
Item No. 6 Issue of Non Convertible Debentures on private placement basis As per the provisions of Section 42 of the Companies Act, 2013 (“Act”), including any statutory modifications or re-enactments thereof for the time being in force, read with the Companies (Prospectus and Allotment of Securities) Rules, 2014, as amended
V. Madan Vice President & Company Secretary ed Office: 1, Bishop Lefroy Road, Kolkata – 700 020 CIN - L15491WB1962PLC031425 E-mail id: [email protected] Website address: www.tataglobalbeverages.com Mumbai 24th May 2016 55
Annual Report 2015-16
•
Connect with every sip
Annexure to Notice Particulars of Director seeking reappointment Particulars
Mr. Cyrus P Mistry
Date of Birth
July 4, 1968
Date of Appointment
June 22, 2012
Qualifications
Graduate Degree in Civil Engineering, UK; M. Sc. In Management, London Business School
Expertise in specific functional areas
Wide business experience in variety of industries
Directorships held in other public companies (excluding foreign companies and companies ed under Section 25 of the Companies Act, 1956)
Tata Sons Limited#
Tata Industries Limited *
The Tata Power Company Limited *
Tata Teleservices Limited *
Tata Consultancy Services Limited*
Tata Steel Limited*
Tata Motors Limited*
Tata Chemicals Limited *
The Indian Hotels Company Limited*
hips/Chairmanships of Committees of other companies (includes only Audit Committee and Stakeholder Relationship Committee)
Nil
Number of shares held in the Company
33,000
Inter-se relationship with other Directors and Key Managerial Personnel
Nil
#Executive Chairman *Chairman of the Board For other details such as number of meetings of the board attended and amount of sitting fees drawn during 2015-16, in respect of Mr. Cyrus P. Mistry, please refer to the Corporate Governance Report.
56
Corporate Overview 01-48
Statutory Reports 49-124
Financial Statements 125-220
Route Map to the AGM Venue Venue: The Oberoi Grand, 15 Jawaharlal Nehru Road, Kolkata – 700 013
Land Mark: Near Esplanade Metro Station
57
Annual Report 2015-16
•
Connect with every sip
DIRECTORS’ REPORT TO THE Your Directors are pleased to submit their fifty third report together with the audited financial statements of the Company for the year ended 31st March 2016.
Financial Results
Rs. in Crores Consolidated
Standalone
2015-16
2014-15
2015-16
2014-15
8,111
7,993
3,084
2,885
675
775
342
317
(143)
(133)
(23)
(20)
532
642
319
297
71
70
107
155
Less : Finance Costs
(69)
(82)
(30)
(34)
Profit before exceptional items and taxes
534
630
396
418
11
(130)
265
(69)
Profit before tax
545
500
661
349
Provision for tax
(210)
(216)
(97)
(60)
Revenue from Operations Profit from Operations before Other Income, Finance Costs, Depreciation and Exceptional Items Less : Depreciation Profit from Operations before Other Income, Finance Costs and Exceptional Items Add: Other Income (Standalone results include intra-group dividends eliminated on consolidation)
Exceptional items (net)
335
284
564
289
Share of Net loss in Associates
(1)
(11)
-
-
Minority Interest
(8)
(25)
-
-
Profit after tax
326
248
564
289
3,331
3,276
920
820
Add: Adjustment on Amalgamation
-
20
-
2
Amount available for appropriation
3,657
3,544
1,484
1,111
Proposed dividend
(142)
(142)
(142)
(142)
Dividend distribution tax
(23)
(21)
(23)
(19)
Transfer to general reserve
(68)
(49)
(56)
(29)
Adjustment on evaluation of useful life of Fixed Asset
-
(1)
-
(1)
(233)
(213)
(221)
(191)
3,424
3,331
1,263
920
Profit for the year Add: Surplus brought forward from previous year
Retained in profit and loss statement
State of Company’s Affairs Consolidated Performance
non branded portfolio, improvements were mainly recorded in Coffee plantation and Coffee extraction businesses.
Consolidated Income from operations for 2015-16 was Rs. 8,111 Crores, against Rs. 7,993 Crores in the previous year, reflecting a 2% growth aided by improved performance both in the branded and unbranded businesses. At prior year exchange rates, the increase would be 3%. Within the branded business, India tea business performed well with good value and volume growth and our incubatory businesses, such as MAP in Australia, Tata Starbucks and NourishCo also increased their revenues. Within the
Profit from operations declined against the prior year mainly in the branded business due to underperformances in some developed markets. This decline is largely attributable to commodity price increases in coffee and tea in the international markets, higher spends behind brands and new launches, category decline in some developed markets and increased competitor and retailer activities. The Indian branded and non-branded businesses
58
Corporate Overview 01-48
performed well offsetting the lower performance in developed markets. Profit after tax was however significantly higher than prior year mainly due to the impact of exceptional items. During the year, your Company sold some non-core investments realising a profit of Rs. 328 Crores. The Company also recognised non cash impairment losses amounting to Rs. 270 Crores mainly relating to its businesses in Eastern Europe and US. While the Company is actively pursuing various growth opportunities, the ing impairment has been recognised due to underperformances as compared to plans mainly arising out of factors like macroeconomic instability in Russia and category decline in every day black tea in certain markets and higher competitive intensity in some markets. We continued our focus on green and specialty teas across markets during the year under review. There was renewed focus of increasing the distribution for our super segment whilst focus on new innovative products continued. The “Super Green tea” which is the first fortified green tea with proven health benefits which was launched in UK saw significant growth and was ahead of category growth on a full year basis. There was also significant growth in the green tea segment in India, and US. Fruit and herbal teas were launched in UK and US where customer response has been very positive. Teapigs, our super tea brand, saw significant growth in UK, US and Canada and other international markets with improved distribution. In India, our new coffee brand, Tata Coffee Grand had a high impact launch which created the desired buzz and visibility. In addition, Tata Tea Gold with a region specific blend was launched in the state of Maharashtra which received favourable customer response. Various new products like the Signature Collection and London Blend have been launched in select developed markets. The year also reflected good execution of the launch plans in Middle-East which resulted in market share increases. The performance of the businesses under our strategic partnership with Starbucks and PepsiCo also saw good growth. In Tata Starbucks, growth has been achieved as a result of good in-store performance and expansion in the number of stores. NourishCo reflected good growth based on significant increase in the sales of Tata Gluco Plus and a moderate growth in Himalayan sales. Your Company’s consolidated performance has to be viewed in the context of difficult macro economic conditions and the emerging category trends in some of the developed markets that the Company operates in and that investments are being made for future growth.
Statutory Reports 49-124
Financial Statements 125-220
Your Company’s focus in 2016-17 would be to invest in innovations and capability building in line with the Group’s medium term strategy plan and balancing the same with pressures on EBIT margins by prioritising our strategic objectives. The key focus themes across all regions will be to drive innovation and build momentum on the recent launches. Our focus will also be on improving distribution and driving cost efficiencies. We will meet these objectives through strengthening and leveraging people capabilities and robust execution of plans with continued commitment to our sustainability initiatives.
Standalone Performance Your Company’s Income from operations for the year ended 31st March 2016 was Rs. 3,084 Crores, ing an improvement against the prior year, driven by increase in volumes and average realisation reflecting the increase in both national and regional brands. Profit from operations at Rs. 319 Crores was higher than the previous year mainly driven by increased sales and lower commodity and input cost trends despite higher spends behind brands and new launches. Profit before and after tax was significantly higher aided by exceptional income, derived through sale of non-core investments partially offset by provisions relating mainly to the China extraction business arising out of delays in startup and stabilisation of technology for an enhanced product range. Your Company recorded 7% income growth over the prior year with increases in the flagship Tata Tea Brands and also in the Regional brands. Your Company is pleased to report that it continues to maintain both volume and value leadership in the overall branded tea category and leadership in the green tea category, in a challenging and competitive environment. During the year, your Company renewed its focus on green tea and launched innovative products. The Company launched Tata Tea Gold with a region specific blend to strengthen its foothold in Maharashtra for which consumer response has been positive. In addition, to expand the product category, your Company launched Tata Coffee Grand with a unique blend that is gaining consumer acceptance.
Share Capital The Amalgamation of Mount Everest Mineral Water Limited (MEMW) with the Company was completed during the year under review. Pursuant to and in consideration of the Scheme of Amalgamation of MEMW with your Company, which was effective 18th May 2015, your Company issued and allotted 1.27 Crore equity shares of Re. 1 to the eligible shareholders of MEMW, post which, the paid up capital of the Company increased to Rs. 63.11 Crores.
59
Annual Report 2015-16
Dividend Your Directors are pleased to recommend for the approval of the shareholders, a dividend of Rs. 2.25 per share on the equity share capital of the Company with respect to the financial year 2015-16. The total outgo on of dividend, inclusive of taxes, for 2015-16 is Rs. 165 Crores which represents a pay-out of 29% of the Company’s stand alone profits.
Transfer to Reserves An amount of Rs. 56 Crores is proposed to be transferred to General Reserves out of the amount available for appropriation and an amount of Rs. 1,263 Crores is proposed to be retained in the profit and loss statement.
Review of Subsidiaries, Associates and t Venture Companies Pursuant to Section 129(3) of the Companies Act, 2013, the consolidated financial statements of the Company and its subsidiaries, t ventures and associates, prepared in accordance with the relevant ing Standards specified under Section 133 of the Companies Act, 2013, read with Rule 7 of the Companies (s) Rules, 2014, form part of this Annual Report. Pursuant to the provisions of the said section, a statement containing the salient features of the financial statements of the Company’s subsidiaries, associates and t ventures in Form AOC-1 is given in this Annual Report. Further, pursuant to the provisions of Section 136 of the Companies Act, 2013, the financial statements of the Company, consolidated financial statements along with relevant documents and separate s in respect of subsidiaries are available on the website of the Company. There have been no material changes in the nature of the business of the subsidiaries (including associates and t ventures) during the financial year 2015-16. Acquisitions/ divestments, as applicable, have been adequately disclosed in the financial statements. Your Company has adopted a policy for determining material subsidiaries in of Regulation 16(1)(c ) of Securities and Exchange Board of India (Listing Obligations and Disclosure Requirements) Regulations, 2015 (Listing Regulations). The Policy as approved may be accessed on the Company’s website at the link: http://www.tataglobalbeverages.com/docs/default-source/ Investor-Governance-Policy-/policy-on-subsidiary.pdf?sfvrsn=0
60
•
Connect with every sip
Performance highlights of key operating subsidiaries / associates / t ventures Indian Operations Tata Coffee Limited Tata Coffee recorded a turnover of Rs. 718 Crores reflecting a growth of 5% over the prior year. The improvement is mainly attributable to higher instant coffee sales. The turnover of the plantation business also showed improvement driven by higher sales of Robusta and Pepper offset by lower Arabica volumes due to off year trends. The Instant Coffee business reported a strong growth in Africa and a favourable portfolio mix of volumes contributed to the Instant Coffee’s turnover and profitability. The overall profitability of the plantation business was flat impacted by seasonal nature of the business, soft tea prices and higher costs. The depreciation policy for Tata Coffee was changed to align to a single basis of depreciation for similar type of assets as opposed to different basis of depreciation being followed earlier. A write-back was taken to exceptional items to reflect the impact of the change. Post the impact of exceptional items, Profits before and after tax are at prior year levels. The Directors of Tata Coffee Limited have recommended a dividend of Rs.1.30 per equity share of Re. 1 each for the year 2015-16 which is the same as last year. The instant coffee operations continues to focus on operational discipline, cost reduction and sustainability in operations. With a specific focus on cost reduction, various alternatives have been used to reduce the power and fuel costs in the instant coffee factories. In addition, the Theni Unit won the CII Sustainability award and Toopran unit won the National level Energy conservation award. Tata Coffee also won two awards at the 12th Golden Leaf India Awards 2016 in recognition of the high quality teas produced at their factory located in the Anamalai hills in South India. Additionally, Plantation Trails, Tata Coffee’s hospitality brand, was awarded the ‘Certificate of Excellence’ from Trip Advisor, the world’s largest travel website, for the third consecutive year. The award is based purely on customer and ratings.
NourishCo Beverages Limited NourishCo Beverages Limited, a t venture with PepsiCo, is driving our water agenda in India. It distributes the Himalayan brand whilst it manufactures and sells the Tata Water Plus and Tata Gluco Plus brands. The Company ed a turnover of Rs. 125 Crores for 2015-16, reflecting a growth of 44%. Tata Gluco Plus has been performing extremely well and high double digit growth in volume and value were recorded during the year 2015-16.
Corporate Overview 01-48
The new proposition of “Gas minus Energy Plus” and the visual changes on the packaging to communicate “Energy” for the brand were received very well by the consumers and have accelerated the brand’s growth rate. We strengthened our distribution with presence in Maharashtra, Karnataka, Gujarat and Kerala. In addition, Himalayan sales declared a double digit growth in volume and value by focusing on channel mix and selective price increases. During the year, a television commercial was run with the objective of establishing Himalayan’s source credentials.
Tata Starbucks Private Limited Tata Starbucks recorded a turnover of Rs. 235 Crores during 2015-16 ing a growth of 39% over the prior year. Tata Starbucks’ store count stands at 82 at the end of the financial year. The business continues to perform well with revenue growth driven by improved store performance and increase in the number of stores. In-store performance has been robust helped by various initiatives such as localisation of supply chain and other similar initiatives contributing to improving profitability.
Amalgamated Plantations Private Limited (APPL) For the financial year 2015-16, turnover at Rs. 570 Crores was in line with prior year. However, profits were impacted mainly due to wage revisions which were negotiated on a tripartite basis. The business ed record production in February/ March 2016 due to good rains during end season. During the year, whilst regular tea prices were soft, teas reflected a hardening trend. In addition APPL is also involved with the tea extension planting advisory services initiative which ensures that the small tea growers are trained in Good Tea Cultivation practices to increase yield and improve compliance and quality of green leaf. This will help them get a fair price for sustainable livelihood and become a stable supply base to APPL factories. This initiative has led to identification and linkage of 5,252 small tea growers to APPL Estates for green leaf supply in 2016-17. Further, certain gardens achieved RA certifications and Trust Tea certification, in addition to ISO 22000 and SA 8000.
Kanan Devan Hills Plantation Company Private Limited (KDHP) For the financial year 2015-16, KDHP recorded a turnover of Rs. 259 Crores. The profitability and operations were impacted by labour unrest in its estates and factories for a week in September and for a fortnight in October, resulting in heavy loss of production. The unrest was across most plantations in Kerala due to demands for wage revision and higher bonus. Additionally, loss of production during this period of unrest and its aftermath, left the tea fields in overgrown condition necessitating substantial costs for ensuing restoration work on the affected fields, which
Statutory Reports 49-124
Financial Statements 125-220
further impacted both production and income. The Company also incurred substantial increase in costs due to a significant increase in labour wages as decided by the Plantation Labour Committee, constituted by the Government of Kerala, and this plantation industry wide wage revision, done once in three years, was due in 2015. Despite the labour unrest, the productivity for the season was higher than the previous year and total crop production performance was better than that of other companies in Munnar. The average price of tea achieved for the year was also higher than previous year, due to the increased production of high value teas and firming up of tea prices during the second half. In the Great Places to Work Survey (2015) conducted by the Economic Times and Great Place to Work® Institute, KDHP was ranked 97 in the Top 100 of India’s Best Companies to Work for in 2015. On the quality front, KDHP won two awards at the 2016 Golden Leaf India Awards competition held at Dubai, a testimony to the stringent quality standards adopted by the Company. Additionally, two tea factories were awarded the Appreciation Award under the Small Industry Category of the Kerala State Pollution Control Award, 2016. This is a testimony to the strict safety standards maintained by all KDHP establishments. On the certifications front, KDHP continues to maintain all certifications of international repute, including Rainforest Alliance, Fairtrade, Organic, ISO 22000, ETP, GMP and Trustea. It was a moment of great joy and pride when the Company ed the Rainforest Alliance annual audit, with an astounding score of 98.9%.
International Operations Eight O Clock Coffee Company (EOC) EOC’s total income, under IGAAP, during 2015-16 at Rs. 1,046 Crores was higher than the previous year’s income of Rs. 1,008 Crores. The increase in top line is mainly due to favourable currency movement. The business grew its non-promoted volumes over prior year but a significant increase in competitor intensity through additional promotional events and deeper discounting adversely affected the overall sales. Profits were impacted because of lower sales coupled with increase in coffee commodity costs. During the year, Eight O Clock Coffee was the recipient of two Reggie awards for their earlier partnership with Warner Brothers celebrating the 20th anniversary of the hit comedy TV show “Friends”. The award recognises the best marketing campaigns activated by brands with a focus on strategy, creativity, originality, integration and results. The campaign resulted in introducing the brand to a younger consumer base which ultimately contributed to brand sales growth. 61
Annual Report 2015-16
Tata Global Beverages Group Limited, UK The consolidated income from Tata Global Beverages Group Limited, UK, under IGAAP, which substantially reflects the financial performance of the Tetley business and other international brands, at Rs. 3,313 Crores, was lower than prior year mainly due to adverse translation impact. At constant exchange rates, there was a marginal underlying topline growth. The improvement in underlying sales is mainly due to improvements in the Teapigs brand, Russia, Middle East, South Africa, and coffee business in Australia partially offset by lower performance in other key markets. The operating profit was behind prior year mainly due to category de-growth and high competitive intensity in some major markets, higher commodity prices, impact of the macroeconomic condition prevailing in countries like Russia and higher spends on new launches and market entries. The underlying performance of the main brands was strong with many successes. Teapigs, our super brand has done exceedingly well by growing distribution in UK, US and in other international markets. Green tea has exceeded expectations and our growth is significantly higher than the category growth in UK. Super greens is the star performer in UK and the green tea portfolio, though small, has significantly increased in the last couple of years. In addition to UK, green tea has also done well in US, Canada and . During the year, fruit and herbal categories were launched in UK and US and the initial response is positive. A new variant, the Signature Collection which was launched in Canada is gaining distribution and a new blend – “British Brands” was launched in US. Various ment campaigns were deployed in markets to the Tetley brand and new launches. Whilst in the UK there was a focus on Tetley ment using the iconic “teafolk” and implementation of a new pack, Canada concentrated on Signature Collections and new packaging changes. We continue to be market leaders in Canada and have gained volume share in the UK. The Company is happy to inform you that for the second year running, Tetley has been recognised in the 2015 Great Taste Awards, winning coveted gold stars for its Kenyan Gold (Blend Collection), Pure Green, Redbush Vanilla, Super Green Tea, Boost, Lime and Serenity, and Mood Infusions. The Great Taste Awards is one of the world’s largest and most trusted food and drink awards, organised by the Guild of Fine Food. This respected seal of approval is a sign of quality, which consumers can trust whilst buying food and drink from their local retailer. Non Cash Goodwill impairments were recorded during the year under review mainly relating to its businesses in Eastern Europe and US. While the Company is actively pursuing various growth opportunities, the ing impairment has been recognised
62
•
Connect with every sip
due to underperformances as compared to plans mainly arising out of factors like macro-economic instability in Russia and category decline in every day black tea / competitive intensity in other markets.
Tata Tea Extractions Inc. Tata Tea Extractions Inc., a wholly owned subsidiary in the USA supplies customer specific tea ingredients to Iced Tea Beverage companies. During the year, the income from sales in underlying currency increased by 1%, while the Profit from Operations grew by over 5%, when compared to the previous year. This was mainly on of improved realisation from customers despite challenging market conditions, favourable blend mix and a marginal reduction in the cost of goods sold. In addition to the existing products, Tata Tea Extractions has developed a new formulation during the year to cater to the requirements of new customers as well as existing customers. The initial on this formulation from some of the customers have been favourable. In the manufacturing plant in Munnar, we are also working on an enhanced product range for one of our major customers. Developmental activities such as these, coupled with the existing product range is expected to help the company to sustain and grow the extraction business.
Zhejiang Tata Tea Extraction Company Limited- China t Venture operations Delays continue in stabilisation of the China business. While prospective customers have shown interest in our instant tea products, the final conversion to orders will be dependent on meeting the product profile requirements. Going forward, stabilising the production process and establishing a pipeline of external customers and successful scaling of technology will be key to the success of the project. In view of the continued uncertainty of the business, your Company is evaluating various options for restructuring the business.
Estate Management Services Private Limited (EMSPL) Estate Management Services Private Limited, Sri Lanka (EMSPL) in which your Company owns 31.85% of the shares, is the holding company of Watawala Plantations Limited (WPL). WPL is one of the largest producers of tea and palm oil in Sri Lanka and amongst the most efficiently run in that country. EMSPL also owns Watawala Tea Ceylon Limited (WTCL) which is in the branded business and owns three key brands ‘Zesta’, ‘Watawala’ and ‘Ran Kahata’ which together command 33% market share of the branded tea market in Sri Lanka. Sri Lankan tea has good acceptance in several countries including Russia, South East Asia, Australia and Middle East.
Corporate Overview 01-48
EMSPL has continued to perform well during 2015-16. Watawala Plantations PLC ed growth in profitability driven by better performance of tea and rubber segments. Watawala Tea Ceylon also recorded healthy growth in operating performance with both revenue and profitability substantially improving over the previous financial year.
Companies which have become or ceased to be Subsidiaries, Associates and t Ventures During 2015-16, RBC Hold Co LLC ceased to be a subsidiary as it was dissolved during the year. As stated above, Mount Everest Mineral Water Limited, an erstwhile subsidiary, was amalgamated with the Company, effective 18th May, 2015. No other company became or ceased to be a subsidiary, t venture or associate during 2015-16.
Human Resources and Industrial Relations During the year under review, a key agenda of the Company was to prioritise HR imperatives to the Company’s ambitious growth plans. The theme was ‘Raising the Bar’ and laying down practices on HR policies and principles to in accelerating business Growth. The Company further continued leveraging the 3 tier leadership program to build the leadership capabilities across regions. During the year under review, industrial relations remained harmonious at all our offices and establishments.
Corporate Governance and MD &A A detailed report on Corporate Governance is separately attached together with a report on Management Discussion and Analysis (MDA). The MDA also covers the consolidated operations and reflects the global nature of our business.
Vigil Mechanism / Whistle Blower Policy The Company has a vigil mechanism for directors and employees to report their concerns about unethical behaviour, actual or suspected fraud or violation of the code of conduct/business ethics that provides for adequate safeguards against victimisation of the director(s) and employee(s) who avail of the mechanism. No director/employee has been denied access to the Chairman of the Audit Committee.
Internal Financial Controls The Company has adequate system of Internal Controls which are detailed in the Management Discussion and Analysis Report.
Statutory Reports 49-124
Financial Statements 125-220
Governance Guidelines The Company has adopted a governance guidelines on Board effectiveness. The guidelines cover aspects relating to composition and role of the Board, Chairman and Directors, Board diversity, definition of independence, term of directors, retirement age and committees of the Board. The guidelines also cover aspects relating to nomination, appointment and induction and development of directors, directors remuneration, subsidiary oversight, code of conduct, Board effectiveness reviews and mandates of Board committees.
Procedure for Nomination and appointment of directors The Nomination and Remuneration Committee (NRC) is responsible for developing competency requirements for the Board based on the industry and strategy of the Company. The Board composition analysis reflects in-depth understanding of the Company, including its strategies, environment, operations, financial condition and compliance requirements. The NRC makes recommendations to the Board in regard to appointment of new directors. The NRC also conducts a gap analysis to refresh the Board on a periodic basis, including each time a directors appointment or re-appointment is required. The NRC is also responsible for reviewing the profiles of potential candidates vis-à-vis the required competencies, undertake a reference and due diligence and meeting of potential candidates prior to making recommendations of their nomination to the Board. At the time of appointment , specific requirements for the position, including expert knowledge expected, is communicated to the appointee.
Criteria for determining qualifications, positive attributes and independence of a director The NRC has formulated the criteria for determining qualifications, positive attributes and independence of directors in of the provisions of Section 178(3) of the Companies Act, 2013 and Regulation 19 of the Securities and Exchange Board of India (Listing Obligations and Disclosure Requirements) Regulations, 2015 (Listing Regulations), the key features of which are: •
Qualifications – The Board nomination process encourages diversity of thought, experience, knowledge, age and gender. It also ensures that the Board has an appropriate blend of functional and industry expertise.
63
Annual Report 2015-16
•
Positive Attributes- Apart from the duties of directors as prescribed in the Companies Act, 2013, the directors are expected to demonstrate high standards of ethical behaviour, communication skills and independent judgment. The directors are also expected to abide by the respective Code of Conduct as applicable to them.
•
Independence - A director will be considered independent if he / she meet the criteria laid down in Section 149(6) of the Companies Act, 2013 and Regulation 16(1)(b) the Listing Regulations.
Annual Evaluation of the Board, its Committees and Individual Directors The Board of directors had carried out an annual evaluation of its own performance, board committees and individual directors as required under the Companies Act, 2013 and the Listing Regulations. The performance of the board was evaluated by the board after seeking inputs from all the directors on the basis of criteria such as board composition, structure, board processes and their effectiveness, information given to the board etc. The performance of the board committees was evaluated by the board after seeking inputs from the committee on the basis of criteria such as committee composition, structure, effectiveness of committee meetings etc. The Board and the NRC reviewed the performance of the individual directors on the basis of criteria such as contribution at meetings, their preparedness on the issues to be discussed etc. Additionally the Chairman was also evaluated on key aspects of his role.
Remuneration Policy The NRC has formulated a policy relating to the remuneration for the directors, key managerial personnel and other employees. The philosophy for remuneration is based on the commitment of fostering a culture of leadership with trust. The remuneration policy has been prepared pursuant to the provisions of Section 178(3) of the Companies Act, 2013, and Regulation 19 of the Listing Regulations. While formulating this policy, the NRC has considered the factors laid down in Section 178(4) of the Companies Act, 2013, which are as under: •
•
That the level and composition of remuneration is reasonable and sufficient to attract, retain and motivate directors of the quality required to run the company successfully; Relationship of remuneration to performance is clear and meets appropriate performance benchmarks; and 64
•
Connect with every sip
•
Remuneration to directors, key managerial personnel and senior management involves a balance between fixed and incentive pay reflecting short and long-term performance objectives appropriate to the working of the company and its goals.
The key principles governing the remuneration policy are as follows:
•
Market competitiveness
•
Role played by the individual
•
Reflective of size of the company, complexity of the sector/ industry/ company’s operations and the company’s capacity to pay
•
Consistent with recognised best practices and
•
Aligned to any regulatory requirements
In accordance with the policy, the Managing / Executive directors / KMPs / employees are paid basic/ fixed salary, benefits, perquisites and allowances and annual incentive remuneration/ performance linked bonus subject to achievement of certain performance criteria and such other parameters as may be considered appropriate from time to time by the Board. The performance linked bonus would be driven by the outcome of the performance appraisal process and the performance of the Company.
Remuneration for independent directors and non independent non executive directors The non-executive Directors, including Independent Directors, are paid Sitting fees for attending the meetings of the Board and Committees of the Board. The overall remuneration (sitting fees and commission) should be reasonable and sufficient to attract, retain and motivate directors aligned to the requirements of the Company including considering the challenges faced by the Company and its future growth imperatives. The remuneration should also be reflective of the size of the Company, complexity of the business and the Company’s capacity to pay the remuneration. The Company pays a sitting fee of Rs. 30,000 per meeting per director for attending meetings of the Board, Audit, Nomination and Remuneration and Executive Committees (Rs. 20,000 in case of Mr. Cyrus Mistry, Chairman and Mr. Harish Bhat, Director). For meetings of all other Committees of the Board, a sitting fee of
Corporate Overview 01-48
Rs. 20,000 per meeting per director is paid (Rs. 15,000 in case of Mr. Cyrus Mistry, Chairman and Mr. Harish Bhat, Director). Within the ceiling of 1% of net profits of the Company computed under the applicable provisions of the Companies Act, 2013, the Non-Executive Directors including Independent Directors are also paid a commission, the amount whereof is recommended by the NRC and determined by the Board. The basis of determining the specific amount of commission payable to a Non-Executive Director is related to his attendance at meetings, role and responsibility as Chairman/Member of the Board/Committees and overall contribution as well as time spent on operational matters other than at the meetings. The shareholders of the Company had approved payment of commission to the non-executive directors at the Annual General Meeting held on 26th August 2014, which is valid up to the financial year ending 31st March 2019. No Stock option has been granted to the Non-Executive Directors.
Familiarisation programme for independent directors The details for familiarisation of the independent directors are given in the website and the same can be accessed at the link http://www.tataglobalbeverages.com/company/leadership/ board-of-directors As required under Regulation 46(2)(i) of the Listing Regulations, the details of familiarisation programmes conducted during the year 2015-16, is also put on the Company’s website.
Number of meetings of the Board Nine meetings of the Board of Directors were held during the year 2015-16. For further details, please refer to the Corporate Governance Report, which forms part of this Annual Report.
Audit Committee The details pertaining to composition of audit committee are included in the Corporate Governance Report which forms part of this Annual Report.
Significant and material orders ed by the Regulators or Courts There are no significant and material orders ed by the Regulators/Courts that would impact the going concern status of the Company and its future operations.
Corporate Social Responsibility and Sustainability initiatives The Natural Beverages Policy of Tata Global Beverages is the apex policy that incorporates all relevant elements of Sustainability, Corporate Social Responsibility, Affirmative Action, Community Initiatives and volunteering. It is aligned with the Tata Group Sustainability Policy, and is applicable to all units of Tata Global
Statutory Reports 49-124
Financial Statements 125-220
Beverages, including associate companies and t ventures. Through this policy, Tata Global Beverages aspires for global sustainability leadership in the natural beverages sector. The policy states that, “Tata Global Beverages is committed to be the most ired natural beverage company in the world by making a big and lasting difference through Sustainability and Corporate Social Responsibility. We shall achieve this by being the consumer’s first choice in sustainable beverage production and consumption.” The policy is built around the five pillars of sustainability - community development, sustainable sourcing, climate change, water management and waste management. In compliance with Section 135 of Companies Act, 2013, Tata Global Beverages has undertaken CSR activities, projects and programs, excluding activities undertaken in pursuance of its normal course of business. The report on CSR activities as required under Companies (Corporate Social Responsibility Policy) Rules, 2014 is given in Annexure 1 forming part of this report. The CSR Policy may be accessed on the Company’s website at the link http://www.tataglobalbeverages.com/docs/default-source/ default-document-library/corporate-social-responsibility-policy72 14b6881a2368caa65dff02001c5be1.pdf?sfvrsn=0 During the year under review, the Company has spent Rs. 5.53 Crores (around 2.46% of the average net profits of last three financial years) on CSR activities on projects qualifying as per Section 135 of the Companies Act, 2013 duly approved by the CSR Committee. In addition to the projects specified as CSR activities under Section 135 of Companies Act 2013, the Company has also carried out several other sustainability / responsible business initiatives and projects on a global scale. In 2015, for the fourth year in a row, Tata Global Beverages (TGB) was recognised on the Climate Disclosure Leadership Index (CDLI), and ranked second in India by CDP.
Particulars of employees The Information required under Section 197 read with Rule 5(1) of the Companies (Appointment and Remuneration of Managerial Personnel) Rules, 2014 are given in Annexure 2 which forms part of this report. Pursuant to Section 197 (14) of the Companies Act, 2013 the details of remuneration received by the Managing and Executive directors from the Company’s subsidiary company during 2015-16 are also given in Annexure 2 attached to this report.
Particulars of Loans, Guarantees or Investments by the Company Details of Loans, Guarantees and Investments covered under the provisions of Section 186 of the Companies Act, 2013 are provided in Annexure 3 attached to this report. 65
Annual Report 2015-16
•
Connect with every sip
Risk Management
Directors’ Responsibility Statement
The Risk Management Committee of the Board is entrusted with the responsibility to assist the Board in overseeing and approving the Company’s risk management framework. The Company has a comprehensive Risk policy and a Risk detailing the risks that the Company faces under various categories like strategic, financial, commercial, operational, IT, legal, regulatory, people, reputational and other risks and these have been identified and suitable mitigation measures have also been formulated. The Risk Management Committee reviews the key risks, the Risk and the mitigation measures periodically. The Audit Committee has additional oversight in the area of financial risks and control.
Pursuant to Section 134(5) of the Companies Act, 2013, the Board of Directors, to the best of their knowledge and ability, confirm that: (i)
In the preparation of the s for the financial year ended 31st March 2016, the applicable ing standards have been followed and that there are no material departures;
(ii)
That the Directors have selected such ing policies and applied them consistently and made judgments and estimates that were reasonable and prudent so as to give a true and fair view of the state of affairs of the Company at the end of the financial year and of the profits of the Company for that period;
(iii)
That the Directors have taken proper and sufficient care to the best of their knowledge and ability for the maintenance of adequate ing records in accordance with the provisions of the Companies Act, 2013 for safeguarding the assets of the Company and for preventing and detecting fraud and other irregularities;
Deposits from public
(iv)
The Company has not accepted any deposits from the public during the year under review. No amounts on of principal or interest on deposits from public was outstanding as on 31st March 2016.
That they have prepared the s for the financial year ended 31st March 2016 on a ‘going concern’ basis.
(v)
The Directors have laid down internal financial controls
Disclosures as per the Sexual Harassment of Women at Workplace (Prevention, Prohibition and Redressal) Act, 2013 The Company has zero tolerance for sexual harassment at workplace and has adopted a policy on prevention, prohibition and redressal of sexual harassment at workplace in line with the provisions of the Sexual Harassment of Women at Workplace (Prevention, Prohibition and Redressal) Act, 2013 and the Rules thereunder for prevention and redressal of complaints of sexual harassment at workplace.
Secretarial Audit Pursuant to the provisions of Section 204 of the Companies Act, 2013 and the Companies (Appointment and Remuneration of Managerial Personnel) Rules, 2014, the Company has appointed Dr. Asim Kumar Chattopadhyay, Company Secretary in Practice, to carry out the Secretarial Audit of the Company. The Report of the Secretarial Audit for 2015-16 is attached herewith as Annexure 4. There are no qualifications in the said report.
Annual Return As provided under Section 92(3) of the Companies Act, 2013, the extract of annual return in Form MGT-9 is given in Annexure 5 which forms part of this report.
66
for the company which are adequate and are operating effectively. (vi)
The Directors have devised proper systems to ensure compliance with the provisions of all applicable laws and such systems are adequate and are operating effectively.
Based on the framework of internal financial controls and compliance systems established and maintained by the Company, work performed by the internal, statutory and secretarial auditors including audit of internal financial controls over financial reporting by the statutory auditors and the reviews performed by Management and the relevant Board Committees, including the Audit Committee, the Board is of the opinion that the Company’s internal financial controls were adequate and effective during the financial year 2015-16.
Corporate Overview 01-48
Related Party Transactions All Related party transactions that were entered into during the financial year were on an arms length basis and in the ordinary course of business. There are no material significant related party transactions made by the Company during the year that would have required shareholder approval under Regulation 23(4) of the Listing Regulations and the erstwhile Clause 49 of the Listing Agreement. All related party transactions are reported to the Audit Committee. Prior approval of the Audit Committee is obtained for the transactions which are planned and/ or repetitive in nature and omnibus approvals are taken within the criteria/ limits laid down for unforeseen transactions. The disclosure under Section 134(3)(h) of the Companies Act, 2013 read with Rule 8(2) of the Companies (s) Rules, 2014 is not applicable. The Policy on Related Party transactions as approved by the Board has been ed on the Company’s Website and may be accessed at the link http://www.tataglobalbeverages.com/our-investors/ governance. The details of the transactions with related parties during 2015-16 are provided in the accompanying financial statements. None of the Directors had any pecuniary relationship or transactions with the Company during the year under review.
Directors and key managerial personnel At the Annual General Meeting of the Company held on 26th August 2014, the had approved the appointments of Mr. Analjit Singh, Mrs. Mallika Srinivasan, Mr. V Leeladhar, Mrs. Ranjana Kumar, Mr. Darius Pandole and Mrs. Ireena Vittal as Independent Directors for a term of five years from 26th August 2014. All the independent directors have given declarations that they meet the criteria of independence as provided in Section 149(6) of the Companies Act, 2013 and Regulation 16(1)(b) of Listing Regulations. In the opinion of the Board, they fulfill the conditions of independence as specified in the Act and the Rules made thereunder and they are independent of the management. Mr. Cyrus P Mistry retires by rotation at the forthcoming Annual General Meeting and being eligible, offers himself for re-election. Brief particulars and expertise of Mr. Mistry together with his other directorships and committee hips have been given in the annexure to the Notice of the Annual General Meeting in accordance with the requirements of Listing Regulations.
Financial Statements 125-220
Statutory Reports 49-124
No director or key managerial personnel was appointed or has retired or resigned during the year under review.
Auditors and Auditors’ Report The at the Annual General Meeting held on 26th August 2014, had appointed M/s. Lovelock and Lewes, as the Statutory Auditors for three years subject to ratification by the each year. The are requested to ratify the appointment of M/s. Lovelock and Lewes as Statutory Auditors from the conclusion of the fifty third Annual General Meeting till the conclusion of the fifty fourth Annual General Meeting. The Auditors’ report on the financial statements for the year 2015-16 does not contain any qualifications, reservations or adverse remarks.
Cost Auditors Your Board has appointed M/s. Shome and Banerjee, 5A Nurulla Doctor Lane, 2nd Floor, Kolkata - 700 017 as cost auditors of the Company for conducting cost audit for the financial year 2016-17. The are requested to ratify the remuneration payable to the Cost Auditors for 2016-17.
Disclosure requirements The information on conservation of energy, technology absorption and foreign exchange earnings and outgo pursuant to Section 134(3)(m) of the Companies Act, 2013, read with Rule 8(3) of the Companies (s) Rules, 2014 is given in Annexure 6 attached to this report.
Concluding Remarks The Directors wish to convey their appreciation to all of the Company’s employees for their sincere and dedicated services as well as their collective contribution to the Company’s performance.
Mumbai, 24th May 2016
On behalf of the Board of Directors
Cyrus P Mistry Chairman
67
Annual Report 2015-16
•
Connect with every sip
Annexure 1 to Directors’ Report Annual Report on CSR Activities 1.
A brief outline of the company’s CSR policy, including overview of projects or programs proposed to be undertaken and a reference to the web-link to the CSR policy and projects or programs: Natural Beverages Policy Tata Global Beverages (TGB) is committed to be the most ired natural beverage company in the world by making a big and lasting difference through Sustainability and Corporate Social Responsibility. We shall achieve this by being the consumer’s first choice in sustainable beverage production and consumption. TGB shall focus on Climate Change, Water Management, Sustainable Sourcing, Waste Management and Community Development. Towards community development, we shall undertake programs focused on education and skills, healthcare and women empowerment. We shall actively participate in TATA Group activities and programs for volunteering and affirmative action. We shall achieve this by being knowledgeable, responsive and trustworthy, and by adopting environmentally and socially-friendly technologies, business practices and innovation, while pursuing long-term growth aspirations and the enhancement of stakeholder value. The Corporate Social Responsibility (CSR) Policy of the Company is available at http://www.tataglobalbeverages. com/docs/default-source/default-document-library/ corporate-social-responsibility-policy7214b6881a2368caa6 5dff02001c5be1.pdf?sfvrsn=0 Overview of projects implemented during 2015-16 as identified for the purpose of Section 135 of the Companies Act, 2013: Education • Srishti is a welfare centre for the differently abled in Munnar, Kerala. Srishti is the umbrella under which Tata Global Beverages is enabling learning and economic opportunities for differently-abled youth, through its training and rehabilitation initiatives in Munnar. Set up in 1991, Srishti has five projects: The DARE (Development Activities in Rehabilitative Education) School, DARE Strawberry Unit, Athulya (handmade paper and paper products), Aranya (natural dye project) and The Deli (confectionery unit). The welfare centre serves differently-abled children of the of the plantation community. TGB s the welfare centre by sponsoring the operational expenses. Healthcare • Providing affordable healthcare has always been a key community intervention for TGB. The Referral Hospital and Research Centre (RHRC) Chubwa in Assam provides free or subsidized medical facilities
68
to general population and the tea communities. New medical specialities, namely, Orthopaedics, Neurosurgery and Physiotherapy have been introduced at the hospital. The eHub, located at RHRC for the e-Healthcare Project in collaboration with Hewlett Packard, has been completed and gone live. During FY 2015-16, the hospital has treated a total of 38,660 patients (OPD & IPD). TGB’s CSR contribution to the hospital is ed for by covering the deficit incurred by the hospital. • TGB s the St. Jude’s India Child Care Centres to extend help to the cancer affected children. St Judes provides needy children under treatment for cancer with a clean, safe, hygienic place to stay, nutritional , transportation to hospital for treatment, as well as recreation, education and counselling. Skill Development • TGB s Unnati (a Bangalore based NGO) in providing job oriented training for youth from the under privileged communities. Unnati has provided training and placement of 182 youths from the under privileged communities in FY 15-16. Women Empowerment • The UNICEF-ETP project aims to promote child rights and reduce their vulnerability to trafficking and abuse in the 3 districts of Assam (Dibrugarh, Sivasagar, Tinsukia). The first year of the project has seen the successful implementation at 87 tea gardens, all of which now have active Adolescent Girls’ Groups (AGG) and Child Protection Committees (C). Across these estates and the local communities, nearly 14,000 girls have been reached. TGB co-funds the cost of the program that includes awareness creation and on-ground implementation of the programme to prevent human trafficking. • TGB is ing Concern India Foundation for livelihood opportunities for rural women in 1100 families of 11 villages from Haveri and Ranebennur districts in Karnataka. Affirmative Action TGB has a clear focus and strategic approach towards driving Affirmative Action (AA). This means that the organisation is committed to directly conducting and ing initiatives for socially and economically disadvantaged sections in the country at large, and in particular the AA initiatives are specifically focused on the Scheduled caste and Scheduled tribe communities in India. The Tata Affirmative Action programme has defined criteria and the processes are driven through 4Es – Employment, Employability, Entrepreneurship and Education. Rural Infrastructure TGB has funded rural infrastructure upgradation in Dhaulakuwan, District Sirmour, Himachal Pradesh during the financial year 2015-16.
Corporate Overview 01-48
2.
Composition of the CSR Committee TGBL has constituted a robust governance structure to oversee the implementation of the CSR projects, in compliance with the requirements of Section 135 of the Companies Act, 2013. The CSR governance structure of TGBL will be headed by the Board CSR Committee. The Board CSR Committee grants auxiliary power to the Working Committee of the Company to act on their behalf. The CSR Committee of the Board comprises of the following : a. Ranjana Kumar (Mrs.) (Chairperson) b. V. Leeladhar c. S. Santhanakrishnan
c.
Financial Statements 125-220
Statutory Reports 49-124
d. Ajoy Misra e. Prof. S. Parasuraman (Expert Member) Average net profit of the company for last three 3. financial years: Rs. 224.85 Crores 4. Prescribed CSR Expenditure (two per cent of the amount as in item 3 above): Rs. 4.50 Crores 5. Details of CSR spent during the financial year : a. Total amount to be spent for the financial year: Rs. 4.50 Crores b. Total amount spent during the financial year: Rs. 5.53 Crores (2.46% of average net profit) Amount unspent, if any : Nil
Manner in which the amount spent during the financial year is detailed below:
Sl. CSR Project or Activity Identified No.
Relevant Section of Schedule VII in which the project is covered
Projects or programs (1) Local area or other (2) Specify the State and District where projects or programs was undertaken
1 2
Skill Development training to AA Youth Skill Development training to differently abled Affordable healthcare for all
(ii) (ii)
Bangalore,Karnataka Munnar, Kerala
(i)
Chubwa, Assam
2.25
2.87
(iii) (ii)
Assam Chennai
0.50 0.12
0.49 0.12
6
Creating Awareness on human trafficking Enhancing skills of women in up cycling of laminates ing Cancer affected children
(i)
Kolkata
0.22
0.20
7
Providing rural infrastructure
(x)
-
0.05
8
Formation and strengthening of women self-help groups
(iii)
Paonta Sahib, Himachal Pradesh Haveri, Karnataka
0.04
0.06
4.69
5.53
3 4 5
Schedule VII (i) Eradicating hunger, poverty and malnutrition, promoting preventive health care and sanitation and making available safe drinking water; (ii) Promoting education, including special education and employment enhancing vocation skills especially among children, women, elderly, and the differently abled and livelihood enhancement projects; (iii) Promoting gender equality, empowering women, setting up homes and hostels for women and orphans; setting up old age homes, day care centres and such other facilities for senior citizens and measures for reducing inequalities faced by socially and economically backward groups. (x) Rural Infrastructure
Amount Outlay (Budget) Project or program wise (Rs. in Crores) 0.26 1.30
Amount spent on the projects or program subheads
Cumulative Expenditure upto the reporting period
Amount Spent: Direct or through Implementing agency
(Rs. in Crores) (Rs. in Crores) 0.22 0.22 Unnati 1.52 1.52 Direct 2.87 Associate Company 0.49 UNICEF and ETP 0.12 Exanora 0.20 ST Jude’s Child Care Centres 0.05 Government of H.P. 0.06 Concern India Foundation 5.53
CSR Committee responsibility statement Through this report, TGBL seeks to communicate its commitment towards CSR to the Ministry of Corporate Affairs. The implementation and monitoring of our CSR Policy is in compliance with the CSR objectives and policies as laid down in this report. The Board of the Company and the CSR Committee is responsible for the integrity and the objectivity of all the information provided in the disclosure above.
Ajoy Misra Chief Executive Officer and Managing Director Mumbai, 24th May 2016
Ranjana Kumar Chairperson, CSR Committee
69
Annual Report 2015-16
•
Connect with every sip
Annexure 2 to Directors’ Report Particulars of Employees The information required under Section 197 of the Companies Act, 2013 read with Rule 5(1) of the (Companies Appointment and Remuneration of Managerial Personnel) Rules, 2014 are given below: a)
The ratio of the remuneration of each director to the median remuneration of the employees of the Company for the financial year: Non- Executive Directors Mr. Cyrus P Mistry Mr. Harish Bhat Mrs. Mallika Srinivasan Mr. Analjit Singh Mr. V Leeladhar Mrs. Ranjana Kumar Mr. Darius Pandole Mr. S Santhanakrishnan Mrs. Ireena Vittal
Ratio to median remuneration* 1.79 2.97 10.35 3.75 54.48 41.81 36.31 25.96 26.36
Executive Directors
Ratio to median remuneration*
Mr. Ajoy Misra
229.68
Mr. L KrishnaKumar
205.23
*Median salary computation is based on a total employee head count of 2,552 of which approximately 2,000 employees are within collective bargaining process. b)
The percentage increase in remuneration of each Director, Chief Executive Officer, Chief Financial Officer, Company Secretary in the financial year: Directors, Chief Executive Officer, Chief Financial Officer and Company Secretary Mr. Cyrus P Mistry# Mr. Harish Bhat # Mrs. Mallika Srinivasan Mr. Analjit Singh Mr. V Leeladhar Mrs. Ranjana Kumar Mr. Darius Pandole Mr. S Santhanakrishnan Mrs. Ireena Vittal Mr. Ajoy Misra, Chief Executive Officer and Managing Director** Mr. L KrishnaKumar, Executive Director and Group CFO** Mr. John Jacob, Chief Financial Officer*** Mr. V Madan, Company Secretary
% increase in remuneration in the financial year^ 47% 18% 1% (47%) 5% 13% 18% (3%) 18% 12% 8% 13%
^ For the purposes of these computations, incentive remuneration has been considered based on accruals and payments relating to earlier years have been excluded.
# Mr. Cyrus P Mistry and Mr. Harish Bhat draw only sitting fees from the Company.
** Compensation paid from a Subsidiary Company in UK has also been considered for computation of the increase.
***Appointed as CFO for a part of the year in FY 2014-15 and hence remuneration numbers are not comparable.
70
Corporate Overview 01-48
Financial Statements 125-220
Statutory Reports 49-124
c)
The percentage increase in median remuneration of employees in the financial year: 8%
d)
The number of permanent employees on the rolls of the Company: 2,552
e)
The explanation on the relationship between average increase in remuneration and Company performance:
On an average, employees (excluding unionised staff ) received an annual increase of around 12%. The increase in remuneration is in line with current market trends. In order to ensure that remuneration reflects Company performance, the performance pay is linked to both individual performance rating and business performance.
f )
Comparison of the performance of the key managerial personnel against the performance of the Company:
In line with Company’s remuneration policy, salary increases and annual bonus pay-outs of its employees including key managerial personnel are directly linked to individual performance as well as Company’s performance. The remuneration to key managerial personnel in addition to these factors also takes into various other parameters as decided and approved by Nomination and Remuneration Committee.
g)
Variations in the market capitalisation of the Company, price earnings ratio as at the closing date of the current financial year and previous financial year: Particulars Market Capitalisation (Rs. Crores)
h)
Price Earnings Ratio* * Based on consolidated performance
March 31 2016
March 31, 2015
% Change
7652.45
9201.77
(16.84%)
23.50
37.86
(37.93%)
Percentage increase over decrease in the market quotations of the shares of the Company in comparison to the rate at which the Company came out with the last public offer: Particulars Market Price (Rs.)*
March 31 2016
Issue price at last IPO
% Change
121.25
1
12025%
*Face value of share was sub-divided to Re. 1 from Rs. 10 on 2nd July 2010.
i)
Average percentile increase already made in the salaries of employees other than the managerial personnel in the last financial year and its comparison with the percentile increase in the managerial remuneration and justification thereof and point out if there are any exceptional circumstances for increase in the managerial remuneration:
Average percentage increase for other than managerial personnel (excluding unionised staff ) works to around 12%. The percentage increase for all employees was 10%. Increase in the managerial remuneration was 10% (including compensation paid from a Subsidiary Company in the UK). Percentage increases for various categories are granted based on market trends and performance criteria.
71
Annual Report 2015-16
j)
•
Connect with every sip
Comparison of each remuneration of the key managerial personnel against the performance of the Company: Particulars
Remuneration (Rs. Crores) Standalone Revenue (Rs. Crores) Remuneration as a % of Standalone Revenue Standalone Earnings Before Interest and Tax (Rs. Crores) Remuneration as a % of Standalone Earnings Before Interest and Tax Consolidated Revenue (Rs. Crores) Remuneration as a % of Consolidated Revenue Consolidated Earnings Before Interest and Tax (Rs. Crores) Remuneration as a % of Consolidated Earnings Before Interest and Tax
Mr Ajoy Misra CEO and Managing Director
Mr L KrishnaKumar Executive Director and Group CFO
Mr John Jacob CFO
Mr V Madan Company Secretary
2.82
2.52
1.44
1.11
0.05
0.03
0.45
0.35
0.02
0.01
0.27
0.21
3190.49 0.09
0.08 319.44
0.88
0.79
0.03
0.03
8181.11
531.73 0.53
0.47
k)
The key parameters for any variable component of remuneration availed by directors:
The variable pay for the directors is recommended by the Nomination and Remuneration Committee based on the actual performance of the organisation against the performance criteria laid down in addition to the evaluation of directors’ personal contribution.
l)
The ratio of the remuneration of the highest paid director to that of the employees who are not directors but receive remuneration in excess of the highest paid director during the year: None.
m)
Affirmation that the remuneration is as per the remuneration policy of the Company:
The Company affirms that the remuneration is as per the remuneration policy of the Company.
n)
The statement containing particulars of employees as required under Section 197(12) of the Companies Act, 2013 (“the Act”) read with Rule 5(2) of the Companies (Appointment and Remuneration of Managerial Personnel) Rules, 2014, is provided in a separate annexure forming part of this report . However, the report and the s are being sent to the excluding the aforesaid annexure. In of Section 136 of the Act, the said annexure is open for inspection at the ed Office of the Company. Any shareholder interested in obtaining a copy of the same may write to the Company Secretary.
o)
Disclosure under Section 197(14) of the Companies Act, 2013:
Mr. Ajoy Misra, Managing Director and Mr. L. KrishnaKumar, Executive Director, received remuneration of Rs. 65.35 Lakhs and Rs.42.39 Lakhs respectively from the Company’s overseas subsidiary, Tata Global Beverages (GB) Ltd. during the year 2015-16. (The remuneration drawn in GBP has been converted into INR at average exchange rate). On behalf of the Board of Directors
Mumbai 24th May 2016
72
Cyrus P Mistry Chairman
Corporate Overview 01-48
Statutory Reports 49-124
Financial Statements 125-220
Annexure 3 to Directors’ Report Particulars of Investment made and Guarantee/Loan given during the year: Particulars of Investment made, Guarantee given and Loan given
Name of the Entity
Investments
NourishCo Beverages Limited
13.00
Tata Starbucks Private Limited
28.00
Zhejiang Tata Tea Extractions Limited#
33.54
Mutual Funds - Net
Amount Purpose for which Loan,Guarantee is (Rs. in Crores) proposed to be utilised by recipient
Not Applicable
162.50
Guarantee
Zhejiang Tata Tea Extractions Limited
3.41 Corporate Guarantees were issued against loans drawn by a Subsidiary Company from banks as working capital loans and term debts
Inter Corporate Deposits
Kerala Ayurveda Limited^
4.75
Casa Décor Private Limited*^
5.00
Taj Air Limited^
7.50
Tata Housing Limited*
Cash Management / Trade Deposits
50.00
# Loans converted into Equity * Given and repaid during the year ^ Renewed during the year
On behalf of the Board of Directors
Mumbai 24th May 2016
Cyrus P Mistry Chairman
73
Annual Report 2015-16
•
Connect with every sip
ANNEXURE 4 TO DIRECTORS’ REPORT FORM NO. MR-3 SECRETARIAL AUDIT REPORT FOR THE FINANCIAL YEAR ENDED 31st MARCH 2016 [Pursuant to Section 204(1) of the Companies Act, 2013 and Rule No.9 of the Companies (Appointment and Remuneration of Personnel) Rules, 2014] To, The , Tata Global Beverages Limited 1, Bishop Lefroy Road Kolkata – 700 020 I have conducted the secretarial audit of the compliance of applicable statutory provisions and the adherence to good corporate practices by Tata Global Beverages Limited, (hereinafter called the Company). Secretarial Audit was conducted in a manner that provided me a reasonable basis for evaluating the corporate conduct/statutory compliances and expressing my opinion thereon. Based on my verification of the Company’s books, papers, minute books, forms and returns filed and other records maintained by the Company and also the information provided by the Company, its officers, agents and authorised representatives during the conduct of secretarial audit, I hereby report that in my opinion, the company has, during the audit period covering the financial year ended on 31st March, 2016 complied with the statutory provisions listed hereunder and also that the Company has proper Board-processes and compliance-mechanism in place to the extent, in the manner and subject to the reporting made hereinafter: I have examined the books, papers, minute books, forms and returns filed and other records maintained by Tata Global Beverages Limited for the financial year ended on 31st March 2016 according to the provisions as may be applicable to the Company of:
b.
The Securities and Exchange Board of India (Prohibition of Insider Trading) Regulations, 2015;
c.
The Securities and Exchange Board of India (Listing Obligations And Disclosure Requirements) Regulations, 2015;
d.
The Securities and Exchange Board of India (Issue and Listing of Debt Securities) Regulations, 2008;
e.
The Securities and Exchange Board of India (Issue of Capital and Disclosure Requirements) Regulations, 2009;
f.
The Securities and Exchange Board of India (Share Based Employee Benefits) Regulations, 2014: Not applicable during the period under review.
g.
The Securities and Exchange Board of India (Registrars to an Issue and Share Transfer Agents) Regulations, 1993 regarding the Companies Act and dealing with client: Not applicable during the period under review as the Company is not acting as a Registrar and Share Transfer Agent.
h.
The Securities and Exchange Board of India (Delisting of Equity Shares) Regulations, 2009: Not applicable during the period under review.
i.
The Securities and Exchange Board of India (Buyback of Securities) Regulations, 1998: Not applicable during the period under review.
The Food Safety and Standards Act, 2006 along with Food Safety and Standards Rules 2011;
(i)
The Companies Act, 2013 (the Act) and the rules made thereunder;
(vi)
(ii)
The Securities Contracts (Regulation) Act, 1956 (‘SCRA’) and the rules made thereunder;
(vii) The Tea Board Guidelines and Orders;
(iii)
The Depositories Act, 1996 and the Regulations and Bye-laws framed thereunder;
(iv)
Foreign Exchange Management Act, 1999 and the rules and regulations made thereunder;
(v)
The following Regulations and Guidelines prescribed under the Securities and Exchange Board of India Act, 1992 (‘SEBI Act’);
a.
74
The Securities and Exchange Board of India (Substantial Acquisition of Shares and Takeovers) Regulations, 2011;
(viii) Pollution Control Act, Rules and Notification issued thereof; (ix)
Legal Metrology Act, 2009 and Rules made thereunder;
(x) The Tea Act, 1953 and Tea Warehouse (Licensing) Order, 1989; (xi) The Factories Act, 1948 and Rules made thereunder; (xii)
Shops and Establishment Act, 1953;
(xiii) The Employees Provident Fund and Miscellaneous Provisions Act, 1952 and Rules made thereunder; (xiv) The Maternity Benefits Act, 1961;
Corporate Overview 01-48
(xv)
The Minimum Wages Act, 1948;
(xvi) The Payment of Bonus Act, 1965; (xvii) The Payment of Gratuity Act, 1972; (xviii) The Employment Exchange (Compulsory Notification of Vacancies) Act, 1959; (xix) The Payment of wages Act, 1936 and other applicable Industrial and Labour Laws. I have also examined compliance of Secretarial Standards on Board of Directors (SS-1) and General Meetings (SS-2) issued by the Institute of Company Secretaries of India and made effective from 1st July, 2015. During the period under review, the Company has complied with the provisions of the Act, Rules, Regulations, Guidelines, Standards, etc. mentioned above. I further report that The Board of Directors of the Company is duly constituted with proper balance of Executive Directors, Non-Executive Directors and Independent Directors. No changes has taken place in the composition of the Board of Directors during the period under review. Adequate notice is given to all the directors to schedule the Board Meetings, agenda and detailed notes on agenda were sent at least seven days in advance, and a system exists for seeking and obtaining further information and clarifications
Statutory Reports 49-124
Financial Statements 125-220
on the agenda items before the meeting and for meaningful participation at the meeting. The Resolutions ed by the Board of Directors and Committees thereof had no dissenting views which were required to be captured and minuted. I further report that there are adequate systems and processes in the Company commensurate with the size and operations of the Company to monitor and ensure compliance with applicable laws, rules, regulations and guidelines. I also report that with regard to Amalgamation of Mount Everest Mineral Water Limited with the Company, on the basis of Scheme of Amalgamation as approved by both the Hon’ble High Courts at Calcutta and Himachal Pradesh (Shimla) Effective Date of the Amalgamation /Merger was 18th May 2015 on submission of requisite Form with the Registrar of Companies, West Bengal as well as Himachal Pradesh. Accordingly, the Equity Shares of the Company were allotted thereafter to the Equity Shareholders of the Transferor Company as per the said scheme and also Listed with the Company’s concerned stock exchanges.
12th May 2016
Dr. Asim Kumar Chattopadhyay Practising Company Secretary FCS No. 2303 Certificate of Practice No. 880
Annexure “A” (TO THE SECRETARIAL AUDIT REPORT OF TATA GLOBAL BEVERAGES LIMITED FOR THE FINANCIAL YEAR ENDED 31st MARCH 2016) To, The Tata Global Beverages Limited 1, Bishop Lefroy Road Kolkata 700 020 My Report for the financial year ended 31st March 2016 of even date is to be read along with this letter. 1.
2.
Maintenance of secretarial records is the responsibility of the management of the Company. My responsibility is to express an opinion on these secretarial records based on my audit. I have followed the audit practices and processes as were appropriate to obtain reasonable assurance about the correctness of the contents of the secretarial records. The verification was done on test basis to ensure that correct facts are reflected in secretarial records. I believe that the processes and practices, I followed provide a reasonable basis for my opinion.
3.
I have not verified the correctness and appropriateness of financial records and Books of s of the Company.
4.
Wherever required, I have obtained the management representation about the compliance of laws, rules and regulations and happening of events etc.
5.
The compliance of the provisions of Corporate and other applicable laws, rules, regulations, standards is the responsibility of management. My examination was limited to the verification of procedures on test basis.
6.
The Secretarial Audit Report is neither an assurance as to the future viability of the Company nor of the efficacy or effectiveness with which the management has conducted the affairs of the Company.
12th May 2016
Dr. Asim Kumar Chattopadhyay Practising Company Secretary FCS No. 2303 Certificate of Practice No. 880
75
Annual Report 2015-16
•
Connect with every sip
ANNEXURE 5 TO DIRECTORS’ REPORT Form No. MGT-9 Extract Of Annual Return As on the financial year ended on 31st March 2016 [Pursuant to Section 92(3) of the Companies Act, 2013 and Rule 12(1) of the Companies (Management and istration) Rules, 2014]
I.
REGISTRATION AND OTHER DETAILS i)
CIN
L15491WB1962PLC031425
ii)
Registration Date
18th October 1962
iii)
Name of the Company
Tata Global Beverages Limited
iv)
Category / Sub Category of the Company
Company Limited by shares / Indian Non Government Company
v)
Address of the ed office and details
1, Bishop Lefroy Road, Kolkata – 700 020 Tel: 033-22836917 Fax: –22833032 Email: [email protected]
vi)
Whether listed company (Yes / No)
Yes
vii)
Name, Address and details of Registrar TSR Darashaw Limited and Transfer Agent, if any 6-10 Haji Moosa Patrawala Ind. Estate 20 Dr. E Moses Road, Mahalaxmi Mumbai – 400 011 Telephone : 022-66568484 Fax : 022-66568494 Website : www.tsrdarashaw.com E-mail : [email protected]
II.
PRINCIPAL BUSINESS ACTIVITIES OF THE COMPANY
(All the business activities contributing 10% or more of the total turnover of the company shall be stated)
III.
Sl. No.
Name and Description of main products /services
1
Processing and blending of tea including manufacture of Instant tea
NIC Code of the Product/ service
% to total turnover of the Company
NIC Code 107921
98.96
PARTICULARS OF HOLDING, SUBSIDIARY AND ASSOCIATE COMPANIES Sl. No.
Name and Address of the Company
CIN/GLN
1
Tata Global Beverages Group Limited 325 Oldfield Lane North, Greenford, Middlesex, UB6 0AZ, UK Tata Global Beverages Holdings Limited 325 Oldfield Lane North, Greenford, Middlesex, UB6 0AZ, UK Tata Global Beverages Services Limited 325 Oldfield Lane North, Greenford, Middlesex, UB6 0AZ, UK Tata Global Beverages GB Limited 325 Oldfield Lane North, Greenford, Middlesex , UB6 0AZ, UK
N.A.
Holding/ Subsidiary/ Associate Subsidiary
N.A.
2
3
4
76
% of shares held
Applicable Section
88.65
2 (87)
Subsidiary
100
2 (87)
N.A.
Subsidiary
100
2 (87)
N.A.
Subsidiary
100
2 (87)
Corporate Overview 01-48
Sl. No.
Name and Address of the Company
5
Tata Global Beverages Overseas Holdings Limited 325 Oldfield Lane North, Greenford, Middlesex , UB6 0AZ, UK Tata Global Beverages Overseas Limited 325 Oldfield Lane North, Greenford, Middlesex , UB6 0AZ, UK Lyons Tetley Limited 325 Oldfield Lane North, Greenford, Middlesex , UB6 0AZ, UK Drassington Limited 325 Oldfield Lane North, Greenford, Middlesex , UB6 0AZ, UK Teapigs Limited 325 Oldfield Lane North, Greenford, Middlesex , UB6 0AZ, UK Teapigs US LLC 195 Chrystie Street, #602E, New York, New York 10002 Stansand Limited 325 Oldfield Lane North, Greenford, Middlesex , UB6 0AZ, UK Stansand (Brokers) Limited 325 Oldfield Lane North, Greenford, Middlesex , UB6 0AZ, UK Stansand (Africa) Limited 3rd Floor Tea House, Nyerere Abenue P. O. Box 90683-80100 Mombasa, Kenya Stansand (Central Africa) Limited Along Masauko Chipembere Highway-Maselema AreaLimbe, P. O. Box 546, Blantyre, Malawi Joekels Tea Packers (Proprietary) Limited Joekels 12 Caversham Road Pinetown 3610 Kwazulu Natal South Africa Tata Global Beverages Polska Sp.zo.o. UL Zolny 33 02-815 Warszawa, Poland Tata Global Beverages Czech Republic a.s. Znojemska 687 675 31 Jemnice Czech Republic Tata Global Beverages US Holdings Inc. 155 Chestnut Ridge Road, Montvale, New Jersey 07645 Tetley USA Inc. 155 Chestnut Ridge Road, Montvale, New Jersey 07645 Good Earth Corporation 155 Chestnut Ridge Road, Montvale, New Jersey 07645 Good Earth Teas Inc. 155 Chestnut Ridge Road, Montvale, New Jersey 07645
6
7
8
9
10
11
12
13
14
15
16
17
18
19
20
21
Statutory Reports 49-124
CIN/GLN
Financial Statements 125-220
N.A.
Holding/ Subsidiary/ Associate Subsidiary
% of shares held
Applicable Section
100
2 (87)
N.A.
Subsidiary
100
2 (87)
N.A.
Subsidiary
100
2 (87)
N.A.
Subsidiary
100
2 (87)
N.A.
Subsidiary
100
2 (87)
N.A.
Subsidiary
100
2 (87)
N.A.
Subsidiary
100
2 (87)
N.A.
Subsidiary
100
2 (87)
N.A.
Subsidiary
100
2 (87)
N.A.
Subsidiary
100
2 (87)
N.A.
Subsidiary
51
2 (87)
N.A.
Subsidiary
100
2 (87)
N.A.
Subsidiary
100
2 (87)
N.A.
Subsidiary
100
2 (87)
N.A.
Subsidiary
100
2 (87)
N.A.
Subsidiary
100
2 (87)
N.A.
Subsidiary
100
2 (87)
77
Annual Report 2015-16
Sl. No.
Name and Address of the Company
22
Tata Global Beverages Canada Inc. 10 Carlson street, Etobicoke, Ontario M9W6L2, Canada Tata Global Beverages Australia Pty. Limited 620 Church Street, Richmond, Victoria, Australia 3121 Earth Rules Pty. Limited 620 Church Street, Richmond, Victoria, Australia 3121 Tata Global Beverages Investments Limited 325 Oldfield Lane North, Greenford, Middlesex, UB6 0AZ, UK Campestres Holdings Limited Capital Center, 9th Floor, 2-4 Makarios Avenue, 1065 Nicosia, Cyprus Kahutara Holdings Limited Capital Center, 9th Floor, 2-4 Makarios Avenue, 1065 Nicosia, Cyprus Suntyco Holding Limited Capital Center, 9th Floor, 2-4 Makarios Avenue, 1065 Nicosia, Cyprus Onomento Co. Limited Capital Center, 9th Floor, 2-4 Makarios Avenue, 1065 Nicosia, Cyprus OOO Sunty LLC Prospect Mira Street, 69 Building 1, Moscow, 129110, Russian Federation OOO Tea Trade LLC Prospect Mira Street, 69 Building 1, Moscow, 129110, Russian Federation Tata Global Beverages Capital Limited 325 Oldfield Lane North, Greenford, Middlesex, UB6 0AZ, UK Tata Coffee Ltd Pollibetta, Kodagu, Karnataka Consolidated Coffee Inc. 155 Chestnut Ridge Road, Montvale, New Jersey 07645 Eight ‘O Clock Holdings Inc. 155 Chestnut Ridge Road, Montvale, New Jersey 07645 Eight ‘ O Clock Coffee Company 155 Chestnut Ridge Road, Montvale, New Jersey 07645 Tata Tea Extractions Inc 1001 W Dr M L King Jr Blvd Plant City, FL 33563, USA Zhejiang Tata Tea Extraction Co. Limited Economic Development Zone, Anji, Zhejiang, China
23
24
25
26
27
28
29
30
31
32
33
34
35
36
37
38
78
CIN/GLN
•
Connect with every sip
N.A.
Holding/ Subsidiary/ Associate Subsidiary
% of shares held
Applicable Section
100
2 (87)
N.A.
Subsidiary
100
2 (87)
N.A.
Subsidiary
100
2(87)
N.A.
Subsidiary
100
2 (87)
N.A.
Subsidiary
100
2 (87)
N.A.
Subsidiary
65
2 (87)
N.A.
Subsidiary
100
2 (87)
N.A.
Subsidiary
100
2 (87)
N.A.
Subsidiary
100
2 (87)
N.A.
Subsidiary
100
2 (87)
N.A.
Subsidiary
100
2 (87)
L01131KA1943PLC000833
Subsidiary
57.48
2 (87)
N.A.
Subsidiary
100
2 (87)
N.A.
Subsidiary
100
2 (87)
N.A.
Subsidiary
100
2 (87)
N.A.
Subsidiary
100
2 (87)
N.A.
Subsidiary
81.46
2 (87)
Corporate Overview 01-48
Sl. No.
Name and Address of the Company
39
Tata Tea Holdings Private Limited 4th Floor, New Excelsior Building, Amrit Keshav Nayak Marg, Fort, Mumbai – 400 001 RBC Hold Co LLC $ 1614, 15th Street Suite 200 Denver, CO 80202 USA TRIL Constructions Limited Elphinstone Building, 2nd Floor, 10 Veer Nariman Road, Mumbai - 400 001
U67190MH2008PTC187767
Holding/ Subsidiary/ Associate Subsidiary
N.A.
Mount Everest Mineral Water Limited* Village Dhaula Kuan , District Sirmour-173 025 Himachal Pradesh , India Estate Management Services Private Ltd No.60, Dharmapala Mawatha, Colombo 03 Amalgamated Plantations Private Ltd 1, Bishop Lefroy Road, Kolkata – 700 020 Kanan Devan Hills Plantations Private Ltd KDHP House, Munnar, Kerala- 685612 B Jets Pte. Limited # 80, Raffles Place, #32-01 UOB, Plaza 1, Singapore-048624 Empirical Group, LLC 155 Chestnut Ridge Road, Montvale, New Jersey 07645 NourishCo Beverages Limited 3B, DLF Corporate Park ‘S’ Block Phase 3 Gurgaon 122002 Haryana Tata Starbucks Private Limited 4th Floor, New Excelsior Building, Amrit Keshav Nayak Marg Fort, Mumbai – 400 001 Tetley ACI (Bangladesh) Limited 245 Tejgaon Industrial Area, Dhaka - 1208 Southern Tea, LLC 1267 Cobb Industrial Drive, Marietta, Georgia 30066 Tetley Clover (Private) Limited Lakson Square Building No 2 Sarwar Shaheed Road, Karachi
40
41
42
43
44
45
46
47
48
49
50
51
52
Statutory Reports 49-124
CIN/GLN
Financial Statements 125-220
% of shares held
Applicable Section
100
2 (87)
Subsidiary
59.89
2 (87)
U45201MH2007PLC171985
Subsidiary
50.12@
2 (6)
L15543HP1991PLC019065
Subsidiary
50.07
2 (87)
N.A.
Associate
31.85
2 (6)
U01132WB2007PTC112852
Associate
41.03
2 (6)
U01132KL2005PTC018014
Associate
28.52
2 (6)
N.A.
Associate
49.31
2 (6)
N.A.
t Venture
56.00
2 (6)
U15500HR2010PLC041616
t Venture
50
2 (6)
U74900MH2011PTC222589
t Venture
50
2 (6)
N.A.
t Venture
50
2 (6)
N.A.
t Venture
50
2( 6)
N.A.
t Venture
50
2 (6)
% of shares held shown above is by the immediate Holding Company $ Dissolved during 2015-16 # Ceased to be ed as an Associate Company since 2014-15 * Amalgamated with the Company w.e.f. 18.05.2015 (Appointed date 1st April 2013) @ Includes investments in Preference Shares
79
Annual Report 2015-16
•
Connect with every sip
IV.
SHARE HOLDING PATTERN (Equity Share Capital Breakup as percentage of Total Equity)
(i)
Category-wise Share Holding Category of Shareholders
A. Promoters (1) Indian a) Individuals/ HUF b) Central Government c) State Government(s) d) Bodies Corporate e) Banks / Financial Institutions f ) Any Other Sub-total (A)(1) (2) Foreign a) NRIs – Individuals b) Other – Individuals c) Bodies Corporate d) Banks / Financial Institutions e) Any other Sub-total(A)(2) Total shareholding of Promoter and Promoter Group (A) = (A)(1) + (A)(2) B. Public Shareholding 1. Institutions a) Mutual Funds/UTI b) Banks / Financial Institutions c) Central Government d) State Government(s) e) Venture Capital Funds f ) Insurance Companies g) Foreign Institutional Investors h) Foreign Venture Capital Funds i) Foreign Portfolio Investors (corporate) j) Others (specify) Sub -total (B)(1) 2. Non-Institutions a) Bodies Corporate b) Individuals i) Individual shareholders holding nominal share capital upto Rs. 1 Lakh ii) Individual shareholders holding nominal share capital in excess of Rs. 1 Lakh c) Qualified Foreign Investors d) Any Others (specify) (i) Trusts (ii) Directors and their relatives (iii) OCB’s/Foreign Cos (iv) Non-Resident Individuals (v) Foreign Bodies-DR (vi) Foreign Bodies (vii) Foreign Institutional Investors (viii) Foreign Nationals- DR Sub-Total(B)(2) Total Public Shareholding (B)=(B)(1)+ (B)(2) C. Shares held by Custodian for GDRs & ADRs Grand Total (A+B+C)
80
No. of Shares held at the beginning of the year Physical Total % of Demat Total Shares
Demat
No. of Shares held at the end of the year Physical Total % of Total Shares
% Change during the year
0 0 0 21,70,83,190 0 0 21,70,83,190
0 0 0 0 0 0 0 21,70,83,190 0 0 0 0 0 21,70,83,190
0.00 0 0.00 0 0.00 0 35.10 21,71,28,190 0.00 0 0.00 0 35.10 21,71,28,190
0 0 0 0 0 0 0 21,71,28,190 0 0 0 0 0 21,71,28,190
0.00 0.00 0.00 34.40 0.00 0.00 34.40
0.00 0.00 0.00 -0.70 0.00 0.00 -0.70
0 0 0 0 0 0 21,70,83,190
0 0 0 0 0 0 0 0 0 0 0 0 0 21,70,83,190
0.00 0 0.00 0 0.00 0 0.00 0 0.00 0 0.00 0 35.10 21,71,28,190
0 0 0 0 0 0 0 0 0 0 0 0 0 21,71,28,190
0.00 0.00 0.00 0.00 0.00 0.00 34.40
0.00 0.00 0.00 0.00 0.00 0.00 -0.70
2,49,90,354 5,61,35,315 3,53,281 0 0 37,43,054 10,59,09,066 0 1,91,78,855 0 21,03,09,925
90,690 2,50,81,044 96,270 5,62,31,585 5,850 3,59,131 0 0 0 0 0 37,43,054 8,260 10,59,17,326 0 0 0 1,91,78,855 0 0 2,01,070 21,05,10,995
4.05 4,24,26,761 9.09 7,98,12,436 0.06 3,53,281 0.00 0 0.00 0 0.61 39,36,673 17.13 2,95,81,793 0.00 0 3.10 5,38,99,882 0.00 0 34.04 21,00,10,826
1,34,715 4,25,61,476 62,845 7,98,75,281 5,850 3,59,131 0 0 0 0 0 39,36,673 8,260 2,95,90,053 0 0 0 5,38,99,882 0 0 2,11,670 21,02,22,496
6.74 12.66 0.06 0.00 0.00 0.62 4.69 0.00 8.54 0.00 33.31
2.69 3.56 0.00 0.00 0.00 0.02 -12.44 0.00 5.44 0.00 -0.73
1,46,30,622
2,61,470
1,48,92,092
2.41
1,46,94,821
2,79,940
1,49,74,761
2.37
-0.04
12,06,76,684
1,43,27,708
13,50,04,392
21.83
12,73,19,409
1,41,45,161
14,14,64,570
22.41
0.58
79,31,359
10,19,370
89,50,729
1.45
96,77,479
6,01,870
1,02,79,349
1.63
0.18
0
0
0
0.00
0
0
0
0.00
0.00
0.51 67,34,843 4,630 67,39,473 0.01 33,500 0 33,500 0.00 975 50,100 51,075 0.78 66,17,416 1,32,117 67,49,533 0.05 0 0 0 0.00 0 0 0 0.20 67,262 0 67,262 500 0 500 0.00 27.24 16,51,46,205 1,52,13,818 18,03,60,023 61.28 37,51,57,031 1,54,25,488 39,05,82,519 3.62 2,34,19,020 0 2,34,19,020 100.00 61,57,04,241 1,54,25,488 63,11,29,729
1.07 0.01 0.01 1.07 0.00 0.00 0.01 0.00 28.58 61.89 3.71 100.00
0.56 0.00 0.01 0.29 -0.05 0.00 -0.19 0.00 1.34 0.61 0.09 0.00
31,81,986 4,630 31,86,616 33,500 0 33,500 0 0 0 47,39,159 85,835 48,24,994 2,92,566 0 2,92,566 0 0 0 12,49,030 0 12,49,030 500 0 500 15,27,35,406 1,56,99,013 16,84,34,419 36,30,45,331 1,59,00,083 37,89,45,414 2,23,69,966 0 2,23,69,966 60,24,98,487 1,59,00,083 61,83,98,570
Corporate Overview 01-48
II.
Financial Statements 125-220
Statutory Reports 49-124
Shareholding of Promoters Sl. No.
Shareholder’s Name
Shareholding at the beginning of the year i.e. 01.04.2015 No. of % of total % of Shares Shares Shares Pledged / of the encumbered Company to total shares 14,28,54,570 23.10 1.86
1
Tata Sons Limited
2 3 4 5 6
Tata Chemicals Limited 4,31,75,140 Tata Investment Corporation Limited** 2,69,00,000 Ewart Investments Limited 34,16,360 Tata Industries Limited 7,31,120 Titan Company Limited 6,000 Total 21,70,83,190
6.98 4.35 0.55 0.12 0.00 35.10
Shareholding at the end of the year % change in i.e. 31.03.2016 shareholding during the No. of % of total % of Shares year* Shares Shares of the Pledged/ Company encumbered to total shares 14,28,54,570 22.63 1.86 - 0.47
0.00 4,31,75,140 0.00 2,69,45,000 0.00 34,16,360 0.00 7,31,120 0.00 6,000 1.86 21,71,28,190
6.84 4.27 0.54 0.12 0.00 34.40
0.00 0.00 0.00 0.00 0.00 1.86
- 0.14 - 0.08 - 0.01 0.00 0.00 - 0.70
*% change in Shareholding is consequent to increase in paid up share capital arising due to allotment of shares pursuant to the amalgamation of Mount Everest Mineral Water Limited with the Company.
III.
Change in Promoters’ Shareholding (please specify, if there is no change) Sl. No Name of Shareholder
Part of Promoter Group 1 Tata Investment Corporation Ltd**
Shareholding at the beginning of the year as on 01.04.2015 No. of shares % of total shares of the Company 2,69,00,000
Date
Reason
4.35 02.07.2015 Allotment 31.03.2016 At the year end
Increase / Decrease in Shareholding No. of % of total shares shares of the Company 45,000
0.00
Cumulative Shareholding during the year No. of % of total shares shares of the Company 2,69,45,000 2,69,45,000
4.27 4.27
** Increase in Shareholding is consequent to allotment of shares pursuant to the amalgamation of Mount Everest Mineral Water Limited with the Company.
Note: Except for the above there is no change in the holding of the Promoter and/ or Promoter Group during the Financial Year 2015 -16
81
Annual Report 2015-16
iv.
Shareholding Pattern of top ten Shareholders:
(other than Directors, Promoters and holders of GDRs and ADRs): Sl. No. Name of the Shareholder
1
2
82
Lic of India Child Fortune Plus Growth Fund Lic of India Profit Plus Balanced Fund Life Insurance Corporation of India Lic of India Money Plus Growth Fund Lic of India Market Plus 1 Growth Fund Life Insurance Corporation of India Ulif002180912licflx+Mix512 Life Insurance Corporation of India
Icici Prudential Mutual Fund Icici Prudential Fmcg Fund Icici Prudential Top 100 Fund Icici Prudential Long Term Equity Fund (Tax Saving) Icici Prudential Equity Arbitrage Fund Icici Prudential Balanced Advantage Fund Icici Prudential Midcap Fund Icici Prudential Blended Plan - Plan A Icici Prudential Dynamic Plan Icici Prudential Select Large Cap Fund Icici Prudential Nifty Next 50 Index Fund Icici Prudential Nifty 100 Etf Icici Prudential Value Fund Series 1 Icici Prudential Value Fund Series 2 Icici Prudential Value Fund-Series 5 Icici Prudential Equity Income Fund Icici Prudential Growth Fund-Series 8 Icici Prudential Value Fund - Series 6 Icici Prudential Value Fund - Series 7 Icici Prudential Business Cycle Fund Series 2
•
Connect with every sip
Cumulative Shareholding during the year
Shareholding No. of shares at the beginning of the Year (01.04.2015 / end of year 31.03.2016) 31,213,954
54,416,998 15,803,894
% of total shares of the Company
5.05
Date
Reason
Increase/ % of total shares Decrease of the in shareholding Company#
01-Apr-2015 10-Apr-2015 24-Apr-2015 01-May-2015 08-May-2015 15-May-2015 15-May-2015 22-May-2015 22-May-2015 05-Jun-2015 05-Jun-2015 12-Jun-2015 24-Jul-2015 31-Jul-2015 07-Aug-2015 14-Aug-2015 21-Aug-2015 04-Sep-2015 11-Sep-2015 18-Sep-2015 25-Sep-2015
Transfer Transfer Transfer Transfer Transfer Transfer Transfer Transfer Transfer Transfer Transfer Transfer Transfer Transfer Transfer Transfer Transfer Transfer Transfer Transfer
1,136,872 1,000,000 550,000 1,037,996 1,831,062 1,527,291 586,798 300,000 450,000 1,708,461 860,348 969,351 1,379,080 1,170,321 1,200,000 132,248 810,654 1,731,690 647,221 697,231
0.18 0.16 0.09 0.17 0.30 0.25 0.09 0.05 0.07 0.28 0.14 0.16 0.22 0.19 0.19 0.02 0.13 0.28 0.10 0.11
32,350,826 33,350,826 33,900,826 34,938,822 36,769,884 38,297,175 38,883,973 39,183,973 39,633,973 41,342,434 42,202,782 43,172,133 44,551,213 45,721,534 46,921,534 47,053,782 47,864,436 49,596,126 50,243,347 50,940,578
5.13 5.28 5.37 5.54 5.83 6.07 6.16 6.21 6.28 6.55 6.69 6.84 7.06 7.24 7.43 7.46 7.58 7.86 7.96 8.07
Transfer Transfer Transfer Transfer
445,000 1,356,420 775,000 900,000
0.07 0.22 0.13 0.15
51,385,578 52,741,998 53,516,998 54,416,998
8.14 8.36 8.48 8.62
Transfer Transfer Transfer Transfer Transfer Transfer Transfer Transfer Transfer Transfer Transfer Transfer Transfer Transfer Transfer Transfer Transfer Transfer Transfer Transfer Transfer Transfer Transfer Transfer Transfer
336 -323 250,000 150 640,000 228 421,419 108 23 305 428,000 -276,000 -264,680 -506,822 -652 -4,376 -14 568,245 351 594,815 -275 343,911 -150 2,207,627 -141
0.00 0.00 0.04 0.00 0.10 0.00 0.07 0.00 0.00 0.00 0.07 -0.04 -0.04 -0.08 0.00 0.00 0.00 0.09 0.00 0.10 0.00 0.06 0.00 0.36 0.00
15,804,230 15,803,907 16,053,907 16,054,057 16,694,057 16,694,285 17,115,704 17,115,812 17,115,835 17,116,140 17,544,140 17,268,140 17,003,460 16,496,638 16,495,986 16,491,610 16,491,596 17,059,841 17,060,192 17,655,007 17,654,732 17,998,643 17,998,493 20,206,120 20,205,979
2.50 2.50 2.54 2.54 2.65 2.65 2.71 2.71 2.71 2.71 2.78 2.74 2.69 2.61 2.61 2.61 2.61 2.70 2.70 2.80 2.80 2.85 2.85 3.20 3.20
30-Sep-2015 18-Mar-2016 25-Mar-2016 8.62 31-Mar-2016 2.56 01-Apr-2015 10-Apr-2015 17-Apr-2015 24-Apr-2015 24-Apr-2015 01-May-2015 01-May-2015 08-May-2015 08-May-2015 08-May-2015 15-May-2015 22-May-2015 22-May-2015 22-May-2015 29-May-2015 29-May-2015 05-Jun-2015 05-Jun-2015 12-Jun-2015 12-Jun-2015 19-Jun-2015 19-Jun-2015 26-Jun-2015 30-Jun-2015 03-Jul-2015 10-Jul-2015
No. of % of total shares shares of the Company#
Corporate Overview 01-48
Sl. No. Name of the Shareholder
Statutory Reports 49-124
Financial Statements 125-220
Cumulative Shareholding during the year
Shareholding No. of shares at the beginning of the Year (01.04.2015 / end of year 31.03.2016)
% of total shares of the Company
Date
Reason
Increase/ % of total shares Decrease of the in shareholding Company#
17-Jul-2015 17-Jul-2015 17-Jul-2015 24-Jul-2015 24-Jul-2015 24-Jul-2015 31-Jul-2015 31-Jul-2015 07-Aug-2015 07-Aug-2015 14-Aug-2015 14-Aug-2015 21-Aug-2015 21-Aug-2015 28-Aug-2015 04-Sep-2015 04-Sep-2015 11-Sep-2015 18-Sep-2015 25-Sep-2015 30-Sep-2015 30-Sep-2015 30-Sep-2015 09-Oct-2015 16-Oct-2015 16-Oct-2015 23-Oct-2015 23-Oct-2015 30-Oct-2015 06-Nov-2015 13-Nov-2015 13-Nov-2015 20-Nov-2015 20-Nov-2015 20-Nov-2015 20-Nov-2015 27-Nov-2015 27-Nov-2015 04-Dec-2015 11-Dec-2015 18-Dec-2015 25-Dec-2015 25-Dec-2015 31-Dec-2015 31-Dec-2015 31-Dec-2015 31-Dec-2015 08-Jan-2016 08-Jan-2016 15-Jan-2016 15-Jan-2016 15-Jan-2016 15-Jan-2016
Transfer Transfer Transfer Transfer Transfer Transfer Transfer Transfer Transfer Transfer Transfer Transfer Transfer Transfer Transfer Transfer Transfer Transfer Transfer Transfer Transfer Transfer Transfer Transfer Transfer Transfer Transfer Transfer Transfer Transfer Transfer Transfer Transfer Transfer Transfer Transfer Transfer Transfer Transfer Transfer Transfer Transfer Transfer Transfer Transfer Transfer Transfer Transfer Transfer Transfer Transfer Transfer Transfer
375,503 1,195,079 -1,096 2,640 7,958 -700,000 700,000 -356 299,916 -199 74 83 74 61,448 735 -73 62,835 305 496 -264 492,468 -96 -22 -573 480,000 446 -525 -9 440 185 115,606 171 345,910 788 19,223 194,199 226 132,491 -221 -556 4,865 149 -21,560 -393,867 -477 -237,586 -197,403 -100 -2,248 -473,372 240,000 529 -129,287
0.06 0.19 0.00 0.00 0.00 -0.11 0.11 0.00 0.05 0.00 0.00 0.00 0.00 0.01 0.00 0.00 0.01 0.00 0.00 0.00 0.08 0.00 0.00 0.00 0.08 0.00 0.00 0.00 0.00 0.00 0.02 0.00 0.06 0.00 0.00 0.03 0.00 0.02 0.00 0.00 0.00 0.00 0.00 -0.06 0.00 -0.04 -0.03 0.00 0.00 -0.08 0.04 0.00 -0.02
No. of % of total shares shares of the Company#
20,581,482 21,776,561 21,775,465 21,778,105 21,786,063 21,086,063 21,786,063 21,785,707 22,085,623 22,085,424 22,085,498 22,085,581 22,085,655 22,147,103 22,147,838 22,147,765 22,210,600 22,210,905 22,211,401 22,211,137 22,703,605 22,703,509 22,703,487 22,702,914 23,182,914 23,183,360 23,182,835 23,182,826 23,183,266 23,183,451 23,299,057 23,299,228 23,645,138 23,645,926 23,665,149 23,859,348 23,859,574 23,992,065 23,991,844 23,991,288 23,996,153 23,996,302 23,974,742 23,580,875 23,580,398 23,342,812 23,145,409 23,145,309 23,143,061 22,669,689 22,909,689 22,910,218 22,780,931
3.26 3.45 3.45 3.45 3.45 3.34 3.45 3.45 3.50 3.50 3.50 3.50 3.50 3.51 3.51 3.51 3.52 3.52 3.52 3.52 3.60 3.60 3.60 3.60 3.67 3.67 3.67 3.67 3.67 3.67 3.69 3.69 3.75 3.75 3.75 3.78 3.78 3.80 3.80 3.80 3.80 3.80 3.80 3.74 3.74 3.70 3.67 3.67 3.67 3.59 3.63 3.63 3.61
83
Annual Report 2015-16
Sl. No. Name of the Shareholder
4
5
Government Pension Fund Global
National Westminster Bank Plc As Depositary Of First State Asia Pacific Fund A Sub Fund Of First State Investments Icvc
National Insurance Company Ltd
22,401,478 7,692,045
Cumulative Shareholding during the year
% of total shares of the Company
3.55 1.24
Date
Reason
22-Jan-2016 12-Feb-2016 19-Feb-2016 19-Feb-2016 19-Feb-2016 19-Feb-2016 19-Feb-2016 19-Feb-2016 26-Feb-2016 04-Mar-2016 04-Mar-2016 11-Mar-2016 18-Mar-2016 18-Mar-2016 18-Mar-2016 18-Mar-2016 18-Mar-2016 25-Mar-2016 25-Mar-2016 25-Mar-2016 31-Mar-2016 01-Apr-2015
Transfer Transfer Transfer Transfer Transfer Transfer Transfer Transfer Transfer Transfer Transfer Transfer Transfer Transfer Transfer Transfer Transfer Transfer Transfer Transfer Transfer
-393 -100,000 623,258 423 100,000 60,000 200,000 20,000 -1,211 100,000 238 -651 140 11 -480,099 -200,000 -20,000 -36,680 -183,434 -100,000 -361,055
0.00 -0.02 0.10 0.00 0.02 0.01 0.03 0.00 0.00 0.02 0.00 0.00 0.00 0.00 -0.08 -0.03 0.00 -0.01 -0.03 -0.02 -0.06
No. of % of total shares shares of the Company#
22,780,538 22,680,538 23,303,796 23,304,219 23,404,219 23,464,219 23,664,219 23,684,219 23,683,008 23,783,008 23,783,246 23,782,595 23,782,735 23,782,746 23,302,647 23,102,647 23,082,647 23,045,967 22,862,533 22,762,533 22,401,478
3.61 3.59 3.69 3.69 3.71 3.72 3.75 3.75 3.75 3.77 3.77 3.77 3.77 3.77 3.69 3.66 3.66 3.65 3.62 3.61 3.55
18-Sep-2015
Transfer
42,000
0.01
7,734,045
1.23
Transfer
98,000
0.02
7,832,045
1.24
30-Sep-2015
Transfer
100,000
0.02
7,932,045
1.26
16-Oct-2015
Transfer
55,000
0.01
7,987,045
1.27
13-Nov-2015
Transfer
45,000
0.01
8,032,045
1.27
01-Jan-2016
Transfer
70,000
0.01
8,102,045
1.28
08-Jan-2016
Transfer
130,000
0.02
8,232,045
1.30
15-Jan-2016
Transfer
80,180
0.01
8,312,225
1.32
22-Jan-2016
Transfer
519,820
0.08
8,832,045
1.40
26-Feb-2016
Transfer
-150,000
-0.02
8,682,045
1.38
8,682,045
1.38
1.38
31-Mar-2016
4,992,566
0.81
01-Apr-2015 22-May-2015
Transfer
530,781
0.09
5,523,347
0.88
19-Jun-2015
Transfer
557,399
0.09
6,080,746
0.96
28-Aug-2015
Transfer
558,920
0.09
6,639,666
1.05
26-Feb-2016
Transfer
316,843
0.05
6,956,509
1.10
04-Mar-2016
Transfer
995,858
0.16
7,952,367
1.26
7,952,367
1.26
7,952,367
1.26
31-Mar-2016
7,005,780
1.13
01-Apr-2015
1.15
Increase/ % of total shares Decrease of the in shareholding Company#
25-Sep-2015
8,682,045
7,264,780
84
Connect with every sip
Shareholding No. of shares at the beginning of the Year (01.04.2015 / end of year 31.03.2016)
3
•
10-Apr-2015
Transfer
100,000
0.02
7,105,780
1.13
01-May-2015
Transfer
100,000
0.02
7,205,780
1.14
01-Jan-2016
Transfer
-50,000
-0.01
7,155,780
1.13
08-Jan-2016
Transfer
-41,000
-0.01
7,114,780
1.13
12-Feb-2016
Transfer
150,000
0.02
7,264,780
1.15
7,264,780
1.15
31-Mar-2016
Corporate Overview 01-48
Sl. No. Name of the Shareholder
6
7
Dimensional Emerging Markets Value Fund
Uti- Unit Scheme For Charitable And Religious Trusts and ed Societies Uti- Mid Cap Fund Uti- Monthly Income Scheme Uti- Equity Fund Uti- Balanced Fund Uti- Spread Fund Uti- Retirement Benefit Pension Fund Uti- Childrens Career Balanced Plan Uti- Capital Protection Oriented Scheme - Series iv - i (1103 Days) Uti- Capital Protection Oriented Scheme - Series iv - ii (1104 Days) Uti- Capital Protection Oriented Scheme - Series iv iii (1105 Days) Uti- Capital Protection Oriented Scheme - Series v - i (1163 Days) Uti- Dual Advantage Fixed Term Fund Series i - ii (1145 Days) Uti- Capital Protection Oriented Scheme - Series v - ii (1135 Days) Uti- Dual Advantage Fixed Term Fund Series i - iv (1099 Days) Uti- Dual Advantage Fixed Term Fund Series i - v (1099 Days) Uti- Capital Protection Oriented Scheme - Series vi - i (1098 Days) Uti- Dual Advantage Fixed Term Fund Series ii - i (1998 Days) Uti- Dual Advantage Fixed Term Fund Series ii - ii (1997 Days) Uti- Dual Advantage Fixed Term Fund Series ii - iii (1998 Days) Uti- Capital Protection Oriented Scheme - Series vi - iii (1098 Days) Uti-Dual Advantage Fixed Term Fund Series ii - iv (1997 Days) Uti- Capital Protection Oriented Scheme - Series vii - i (1098 Days) Uti- Dual Advantage Fixed Term Fund Series ii - v (1997 Days)
Statutory Reports 49-124
Financial Statements 125-220
Cumulative Shareholding during the year
Shareholding No. of shares at the beginning of the Year (01.04.2015 / end of year 31.03.2016) 5,996,268
6,632,236 2,727,295
% of total shares of the Company
Date
01-Apr-2015 10-Apr-2015 01-May-2015 15-May-2015 22-May-2015 29-May-2015 30-Oct-2015 06-Nov-2015 13-Nov-2015 20-Nov-2015 25-Dec-2015 31-Dec-2015 08-Jan-2016 15-Jan-2016 22-Jan-2016 1.05 31-Mar-2016 0.44 01-Apr-2015 10-Apr-2015 10-Apr-2015 24-Apr-2015 24-Apr-2015 15-May-2015 05-Jun-2015 05-Jun-2015 12-Jun-2015 12-Jun-2015 19-Jun-2015 03-Jul-2015 10-Jul-2015 17-Jul-2015 17-Jul-2015 21-Aug-2015 21-Aug-2015 28-Aug-2015 28-Aug-2015 28-Aug-2015 28-Aug-2015 28-Aug-2015 28-Aug-2015 04-Sep-2015 04-Sep-2015 04-Sep-2015 04-Sep-2015 04-Sep-2015 04-Sep-2015 04-Sep-2015 04-Sep-2015 04-Sep-2015 04-Sep-2015 04-Sep-2015 04-Sep-2015 11-Sep-2015 11-Sep-2015 11-Sep-2015
Reason
Increase/ % of total shares Decrease of the in shareholding Company#
No. of % of total shares shares of the Company#
0.97
Transfer Transfer Transfer Transfer Transfer Transfer Transfer Transfer Transfer Transfer Transfer Transfer Transfer Transfer
26,677 21,370 185,475 66,047 28,193 13,871 9,979 12,086 11,767 58,938 39,669 24,344 93,844 43,708
0.00 0.00 0.03 0.01 0.00 0.00 0.00 0.00 0.00 0.01 0.01 0.00 0.02 0.01
6,022,945 6,044,315 6,229,790 6,295,837 6,324,030 6,337,901 6,347,880 6,359,966 6,371,733 6,430,671 6,470,340 6,494,684 6,588,528 6,632,236 6,632,236
0.95 0.96 0.99 1.00 1.00 1.00 1.01 1.01 1.01 1.02 1.03 1.03 1.04 1.05 1.05
Transfer Transfer Transfer Transfer Transfer Transfer Transfer Transfer Transfer Transfer Transfer Transfer Transfer Transfer Transfer Transfer Transfer Transfer Transfer Transfer Transfer Transfer Transfer Transfer Transfer Transfer Transfer Transfer Transfer Transfer Transfer Transfer Transfer Transfer Transfer Transfer Transfer
147,000 6,000 81,000 50,000 170,000 61,000 -56,000 175,000 175,000 100,000 365,432 155,000 125,000 173,538 23,163 15,442 40,000 162,600 155,400 215,000 201,176 12,855 80,414 144,000 46,841 255,000 330,000 58,091 36,241 24,641 13,649 10,205 13,475 13,939 405,000 17,292 53,869
0.02 0.00 0.01 0.01 0.03 0.01 -0.01 0.03 0.03 0.02 0.06 0.03 0.02 0.03 0.00 0.00 0.01 0.03 0.03 0.03 0.03 0.00 0.01 0.02 0.01 0.04 0.05 0.01 0.01 0.00 0.00 0.00 0.00 0.00 0.07 0.00 0.01
2,874,295 2,880,295 2,961,295 3,011,295 3,181,295 3,242,295 3,186,295 3,361,295 3,536,295 3,636,295 4,001,727 4,156,727 4,281,727 4,455,265 4,478,428 4,493,870 4,533,870 4,696,470 4,851,870 5,066,870 5,268,046 5,280,901 5,361,315 5,505,315 5,552,156 5,807,156 6,137,156 6,195,247 6,231,488 6,256,129 6,269,778 6,279,983 6,293,458 6,307,397 6,712,397 6,729,689 6,783,558
0.00 0.00 0.27 0.01 0.30 0.07 0.00 0.32 0.10 0.12 0.38 0.41 0.43 0.14 0.43 0.15 0.01 0.46 0.17 0.03 0.03 0.00 0.02 0.48 0.01 0.07 0.08 0.01 0.01 0.00 0.00 0.00 0.00 0.00 0.14 0.00 0.01
85
Annual Report 2015-16
Sl. No. Name of the Shareholder
9
10
Platinum International Brands Fund
General Insurance Corporation Of India
The New India Assurance Company Limited
Cumulative Shareholding during the year
% of total shares of the Company
Date
6,445,448 6,380,060
18-Sep-2015 18-Sep-2015 18-Sep-2015 25-Sep-2015 02-Oct-2015 02-Oct-2015 09-Oct-2015 09-Oct-2015 16-Oct-2015 16-Oct-2015 13-Nov-2015 11-Dec-2015 11-Dec-2015 18-Dec-2015 08-Jan-2016 15-Jan-2016 15-Jan-2016 15-Jan-2016 22-Jan-2016 22-Jan-2016 19-Feb-2016 19-Feb-2016 18-Mar-2016 1.02 31-Mar-2016 1.03 01-Apr-2015
6,380,060
1.01
5,202,120
0.84
31-Mar-2016
Increase/ % of total shares Decrease of the in shareholding Company#
Transfer 130 Transfer 86 Transfer 50,000 Transfer 100,000 Transfer 100,000 Transfer 50,000 Transfer 165,000 Transfer 50,000 Transfer 16,189 Transfer 55,000 Transfer 75,000 Transfer 50,000 Transfer 230,000 Transfer 9,419 Transfer 45,000 Transfer -250,000 Transfer 6,584 Transfer 36,764 Transfer -1,175,466 Transfer 10,579 Transfer 15,000 Transfer 9,544 Transfer 13,061 No Movement during the year
0.00 0.00 0.01 0.02 0.02 0.01 0.03 0.01 0.00 0.01 0.01 0.01 0.04 0.00 0.01 -0.04 0.00 0.01 -0.19 0.00 0.00 0.00 0.00
No. of % of total shares shares of the Company#
6,783,688 6,783,774 6,833,774 6,933,774 7,033,774 7,083,774 7,248,774 7,298,774 7,314,963 7,369,963 7,444,963 7,494,963 7,724,963 7,734,382 7,779,382 7,529,382 7,535,966 7,572,730 6,397,264 6,407,843 6,422,843 6,432,387 6,445,448 6,445,448
0.48 0.17 0.15 0.10 0.16 0.02 0.19 0.11 0.02 0.12 0.18 0.49 0.22 0.00 0.23 0.19 0.00 0.01 0.00 0.00 0.01 0.00 0.00 1.02
6,380,060
1.01
0
01-Apr-2015 Transfer
75,000
0.01
5,277,120
0.84
24-Apr-2015
Transfer
170,000
0.03
5,447,120
0.86
01-May-2015
Transfer
255,000
0.04
5,702,120
0.90
08-May-2015
Transfer
75,000
0.01
5,777,120
0.92
5,777,120
0.92
0.92
31-Mar-2016
5,318,673
0.86
01-Apr-2015
0.91
Reason
17-Apr-2015
5,777,120
5,747,945
86
Connect with every sip
Shareholding No. of shares at the beginning of the Year (01.04.2015 / end of year 31.03.2016)
8
•
09-Oct-2015
Transfer
166,772
0.03
5,485,445
0.87
16-Oct-2015
Transfer
125,000
0.02
5,610,445
0.89
23-Oct-2015
Transfer
112,500
0.02
5,722,945
0.91
06-Nov-2015
Transfer
25,000
0.00
5,747,945
0.91
5,747,945
0.91
31-Mar-2016
Corporate Overview 01-48
Sl. No. Name of the Shareholder
11
NPS Trust- A/C Lic Pension Fund Scheme Central Govt. NPS Trust- A/C UTI Retirement Solutions Pension Fund Scheme - Central Govt. NPS Trust- A/C UTI Retirement Solutions Pension Fund Scheme E - Tier I NPS Trust- A/C Icici Prudential Pension Fund Scheme E - Tier I NPS Trust- A/C Lic Pension Fund Scheme - State Govt. NPS Trust- A/C UTI Retirement Solutions Pension Fund Scheme - State Govt. NPS Trust- A/C Icici Prudential Pension Fund Scheme E - Tier Ii NPS Trust A/C - Lic Pension Fund Limited - NPS Lite Scheme - Govt. Pattern NPS Trust A/C - UTI Retirement Solutions Limited - NPS Lite Scheme -Govt. Pattern NPS Trust - A/C Lic Pension Fund Scheme Corporate Cg NPS Trust- A/C Lic Pension Fund Scheme E Tier I NPS Trust- A/C Lic Pension Fund Scheme E Tier Ii NPS Trust - A/C UTI Retirement Solutions Ltd Scheme - Atal Pension Yojana (Apy) NPS Trust - A/C Lic Pension Fund Scheme - Atal Pension Yojana (Apy)
Statutory Reports 49-124
Financial Statements 125-220
Cumulative Shareholding during the year
Shareholding No. of shares at the beginning of the Year (01.04.2015 / end of year 31.03.2016) 2,114,996
% of total shares of the Company
0.34
Date
Reason
01-Apr-2015 08-May-2015 08-May-2015 08-May-2015 08-May-2015 15-May-2015 15-May-2015 05-Jun-2015 05-Jun-2015 12-Jun-2015 12-Jun-2015 19-Jun-2015 19-Jun-2015 19-Jun-2015 17-Jul-2015 17-Jul-2015 24-Jul-2015 24-Jul-2015 21-Aug-2015 21-Aug-2015 21-Aug-2015 28-Aug-2015 28-Aug-2015 28-Aug-2015 28-Aug-2015 04-Sep-2015 04-Sep-2015 04-Sep-2015 04-Sep-2015 11-Sep-2015 11-Sep-2015 11-Sep-2015 30-Sep-2015 30-Sep-2015 02-Oct-2015 02-Oct-2015 02-Oct-2015 09-Oct-2015 09-Oct-2015 09-Oct-2015 16-Oct-2015 23-Oct-2015 23-Oct-2015 30-Oct-2015 30-Oct-2015 06-Nov-2015 06-Nov-2015 13-Nov-2015 13-Nov-2015 20-Nov-2015 20-Nov-2015 27-Nov-2015 27-Nov-2015
Transfer Transfer Transfer Transfer Transfer Transfer Transfer Transfer Transfer Transfer Transfer Transfer Transfer Transfer Transfer Transfer Transfer Transfer Transfer Transfer Transfer Transfer Transfer Transfer Transfer Transfer Transfer Transfer Transfer Transfer Transfer Transfer Transfer Transfer Transfer Transfer Transfer Transfer Transfer Transfer Transfer Transfer Transfer Transfer Transfer Transfer Transfer Transfer Transfer Transfer Transfer Transfer
Increase/ % of total shares Decrease of the in shareholding Company#
15,000 25,000 1,000 2,500 5,000 10,000 10,000 10,000 10,000 10,000 16,900 23,470 1,000 15,000 15,000 72,000 720 150,000 225,000 1,500 482,000 657,000 15,000 5,540 275,000 375,000 9,000 5,000 156,000 227,000 8,000 12,314 902 6,477 670 4,000 7,500 400 199 212 440 32 127 10 143 6 279 8 345 -47 116 4
0.00 0.00 0.00 0.00 0.00 0.00 0.00 0.00 0.00 0.00 0.00 0.00 0.00 0.00 0.00 0.01 0.00 0.02 0.04 0.00 0.08 0.11 0.00 0.00 0.04 0.06 0.00 0.00 0.03 0.04 0.00 0.00 0.00 0.00 0.00 0.00 0.00 0.00 0.00 0.00 0.00 0.00 0.00 0.00 0.00 0.00 0.00 0.00 0.00 0.00 0.00 0.00
No. of % of total shares shares of the Company#
2,129,996 2,154,996 2,155,996 2,158,496 2,163,496 2,173,496 2,183,496 2,193,496 2,203,496 2,213,496 2,230,396 2,253,866 2,254,866 2,269,866 2,284,866 2,356,866 2,357,586 2,507,586 2,732,586 2,734,086 3,216,086 3,873,086 3,888,086 3,893,626 4,168,626 4,543,626 4,552,626 4,557,626 4,713,626 4,940,626 4,948,626 4,960,940 4,961,842 4,968,319 4,968,989 4,972,989 4,980,489 4,980,889 4,981,088 4,981,300 4,981,740 4,981,772 4,981,899 4,981,909 4,982,052 4,982,058 4,982,337 4,982,345 4,982,690 4,982,643 4,982,759 4,982,763
0.34 0.34 0.34 0.34 0.34 0.34 0.35 0.35 0.35 0.35 0.35 0.36 0.36 0.36 0.36 0.37 0.37 0.40 0.43 0.43 0.51 0.61 0.62 0.62 0.66 0.72 0.72 0.72 0.75 0.78 0.78 0.79 0.79 0.79 0.79 0.79 0.79 0.79 0.79 0.79 0.79 0.79 0.79 0.79 0.79 0.79 0.79 0.79 0.79 0.79 0.79 0.79
87
Annual Report 2015-16
Sl. No. Name of the Shareholder
Retail Employees Superannuation Pty. Limited As Trustee For Retail Employees Superannuation Trust
% of total shares of the Company
5,305,346
0.84
2,821,048
0.46
4,759,014
88
Connect with every sip
Cumulative Shareholding during the year
Shareholding No. of shares at the beginning of the Year (01.04.2015 / end of year 31.03.2016)
12
•
0.75
Date
Reason
04-Dec-2015 04-Dec-2015 11-Dec-2015 11-Dec-2015 11-Dec-2015 11-Dec-2015 11-Dec-2015 11-Dec-2015 18-Dec-2015 18-Dec-2015 18-Dec-2015 18-Dec-2015 18-Dec-2015 18-Dec-2015 25-Dec-2015 25-Dec-2015 31-Dec-2015 31-Dec-2015 01-Jan-2016 01-Jan-2016 08-Jan-2016 08-Jan-2016 15-Jan-2016 15-Jan-2016 22-Jan-2016 22-Jan-2016 29-Jan-2016 29-Jan-2016 05-Feb-2016 05-Feb-2016 12-Feb-2016 12-Feb-2016 12-Feb-2016 12-Feb-2016 12-Feb-2016 12-Feb-2016 12-Feb-2016 19-Feb-2016 19-Feb-2016 26-Feb-2016 26-Feb-2016 26-Feb-2016 26-Feb-2016 26-Feb-2016 26-Feb-2016 31-Mar-2016
Transfer Transfer Transfer Transfer Transfer Transfer Transfer Transfer Transfer Transfer Transfer Transfer Transfer Transfer Transfer Transfer Transfer Transfer Transfer Transfer Transfer Transfer Transfer Transfer Transfer Transfer Transfer Transfer Transfer Transfer Transfer Transfer Transfer Transfer Transfer Transfer Transfer Transfer Transfer Transfer Transfer Transfer Transfer Transfer Transfer Transfer
Increase/ % of total shares Decrease of the in shareholding Company#
181 8 20,000 379 10,000 17 3,000 3,000 25,000 259 25,000 8 3,000 3,000 155 13 196 12 49 3 389 20 503 18 533 31 311 23 644 23 693 20,000 39 5,000 5,000 100 5,000 574 14 94,000 9,400 655 94,000 27 9,400 -17,094
0.00 0.00 0.00 0.00 0.00 0.00 0.00 0.00 0.00 0.00 0.00 0.00 0.00 0.00 0.00 0.00 0.00 0.00 0.00 0.00 0.00 0.00 0.00 0.00 0.00 0.00 0.00 0.00 0.00 0.00 0.00 0.00 0.00 0.00 0.00 0.00 0.00 0.00 0.00 0.02 0.00 0.00 0.02 0.00 0.00 0.00
No. of % of total shares shares of the Company#
4,982,944 4,982,952 5,002,952 5,003,331 5,013,331 5,013,348 5,016,348 5,019,348 5,044,348 5,044,607 5,069,607 5,069,615 5,072,615 5,075,615 5,075,770 5,075,783 5,075,979 5,075,991 5,076,040 5,076,043 5,076,432 5,076,452 5,076,955 5,076,973 5,077,506 5,077,537 5,077,848 5,077,871 5,078,515 5,078,538 5,079,231 5,099,231 5,099,270 5,104,270 5,109,270 5,109,370 5,114,370 5,114,944 5,114,958 5,208,958 5,218,358 5,219,013 5,313,013 5,313,040 5,322,440 5,305,346
0.79 0.79 0.79 0.79 0.79 0.79 0.79 0.80 0.80 0.80 0.80 0.80 0.80 0.80 0.80 0.80 0.80 0.80 0.80 0.80 0.80 0.80 0.80 0.80 0.80 0.80 0.80 0.80 0.80 0.80 0.80 0.81 0.81 0.81 0.81 0.81 0.81 0.81 0.81 0.83 0.83 0.83 0.84 0.84 0.84 0.84
01-Apr-2015 28-Aug-2015
Transfer
341,675
0.06
3,162,723
0.50
23-Oct-2015
Transfer
684,703
0.11
3,847,426
0.61
11-Dec-2015
Transfer
796,688
0.13
4,644,114
0.74
18-Dec-2015
Transfer
114,900
0.02
4,759,014
0.75
4,759,014
0.75
31-Mar-2016
Corporate Overview 01-48
Sl. No. Name of the Shareholder
14
15
16
The Scottish Oriental Smaller Companies Trust plc
The Emerging Markets Small Cap Series of The DFA Investment Trust Company
Emerging Markets Core Equity Portfolio (The Portfolio) of Dfa Investment Dimensions Group Inc. (Dfaidg)
ICICI Lombard General Insurance Company Ltd.
Cumulative Shareholding during the year
Shareholding No. of shares at the beginning of the Year (01.04.2015 / end of year 31.03.2016)
13
Financial Statements 125-220
Statutory Reports 49-124
% of total shares of the Company
4,221,438
0.68
4,221,438
0.67
2,733,817
0.44
Date
01-Apr-2015 No 31-Mar-2016 Movement during the year
0
No. of % of total shares shares of the Company#
4,221,438
0.68
4,221,438
0.67
01-Apr-2015 Transfer
62,402
0.01
2,796,219
0.44
17-Apr-2015
Transfer
36,121
0.01
2,832,340
0.45
24-Apr-2015
Transfer
184,053
0.03
3,016,393
0.48
01-May-2015
Transfer
101,362
0.02
3,117,755
0.49
08-May-2015
Transfer
216,906
0.04
3,334,661
0.53
15-May-2015
Transfer
10,569
0.00
3,345,230
0.53
22-May-2015
Transfer
71,869
0.01
3,417,099
0.54
30-Sep-2015
Transfer
23,945
0.00
3,441,044
0.55
02-Oct-2015
Transfer
20,479
0.00
3,461,523
0.55
16-Oct-2015
Transfer
19,281
0.00
3,480,804
0.55
3,480,804
0.55
0.55
31-Mar-2016
27,13,836
0.44
1-Apr-15 1-May-15
Transfer
90,771
0.01
28,04,607
0.44
17-Jul-15
Transfer
93,047
0.02
28,97,654
0.46
28-Aug-15
Transfer
-1,79,431
-0.03
27,18,223
0.43
16-Oct-15
Transfer
36,901
0.01
27,55,124
0.44
23-Oct-15
Transfer
50,674
0.01
28,05,798
0.44
30-Oct-15
Transfer
26,160
0
28,31,958
0.45
6-Nov-15
Transfer
9,525
0
28,41,483
0.45
22-Jan-16
Transfer
24,003
0
28,65,486
0.45
29-Jan-16
Transfer
1,53,290
0.02
30,18,776
0.48
5-Feb-16
Transfer
38,358
0.01
30,57,134
0.48
12-Feb-16
Transfer
47,597
0.01
31,04,731
0.49
26-Feb-16
Transfer
1,12,034
0.02
32,16,765
0.51
4-Mar-16
Transfer
44,592
0.01
32,61,357
0.52
31-Mar-16
0
0.00
01-Apr-2015
0.49
Increase/ % of total shares Decrease of the in shareholding Company#
10-Apr-2015
3,480,804
3,080,000
Reason
32,61,357
0.52
32,61,357
0.52
12-Jun-2015
Transfer
200,000
0.03
200,000
0.03
03-Jul-2015
Transfer
100,000
0.02
300,000
0.05
21-Aug-2015
Transfer
50,000
0.01
350,000
0.06
28-Aug-2015
Transfer
50,000
0.01
400,000
0.06
04-Sep-2015
Transfer
1,795,000
0.29
2,195,000
0.35
11-Sep-2015
Transfer
305,000
0.05
2,500,000
0.40
29-Jan-2016
Transfer
25,000
0.00
2,525,000
0.40
05-Feb-2016
Transfer
50,000
0.01
2,575,000
0.41
12-Feb-2016
Transfer
75,000
0.01
2,650,000
0.42
19-Feb-2016
Transfer
200,000
0.03
2,850,000
0.45
04-Mar-2016
Transfer
230,000
0.04
3,080,000
0.49
3,080,000
0.49
31-Mar-2016
89
Annual Report 2015-16
Sl. No. Name of the Shareholder
17
18
19
20
90
JM Financial Mutual Fund - JM Arbitrage Advantage Fund
First State Investments (Hongkong) Limited A/C First State Indian Subcontinent Fund
HDFC Standard Life Insurance Company Limited
Citigroup Global Markets Mauritius Private Limited
•
Connect with every sip
Cumulative Shareholding during the year
Shareholding No. of shares at the beginning of the Year (01.04.2015 / end of year 31.03.2016) 2,084,000
2,784,000 3,588,131
2,757,766 575,113
500,000 6,266,811
% of total shares of the Company
0.34
0.44 0.58
0.44 0.09
0.08 1.01
Date
01-Apr-2015 24-Apr-2015 01-May-2015 08-May-2015 19-Jun-2015 26-Jun-2015 30-Jun-2015 04-Sep-2015 18-Sep-2015 30-Oct-2015 11-Dec-2015 18-Dec-2015 12-Feb-2016 04-Mar-2016 18-Mar-2016 25-Mar-2016 31-Mar-2016 01-Apr-2015 01-May-2015 28-Aug-2015 04-Sep-2015 31-Mar-2016 01-Apr-2015 10-Apr-2015 08-May-2015 19-Jun-2015 18-Sep-2015 31-Dec-2015 31-Mar-2016 01-Apr-2015
Reason
Transfer Transfer Transfer Transfer Transfer Transfer Transfer Transfer Transfer Transfer Transfer Transfer Transfer Transfer Transfer
Increase/ % of total shares Decrease of the in shareholding Company#
No. of % of total shares shares of the Company#
160,000 354,000 252,000 4,000 130,000 188,000 400,000 -98,000 -2,000 -252,000 -96,000 -268,000 136,000 -64,000 -144,000
0.03 0.06 0.04 0.00 0.02 0.03 0.06 -0.02 0.00 -0.04 -0.02 -0.04 0.02 -0.01 -0.02
2,244,000 2,598,000 2,850,000 2,854,000 2,984,000 3,172,000 3,572,000 3,474,000 3,472,000 3,220,000 3,124,000 2,856,000 2,992,000 2,928,000 2,784,000 2,784,000
0.36 0.41 0.45 0.45 0.47 0.50 0.57 0.55 0.55 0.51 0.49 0.45 0.47 0.46 0.44 0.44
Transfer 391,711 Transfer -1,086,825 Transfer -135,251
0.06 -0.18 -0.02
3,979,842 2,893,017 2,757,766 2,757,766
0.63 0.46 0.44 0.44
Transfer Transfer Transfer Transfer Transfer
20 26 9 -168 -75,000
0.00 0.00 0.00 0.00 -0.01
575,133 575,159 575,168 575,000 500,000 500,000
0.09 0.09 0.09 0.09 0.08 0.08
17-Apr-2015
Transfer
544,500
0.09
6,811,311
1.08
24-Apr-2015
Transfer
-42,000
-0.01
6,769,311
1.07
01-May-2015
Transfer
-119,311
-0.02
6,650,000
1.05
08-May-2015
Transfer
-118,000
-0.02
6,532,000
1.03
15-May-2015
Transfer
-36,000
-0.01
6,496,000
1.03
29-May-2015
Transfer
-450,000
-0.07
6,046,000
0.96
05-Jun-2015
Transfer
-564,000
-0.09
5,482,000
0.87
12-Jun-2015
Transfer
-790,000
-0.13
4,692,000
0.74
26-Jun-2015
Transfer
-28,000
0.00
4,664,000
0.74
28-Aug-2015
Transfer -1,428,000
-0.23
3,236,000
0.51
04-Sep-2015
Transfer
-184,000
-0.03
3,052,000
0.48
11-Sep-2015
Transfer
-124,000
-0.02
2,928,000
0.46
18-Sep-2015
Transfer
-158,000
-0.03
2,770,000
0.44
25-Sep-2015
Transfer
-902,000
-0.15
1,868,000
0.30
30-Sep-2015
Transfer
-194,000
-0.03
1,674,000
0.27
09-Oct-2015
Transfer
-735,200
-0.12
938,800
0.15
09-Oct-2015
Transfer
417,200
0.07
1,356,000
0.21
16-Oct-2015
Transfer
-8,000
0.00
1,348,000
0.21
30-Oct-2015
Transfer
-700,000
-0.11
648,000
0.10
Corporate Overview 01-48
Sl. No. Name of the Shareholder
Merrill Lynch Capital Markets Espana S.A. S.V.
Financial Statements 125-220
Cumulative Shareholding during the year
Shareholding No. of shares at the beginning of the Year (01.04.2015 / end of year 31.03.2016)
21
Statutory Reports 49-124
56,000 4,818,644
0
% of total shares of the Company
Increase/ % of total shares Decrease of the in shareholding Company#
No. of % of total shares shares of the Company#
Date
Reason
04-Dec-2015 11-Dec-2015 18-Dec-2015 18-Dec-2015 08-Jan-2016 29-Jan-2016 29-Jan-2016 18-Mar-2016 25-Mar-2016 0.01 31-Mar-2016 0.78 01-Apr-2015 10-Apr-2015 17-Apr-2015 24-Apr-2015 01-May-2015 08-May-2015 15-May-2015 22-May-2015 29-May-2015 05-Jun-2015 19-Jun-2015 26-Jun-2015 30-Jun-2015 03-Jul-2015 10-Jul-2015 10-Jul-2015 17-Jul-2015 24-Jul-2015 24-Jul-2015 31-Jul-2015 31-Jul-2015 07-Aug-2015 21-Aug-2015 04-Sep-2015 30-Sep-2015 18-Dec-2015 25-Dec-2015 08-Jan-2016 15-Jan-2016 05-Feb-2016 12-Feb-2016 19-Feb-2016 0.00 31-Mar-2016
Transfer Transfer Transfer Transfer Transfer Transfer Transfer Transfer Transfer
-24,000 -152,000 -48,000 -120,000 84,000 -266,800 -121,200 17,700 38,300
0.00 -0.02 -0.01 -0.02 0.01 -0.04 -0.02 0.00 0.01
624,000 472,000 424,000 304,000 388,000 121,200 0 17,700 56,000 56,000
0.10 0.07 0.07 0.05 0.06 0.02 0.00 0.00 0.01 0.01
Transfer Transfer Transfer Transfer Transfer Transfer Transfer Transfer Transfer Transfer Transfer Transfer Transfer Transfer Transfer Transfer Transfer Transfer Transfer Transfer Transfer Transfer Transfer Transfer Transfer Transfer Transfer Transfer Transfer Transfer Transfer Transfer
78,000 448,135 68,000 2,710 -450,000 -688,000 -134,365 -44,690 -1,935 -539,164 -503,000 -123,000 -998,000 -483,000 210,263 -718,000 -293,000 -224,000 -93,171 -278,829 -53,598 120,000 -94,000 -26,000 56,248 47,355 -27,214 -18,744 -57,645 8,000 -8,000
0.01 0.07 0.01 0.00 -0.07 -0.11 -0.02 -0.01 0.00 -0.09 -0.08 -0.02 -0.16 -0.08 0.03 -0.12 -0.05 -0.04 -0.02 -0.05 -0.01 0.02 -0.02 0.00 0.01 0.01 0.00 0.00 -0.01 0.00 0.00
4,896,644 5,344,779 5,412,779 5,415,489 4,965,489 4,277,489 4,143,124 4,098,434 4,096,499 3,557,335 3,054,335 2,931,335 1,933,335 1,450,335 1,660,598 942,598 649,598 425,598 332,427 53,598 0 120,000 26,000 0 56,248 103,603 76,389 57,645 0 8,000 0 0
0.78 0.85 0.86 0.86 0.79 0.68 0.66 0.65 0.65 0.56 0.48 0.46 0.31 0.23 0.26 0.15 0.10 0.07 0.05 0.01 0.00 0.02 0.00 0.00 0.01 0.02 0.01 0.01 0.00 0.00 0.00 0.00
Shareholding is consolidated based on Permanent Number (PAN) of the Shareholder.
# Based on the increased paid up equity capital consequent to allotment of new shares pursuant to the amalgamation of Mount Everest Mineral Water Limited with the Company. 91
Annual Report 2015-16
(v)
•
Shareholding of Directors and Key Managerial Personnel: Sl. Name of the Directors No and/ or KMP
1.
Mr. Cyrus P Mistry (Chairman)
Date Reason Increase / Decrease Cumulative Shareholding at the in Shareholding Shareholding during beginning of the year the year as on 01.04.2015 % of total No. of % of total No. of No. of % of total shares shares of the shares shares of the shares shares of the Company Company Company 33,000 0.01 No Movement during the financial year 2015-16 33,000 0.01 31.03.2016
2.
Mr. V. Madan Company Secretary
0
0.00
At the year end 02.07.2015 Allotment 31.03.2016
Connect with every sip
112
0.00
At the year end
33,000
0.01
112
0.00
112
0.00
No other Director and Key Managerial Personnel of the Company holds shares in the Company.
V. INDEBTEDNESS
Indebtedness of the Company including interest outstanding/accrued but not due for payment Rs. in Crores Secured Loans Unsecured Loans excluding deposits
Deposits
Total Indebtedness
72.24
-
477.50
Indebtedness at the beginning of the financial year i)
Principal Amount
ii)
Interest due but not paid
iii)
Interest accrued but not due
Total (i+ii+iii)
405.26 -
-
-
-
4.30
0.03
-
4.33
409.56
72.27
-
481.83
-
750.00
-
750.00
Change in Indebtedness during the financial year • Addition • Reduction Net Change
27.53
822.27
-
849.80
(27.53)
(72.27)
-
(99.80)
377.61
-
-
377.61
Indebtedness at the end of the financial year i)
Principal Amount
ii)
Interest due but not paid
iii)
Interest accrued but not due
Total (i+ii+iii)
92
-
-
-
-
4.42
-
-
4.42
382.03
-
-
382.03
Corporate Overview 01-48
Statutory Reports 49-124
VI.
REMUNERATION OF DIRECTORS AND KEY MANAGERIAL PERSONNEL:
A.
Remuneration to Managing Director, Whole-time Directors and/or Manager:
Financial Statements 125-220
Rs. in Lakhs Sl. No.
Particulars of Remuneration
1
Gross salary
Name of MD/WTD/Manager L. KrishnaKumar (Executive Director)
Ajoy Misra (Managing Director) (a)
Salary as per provisions contained in Section 17(1) of the Income-tax Act, 1961
188.36
169.10
357.46
(b)
Value of perquisites u/s 17(2) of the Income-tax Act, 1961
66.52
60.25
126.77
(c)
Profits in lieu of Salary under Section 17(3) of the Income- tax Act, 1961
-
-
-
2
Stock Option
-
-
-
3
Sweat Equity
-
-
-
4
Commission - as % of profit - others-specify
-
-
-
26.94
22.47
49.41
281.82
251.82
533.64
-
-
4,033.66
65.35
42.39
107.74
5
Others (contribution to PF, Gratuity and Superannuation) Total Ceiling as per the Act Payment from overseas subsidiary
B.
Total Amount
Remuneration to other Directors: Sl No. Particulars of Remuneration
1
2
Rs. in Lakhs
Mr. Mrs. M Cyrus P Srinivasan Mistry
Independent Directors Fee for attending board/ committee meetings Commission Others, please specify Total (1) Other Non-Executive Directors Fee for attending board/ 2.20 committee meetings Commission Others, please specify Total (2) 2.20 Total (1+2) 2.20 Total Managerial Remuneration Overall Ceiling as per the Act
Mr. Mr. V. Analjit Leeladhar Singh
Name of Directors Mrs. Mr. Ranjana Darius Kumar Pandole
Mrs. Ireena Vittal
Mr. S. Santhanakrishnan
Mr. Harish Bhat
Total Amount
1.70
0.60
7.85
6.30
5.55
4.35
-
-
26.35
11.00 12.70
4.00 4.60
59.00 66.85
45.00 51.30
39.00 44.55
28.00 32.35
-
-
186.00 212.35
-
-
-
-
-
-
3.85
3.65
9.70
12.70
4.60
66.85
51.30
44.55
32.35
28.00 31.85 31.85
3.65 3.65
28.00 37.70 250.05 250.05 403.37
93
Annual Report 2015-16
C.
•
Connect with every sip
Remuneration to Key Managerial Personnel other than Md/Manager/Wtd Sl Particulars of Remuneration Key Managerial Personnel No. John Jacob V. Madan 1
Chief Financial Officer
Gross salary
Rs. in Lakhs Total
Company Secretary
2
Salary as per provisions contained in Section 17(1) of the Income-tax Act, 1961 (b) Value of perquisites u/s 17(2) of the Income-tax Act, 1961 (c) Profits in lieu of Salary under Section 17(3) of the Income-tax Act, 1961 Stock Option
3
Sweat Equity
-
-
-
4
Commission
(a)
5
97.26
75.10
172.36
33.19
25.43
58.62
-
-
-
-
-
-
-
-
-
-
as % of profit
-
-
-
-
others
-
-
-
13.31
10.44
23.75
143.76
110.97
254.73
Others (contribution to PF, Gratuity and Superannuation) Total
VII. PENALTIES / PUNISHMENT/ COMPOUNDING OF OFFENCES Type
Section of the Companies Act
A. COMPANY Penalty Punishment Compounding B. DIRECTORS Penalty Punishment Compounding C. OTHER OFFICERS IN DEFAULT Penalty Punishment Compounding
Brief Description
Details of Penalty / Punishment/ Compounding fees imposed
Authority [RD / NCLT/ COURT]
Appeal made, if any (give Details)
NIL
On behalf of the Board of Directors
Mumbai 24th May 2016
94
Cyrus P Mistry Chairman
Corporate Overview 01-48
Statutory Reports 49-124
Financial Statements 125-220
Annexure 6 to Directors’ Report Conservation of Energy, Technology Absorption, Foreign Exchange Earnings and Outgo A.
Conservation of Energy
Energy conservation measures taken during 2015-16
i.
Steps taken or impact on conservation of energy:
Pullivasal and Periakanal Estates
•
Installation of Tuflite sheets (translucent fiber-glass sheets) in labour line units and additional usage of CFL bulbs
Tetley Cochin Division
•
Installation of low wattage LED light fixers in the plant
•
Installation of turbine air ventilators
following initiatives during the year 2016-17, at an approximate additional investment of around Rs. 118 Lakhs:
•
Installation of Auto Start Delta convertor for some of the heavy duty motors to reduce power consumption
•
Phase wise replacement of heavy duty motors with energy efficient ones
•
Plant lightings up gradation using the latest LED lighting
Above investment is expected to generate an annual incremental savings of Rs. 5 Lakhs.
The following initiatives are proposed to be taken at the packeting centres during 2016-17:
•
Installation of solar system and KVR capacitor to improve power factor
•
Installation of LED lights
•
Replacement of vacuum conveying system with electrically operated vacuum conveying system to reduce the load on compressors
•
Installation of turbine ventilation system
B.
Technology Absorption
(i)
Instant Tea Division, Munnar
•
Replacement of old metal halide & sodium vapour lamps with energy efficient LED electrical fittings
•
Replacement of old Thermal Relays with electronic type relays for critical motors
Packeting Centres
•
New blending line resulting in reduced usage of motor
•
Installation of additional energy efficient LED lights
•
ii.
Steps taken by the Company for utilising alternate sources of energy:
iii.
Installation of Turbine ventilators with transparent FRP sheet for improved air change
The Company has resorted to usage of firewood, own generation and solar sources in addition to electricity purchase Capital investment on Energy Conservation Equipment: The Instant Tea Division will be taking up the
Efforts made towards technology absorption: The Company has been engaging with various companies and Research Institutes for technical collaborations for process improvement, product development, packaging development and analytical . Technical discussions were held to identify the relevant technologies, solutions and development . TGBL has entered into MOU with many external companies and Institutes under confidentiality agreements to work further on various collaborative projects and assignments. We are engaging with our regular vendors of rigid and flexible packaging for packaging improvement including re-engineering of packs.
95
Annual Report 2015-16
(ii)
Benefits derived like product improvement, cost reduction, product development or import substitution:
During the year, the Company launched three products – Tata Tea Fusion (Black tea), Tetely Lemon flavoured Long Leaf Green Tea and Tata Coffee Grand (Instant Coffee). This has been achieved through the efforts taken on technology and product development and collaborations.
Other benefits included collaborations with various external partners to the development work, significant of which are as under:
•
•
•
Collaborated with Nichrome, Facile and Manjusree Plastics for development of packaging concepts and machinery for Tata Tea Fusion
Connect with every sip
In case of imported Technology (imported during the last three years reckoned from the beginning of the financial year): a)
The details of technology imported: The Company has not imported any technology during the last three financial years
b)
The year of import: Not Applicable
c)
Whether the technology has been fully absorbed: Not Applicable
d)
If not fully absorbed, areas where absorption has not taken place and the reasons thereof: Not Applicable.
Expenditure incurred on Research & Development:
(iv)
Collaborated with flavour houses of Givaudan and IFF for flavour development for Flavoured Green Tea and Tata Coffee Grand
Capital Expenditure
0.71
Projects taken up with Central Food Technological Research Institute (CFTRI) for shelf life studies
Revenue Expenditure
5.50
Total R&D expenditure as a % of Net sales
•
Service agreements with Analytical labs – Eurofins, TUV India and MicroChem for analytical
•
Progressed collaboration efforts with Sami Labs and DuPont India Limited for t exploration of functional ingredients for development of products in the area of Health & Wellness
•
Engagement with Tata Chemicals for identifying suitable opportunities with various functional ingredients continues and progress made on some development concepts
•
Technology platform exploration continues with Zeon Life sciences for developing technologies for various product formats.
96
(iii)
•
Rs. in Crores
0.21%
C.
Foreign Exchange Earnings and Outgo
The Foreign Exchange earned in of actual inflows during the year and the Foreign Exchange Outgo during the year in of actual outflows:
Rs. in Crores
1.
Foreign Exchange Earned
314.84
2.
Outgo of Foreign Exchange
97.64
On behalf of the Board of Directors
Mumbai 24th May 2016
Cyrus P Mistry Chairman
Corporate Overview 01-48
Statutory Reports 49-124
Financial Statements 125-220
Management Discussion and Analysis- 2015-16 Business Overview Tata Global Beverages is a global natural beverage business with brand presence in over 40 countries. Your Company is the second largest player in branded tea in the world and has growing interests in coffee and water. Your Company focuses on creating ‘magical beverage moments’ for its consumers through its stable of innovative beverage brands, including Tata Tea, Tetley, Himalayan natural mineral water, Tata Gluco+, Tata Coffee Grand and Eight O’clock Coffee. Your Company follows an overall strategy that builds on its core strengths – understanding of consumer requirements, differentiated product offerings, brand management, distribution and international footprint. Whilst tea s for around 74% of our revenue, coffee s for 25% and water and other products contribute to the rest. Approximately 60% of the consolidated revenues come from markets outside India such as United Kingdom, United States of America, Canada, Russia, , Australia and Europe.
Industry Structure - Global Economic, Consumer and Competitor Trends The global economic trends continue to be uncertain with slower growth in many markets. India and China appear to be the growth engines of the future along with the US where the outlook appears to be improving. The macro-economic conditions are driving certain behavioral trends in consumers. Consumers, especially in the international markets, are continuing to seek better value thereby increasing competitive intensity. We have also seen new entrants in certain segments which has further increased the competitive intensity in those countries. Consumers are also looking for product choices that are increasingly shifting towards convenience, health and wellness and improving lifestyle. In keeping with the lifestyle theme, there is also a growing trend for more ised products in many markets. In addition, we have seen growth in new formats and new channels for sales. There is an emergence of specialty tea stores and café concepts coupled with growing e-commerce channels with an emphasis on personalisation and convenience. Changing consumer trends s has led to a category decline in everyday black tea in certain developed markets. In addition, since consumers have become value conscious, there have been instances of private label and regional players gaining in market share. Your Company continues to constantly strive to meet these challenges by strengthening its brands, category expansion, innovation, investment in new ventures and cost rationalisation. Your Company closely tracks and gains insights into the changing consumer landscape and trends like change in lifestyle, isation and the need for convenience. We do this by understanding the palate unique to each region and also
leveraging on the consumer preference for products related to health and wellness in order to offer a range of interesting and innovative products across the beverage portfolio. TGB brands have successfully adapted to the digital medium to narrate brand stories. From Tetley being rated as one of the top social brands by The Grocer in the UK, to the innovative Tetley Transformation initiative in India, the 80 seconds of Mindfulness campaign by Tetley in Australia, and Tetley Farmer’s First Hand – a unique property of TGB, our brands are leveraging the digital medium to touch consumers in meaningful ways.
Industry Structure – Commodity Trends Tea The 2015-16 season witnessed a crop decline across all major producing countries barring Bangladesh. In India, annual production declined 16.2 million kgs but most of this decline came from the South. Kenya which is the largest exporter of CTC teas also experienced a less favourable year and after two successive record crop years saw a drop of 45.9 million kgs or 10% from 2014. The top 10 producing and exporting countries outside of China collectively ed for a decline of 105 million kgs in annual production. However not all prices moved along expected lines and in tandem with a drop in supply. With the exception of Africa, led by Kenyan teas, most other producing countries witnessed a gradual easing in overall sales averages. Mombasa averages rose by $ 0.71 or 35% over 2014 at an average of $ 2.75 per kg. This is also $ 0.22 above the 5 year average. In North India, whilst the annual CTC average was lower by Rs 3.29, orthodox teas were dearer by Rs 19.28. North India also saw a pricing for quality teas which will be an encouragement for the unorganised sector and small tea growers towards more sustainable field practices and quality control. In South India prices dropped Rs 3.07 per kg. All India averages fell by Rs 2.31 and the year closed at Rs 128.60 per kg. In Colombo prices fell sharply by SL Rs 59.24 despite a lower crop. Bangladesh on the other hand recorded a higher crop and also a higher price of Tk 17.47. Markets in the first few months of the current year have reverted to a more traditional and expected pattern. A record first flush crop in North India has meant easier opening levels. This trend is forecast to continue for some time. In South India drier weather and lower production has moved prices upwards. We expect prices to remain at this level until the onset of the monsoons when higher spot availability should see prices move back. Kenya has had a record crop at the beginning of the year and prices have moved down reacting to this additional supply.
97
Annual Report 2015-16
Coffee The supply and price of coffee are subject to significant volatility. Supply and price of all coffee grades are affected by multiple factors, such as weather, natural disasters, crop damage, farm inputs and cost of production, competitive pressures, domestic and international currency and economics in producing countries. Price is also impacted by trading activities in the coffee futures markets including hedge funds and commodity index funds. We continually analyse green coffee costs to review our costing structure. To help mitigate volatility and external trading factors, commodity price management strategies are implemented to protect forward pricing. We purchase coffee from over 20 countries through a combination of outside trading companies and through other relationships to ensure supply of green coffee. We depend on these relationships with our supply partners to deliver on-time, specific taste profiles of our raw green coffee. The global production of Coffee for the year 2015 is estimated at 144.7 million bags and consumption at 152.1 million bags as per International Coffee Organisation. Due to higher production of Robusta in Vietnam and weakening emerging market currencies, coffee prices trended downward l in 2015-16. Coffee prices have traded in the price range of 1.1 cents/lbs to 1.5 cents/lbs for Arabica and 0.6 cents/lbs to 0.8 cents/lbs for Robusta. The outlook is for lower prices to continue in the initial months with some scope for hardening as the year progresses.
Consolidated Financial and Operating Performance The consolidated financial highlights for 2015-16 are as follows: Rs. in Crores 2015-16
2014-15
Variance
8,111
7,993
118
Operating Profit
532
642
(110)
Profit before exceptional items and taxes Exceptional items (net)
534
630
(96)
11
(130)
141
Profit before tax
545
500
45
Profit after tax
335
284
51
Group Consolidated net profit
326
248
78
Operating Income
For the year ended 31st March 2016, Income from operations at Rs 8,111 Crores was 2% higher than the previous year. At prior year exchange rates, the improvement would have been 3%. The growth has been achieved despite high competitive intensity,
98
•
Connect with every sip
adverse macro-economic conditions in certain countries, slower growth or decline in everyday black tea categories in developed markets. Operating profits at Rs 532 Crores is lower than the previous period mainly due to increased spends behind brands and new launches, higher spends on initiatives, absence of one time credits which was available in the previous year and higher commodity costs mainly in the international markets. However Group net profit significantly improved over the prior year due to the impact of exceptional items. In the current year, the exceptional items had a favourable impact mainly due to profit on sale of non-core investments partially offset by impairments taken for certain intangible assets.
Standalone Financial and Operating Performance Rs. in Crores 2015-16
2014-15
Variance
3,084
2,885
199
Operating Profit
319
297
22
Profit before exceptional items and taxes
396
418
(22)
Exceptional items (net)
265
(69)
334
Profit before tax
661
349
312
Provision for tax
(97)
(60)
(37)
Profit after tax
564
289
275
Operating Income
Income from operations grew 7% over the prior year driven by improvement in branded business due to volume improvements and higher price realisations. Profit from operations improved over the prior year mainly due to higher sales and lower blend costs offsetting the impact of higher spends behind brands. Profit after tax was significantly higher than the prior year mainly due to the impact of exceptional items. Exceptional items were favorably impacted by profit on sale of non-core investments.
Product / Brand Performance - Tea & Coffee Despite the challenging environment prevailing in the international markets, the branded business did report growth led by improvements in operations in India, MAP, Teapigs, Tata Starbucks, NourishCo and Russia. In India, tea sales improved due to volume increases and higher realisations, Tata Starbucks’ topline increase was attributable to better in-store performance and increase in the number of stores. Improvement in NourishCo’s performance was attributable to strong growth in Tata Gluco Plus and to a lesser extent Himalayan. Our MAP brand in
Corporate Overview 01-48
Australia benefitted from the impact of full year of operations post acquisition and improvements through growth in grocery channel. In certain developed markets like UK, Canada and US, we grappled with the challenge to grow top line as there was significant competitive intensity and decline in black tea category. High commodity cost in the international markets had an impact on profit delivery. However, your Company has done well in the /specialty segments. To meet the increasing demand in the segment, we increased distribution of our super tea, Teapigs. Teapigs recorded good growth in UK, Canada, US and other international markets with increased distribution. Green tea performance also exceeded expectations. In UK, our green tea growth has been significant and ahead of category growth driven by the improved performance of Tetley Super Green tea. Green tea also recorded significant growth in India with ment in the beginning of the year and online activation in the second half of the year. Our green tea portfolio has also done well in other countries such as Canada and . In addition, we also launched fruit and herbals in UK and USA which received favourable response from consumers. In India, during the year, we launched Tata Coffee Grand, with a high impact launch which created desired buzz and visibility. The global marketing function continues to focus on developing a strong global brand portfolio with an enhanced global innovation agenda. TGB will increase focus on its 4 power brands namely Tetley, Tata Tea, EOC and Himalayan. These power brands will be managed in a globally consistent manner including creating a global brand identity. Sales from non branded business recorded improvements mainly due to improved performance in coffee / pepper plantations coupled with improvements in instant coffee sales driven by improved agglomerated coffee sales. However, profitability was flat mainly due to wage revision impacting the plantation business and soft tea commodity prices offsetting the favourable impact of higher coffee/pepper sales.
Performance of Key Geographies/ Segments India Your Company’s operations in India reflect a topline improvement of 6% driven by growth across all major brands. The growth has been achieved mainly due to improved volumes and higher realisation. Operating profit improved attributed to improved sales and lower blend cost despite higher investments behind brands. The Company’s growth plans for the Indian business are driven by strategic innovation, category expansion and entering white
Statutory Reports 49-124
Financial Statements 125-220
spaces in the market. In line with this, your Company launched two new products in the tea category during the year under review. Tata Tea Fusion is a good example of innovation that allows consumers the option of blending different types of teas to create a customised brew. With Tata Tea Gold Mixture, your Company entered white space geographies by launching the brand in Maharashtra, the second largest tea market in India which is dominated by local players. This tea blend was specially crafted to deliver the strength, thickness and aroma preferred by consumers in Maharashtra. Additionally, your Company introduced an instant coffee product in India under the brand Tata Coffee Grand. This product was launched in a competitive environment and at a time when coffee consumption is seeing growth in non southern markets in India. Tata Coffee Grand is an innovative product and the launch is in line with our strategy of category expansion. The product was tly developed by your Company and Tata Coffee Limited, which leverages our deep heritage in coffee from ‘Source to Sip.’ Sourced primarily from Tata Coffee’s own plantations in South India, these coffees are roasted and processed to perfection, making the product an intensely rich, fresh and aromatic coffee. The product is an innovative blend of the finest coffee powder and decoction crystals which gives consumers a ‘best in class’ taste experience in the instant coffee category. The brand launch was ed by an impactful advertising campaign. Tata Starbucks business continues to grow. The store count stands at 82 at the end of the financial year. The growth drivers mainly are improved in- store performance as well as increase in the number of stores. Your Company continues to be the value and volume leaders in the overall tea category and is also a market leader in the green tea category. The branded tea segment recorded volume and value growth aided by improvements in Tata Tea Gold, Tata Tea Agni, Chakra Gold, Kanan Devan and Gemini. These brands have been ed through various ment campaigns and on-ground /online activations during the year. Double digit growth in Tetley brand was led by Green tea category. Within this category, online activation in the 2nd half of the year met with good consumer response We are pleased to report that our brand campaign, ‘Jaago Re’, won the Gold in the ‘Best On-going Campaign’ category for the campaign titled ‘From Packaged Good to Packaging Good’, at the 15th edition of the Effies Awards organised by the Advertising Club of India. The award recognises advertising that has succeeded in building brands and increasing sales.
99
Annual Report 2015-16
United Kingdom
Australia
Tetley in UK has been rated the No. 2 FMCG social brand of 2015 by The Grocer, jumping seven places from ninth position last year. The Grocer leads the market as the UK’s only paid-for online service and weekly magazine with coverage of the whole FMCG sector.
Europe and Middle East
In a challenging market, Eight O’ Clock Coffee’s 2015-16 reported net sales recorded marginal improvement over the prior year. The underlying performance was impacted mainly due to increase in competitor intensity through additional promotional events as well as deeper discounting. In addition, there were new entrants in the Pods category which further intensified the competitive landscape. The profitability of the business was impacted in the earlier part of the year due to higher commodity costs but improved in the second half of the year. The brand continues to do well and grow volumes in a competitive market. In the tea category, the green tea business is performing well and is gaining share. Good Earth Tea recorded stable sales and plans are being readied for scaling up this brand. Sales of Tetley however were lower against the prior year largely due to promotional underperformance in black tea. The Herbal tea which was launched has seen good consumer response.
Canada The business launched its line of specialty teas called Tetley Signature collection. The launch was ed by 100
Connect with every sip
advertising to reinforce Tetley’s leadership position in the specialty tea segment. The tea also provides the customer with a string and tag/drawstring tea bag. The Company is pleased to announce that it maintains both volume and value market leadership in Canada. In addition Teapigs has gained distribution and market share in the segment.
Black tea category continues to dominate the market with around 80% of volume and 60% value. While the everyday black tea category is in decline, there is good growth in speciality, green and fruit & herbal categories. The market environment is challenging with intense competition resulting in pressure on margins in major grocery s and frequent retailer strategy change and SKU reviews. This was further exacerbated with hardening of commodity costs which impacted operating profits. However, there were pockets of improvements in UK. The green tea, specialty teas and the super tea, Teapigs witnessed impressive growth. Early last year, Tetley launched four new Super Green Teas, the first fortified green teas in the UK with proven health benefits. The taste, combined with vitamins and minerals and the functional benefits has been drawing in consumers making Super Green award winning and the No. 1 NPD in the UK The product earlier received the coveted gold stars in the 2015 Great Taste Awards and has now followed it up with the Product of the Year 2016 award. Backed by the success of Tetley super green teas in UK, a new range of super fruit products has been presented to key customers and listing has been secured with some major retailers.
United States of America
•
Tetley in Canada has been voted the Most Trusted Brand of Tea by Canadians in 2016 now for two years in a row by the Reader’s Digest in their annual Trusted Brand survey.
The Australian business benefited from increase in MAP pods sales with tea volumes showing a decline due to decreased on-shelf display at key retail s. The business continues to engage with retailers to review product placement plans which will help improve volumes. The profitability of the tea business improved due to lower promotional costs and optimisation of overheads. However, the coffee business was impacted on of higher spends behind brands. Tea business remained stable despite decline in mainstream black tea segment. Within the specialty range, new flavours were launched across steamed green and Fruit &Herbal range. A new product – Mr. Barista was launched in the coffee segment which had a positive customer response.
The TGB team in Western Europe achieved new placements for Tetley in the domestic tea fixtures in Spain, with 6 products launching in 100 El Corte Ingles stores, the biggest department store group in Europe. El Corte Ingles have also invited Tetley to showcase additional products at their trade fair. We have also successfully secured the listing of Tetley Decaf in 400 stores owned by Grupo DIA, one of the leading specialist discount groups in Europe. These listings will help in gaining momentum with Spanish consumers. The exposure to domestic consumers from this listing is expected to have a positive impact on the awareness of the Tetley brand and the possibility of introducing new products, at a later stage, custom made for the local palate. The business in reported a robust growth, reflected in its MAT volume and value growth aided by green and earl grey segments post relaunch. The business also grew in Portugal mainly aided by specialty greens. Russia business topline grew aided by price increases with consumers switching to lower cost brands due to prevailing economic conditions. However, the profitability was impacted due to macro-economic conditions which reflected in the exchange rates and interest rates. There was good execution of the launch plans for Tetley in the Middle East and we continue to consolidate our position in the region.
Corporate Overview 01-48
The TGB team in Poland extended the Vitax range, our specialty tea brand, with the introduction of standout flavours full of intriguing combinations which is expected to gain consumer traction and mitigate the historical underperformances Very recently we completed a restructuring of the sales and distribution network in Poland which has improved the operational efficiencies and is expected to improve the business performance.. In the Middle East, the execution of the launch continues ed by ment and in-store promotions. New launches under the Kanan Devan brand found favourable response from the hot tea shops.
Water Vertical Tata Gluco plus was the star performer in the water vertical. The brand has been performing extremely well and high double digit growth in volume and value were recorded during the year 2015-16. The new proposition of “Gas minus Energy Plus” and the visual changes on the packaging to communicate “Energy” for the brand were received very well by the consumers and have accelerated the brand’s growth rate. The growth trajectory has been intact despite price increases taken for the brand. We have strengthened our distribution through the Pepsi network with presence in Maharashtra, Karnataka, Gujarat and Kerala. Himalayan sales reflected double digit growth with price increases and focus on channel mix. During the year, a television commercial was run with the objective of establishing Himalayan’s “Source” and “Nature” credentials.
Non Branded Business Our Non Branded business consists of plantations and extraction verticals. In plantations, we primarily manufacture and sell tea, coffee and other plantation produce like pepper whilst the extraction business is split between instant tea and instant coffee. In the current year, improvements were recorded in the Coffee extraction business and in coffee/pepper plantation business. In the instant coffee business, there were improvements in exports sales to the African and Russian markets. On the plantation side of the business, while the sales volumes and pricing generally improved, profitability was impacted by soft tea prices, wage revisions in the plantations. The instant tea business benefitted from customer acquisitions, improved sales realisation and lower operating costs. The instant coffee operation continues to focus on operational discipline, cost reduction and sustainability in operations. With a specific focus on cost reduction, various alternatives have been pursued to reduce the power and fuel costs in the instant coffee factories. The Theni Unit won the CII Sustainability award and Toopran unit, the National level Energy conservation award. We
Statutory Reports 49-124
Financial Statements 125-220
are pleased to report that the Instant Tea unit in Munnar won the prestigious Kerala State Pollution Control Board Award for the second year.
Outlook – Consumer, Commodity and Competition As detailed earlier in the document, the market environment is different across geographies and operating challenges are likely to continue. While overall global demand for tea is growing, in some developed markets, we face the challenge of decline mainly in the black tea category reflecting a shift in consumer consumption patterns. However, there are positive emerging trends - (i) growth in health and wellness segment with increasing recognition of health benefits of tea vs carbonated beverages, (ii) consumption shift towards non-black (includes green, specialty and Fruit & Herbal), (iii) increasing preference for / novelty/ artisanal products and (iv) emergence of alternate channels like specialty tea stores/ cafes and e-commerce platform with emphasis on personalisation. In developed markets, we expect the retail environment to remain competitive with increasing retailer consolidation and plan to continue with aggressive promotions strategy to sustain growth levels. We also expect the significance of modern trade to increase over traditional trade in these markets exacerbating the competitive environment. In addition to this, we also foresee private own-label brands and local brands continuing to be major competitors. With our vision to become the most ired natural beverages company in the world, Tata Global Beverages has stepped up its innovation agenda to leverage the emerging growth trends in our markets. We continue to commit resources to bolster our R&D pipeline and launch new products with a focus on specific themes: health & wellness and convenience (new formats), isation and expansion of non-black tea portfolio. For example, in the current year we launched Tetley Super Green in UK which provides functional benefits as part of our strategy to increase presence in Health & Wellness segment, launched Tata Tea Fusion in India and accelerated expansion of our super brand Teapigs as part of isation strategy and customised product for entry in white space markets e.g. Tata Tea Gold Mixture for Maharashtra. We also continue to invest in growth for our JVs: Tata Starbucks and NourishCo (Water) and scale up businesses in Middle East, Australia (Coffee) and USA (Tea). We also continuously review our cost structure and operating efficiencies in order to remain competitive and to leverage funds for growth.
101
Annual Report 2015-16
Outlook - Interest Rates and Exchange Rates Given the global operations of our Company, both interest rates and exchange rates in various currencies / geographies are of significant importance to our business. Most geographies that we operate in, witnessed a flat interest rate, mainly as inflation and inflationary expectation remained subdued. Interest rates eased in India driven by cut in policy rates by its central bank and are further expected to drift downwards marginally. Future impact of interest rates will depend on the outlook and action by the US Federal Reserve and also events like the impact of the UK referendum. The rupee saw an overall weakness given the probability of interest rates hike in the US and sudden sharp depreciation of its currency by China. The rupee however recovered some of its losses on of its apex bank instilling confidence by curtailing the volatility and some optimism that the Fed would gradually hike interest rates in US. Also expectations of rate cuts by RBI post budget prompted exporters to convert their receipts and kept the Rupee on a soft note. The rupee is expected to trade with a weaker bias owing to fears of Yuan devaluation and rate hikes by Fed. Sterling weakened against USD, starting from third quarter and is expected to weaken further given the uncertainty in outcome of the referendum on possible UK exit from the European Union coupled with dollar strengthening on the expectation of US rate hikes later in the year. The outcome of the referendum could impact currency and interest rates and potentially trade flows within the European Union. Russia macro- economic conditions remained uncertain given the high volatility in the oil prices. The market witnessed two-way movements in both interest rates and currency. The Company is governed by Board approved treasury policies with respect to hedges for its exposures arising out of interest rate risks and foreign exchange risks, and is reasonably covered in respect of its immediate trade flows.
Opportunities The focus on healthier lifestyles has created a very positive market for our product range. There is a big opportunity across geographies to ‘extend our business footprint by entering the Fruit and Herbal segments with Tetley’. Continuing its drive into functional teas, Tetley in the UK is launching three new Tetley Super Green Teas extending the functional benefits of the range to feature European Food Standards Agency approved health claims relating to heart health, detox and beauty. The momentum behind Super Green Tea enabled Tetley in the UK to grow retail value sales within the Green tea segment by 28% year on year. With the Boost and Immune variants doing
102
•
Connect with every sip
exceptionally well, it was important to extend the range to include other popular health benefits which are appealing to younger consumers who have been turning away from tea. The wide range of benefits offered in this range now gives consumers an added reason to drink green tea. The coffee category in India is poised to grow in the coming years and Tata Global Beverages is well positioned to enter this category. Tata Coffee Grand gives consumers the convenience of instant coffee along with excellent taste and flavour.
Threats, Risks and Concerns There is a continuous decline in the everyday black tea category in some of the key markets where your Company has significant operations. The Company is driving innovation in tea and non-tea categories to adapt to the changing environment. Intense competition in the market place with increased investment in promotions/ media impacts Company’s performance in market. The Company reviews and monitors its pricing and promotion strategy very closely and benchmarks with the industry practices. Significant increase in tea prices and inability to the increase to the consumer may impact earnings. Further, political, social and weather changes may impact availability as well. The Company focuses on development of market relationships, innovation of alternate supplier channels and exploring alternate sources of teas in other parts of the world to safeguard the earnings and availability. Tea is a multi harvest agricultural commodity and is sold through public auction or by private treaty. There is no futures market in tea. Price levels reflect supply/demand position and as an agricultural crop supply/demand balance may change quickly when weather conditions are adverse. To manage supply risk, the Company spreads its buying between public auction and private treaties. Cyclical swings in coffee commodity markets are common and the most recent years have been especially volatile for the price of coffee. Increases in the cost of green coffee could reduce our gross margin and profit. There can be no guarantee that we will be successful in ing commodity price increases on to our customers without losses in sales volume or gross margin. Precipitous decreases in the cost of green coffee could result in significant headwinds causing us to lower sales prices before realising cost reductions in our green coffee inventory. TGB has a robust framework in place to protect its interests from risks arising out of market volatility. Based on market intelligence and continuous monitoring, the sales and procurement teams take appropriate strategy to deal with such market volatility.
Corporate Overview 01-48
Volatility in currency exchange movements like RUB, CAD, USD, GBP and AUD can pose challenges to the Company’s operations through earnings dilution. The Company has established currency hedging policies and practices to manage these risks. The referendum on Brexit can also pose some risks if the decision by the UK is to exit the EU. While the potential implications arising out of absence of free trade access in such a scenario is difficult to predict in the short to medium term, the currency is most likely to experience sharp depreciation which can have an inflationary impact on the business. Changes in regulations relating to taxation, product and other areas if significant could impact performance.
Risk Management The Company has a system of documenting and reviewing key risks. Apart from management reviews, the risks are also periodically reviewed by the Board and its various sub committees including the Risk Management Committee.
Human Resources and Industrial Relations Your Company implemented several initiatives towards enhancing capabilities and to our growth agenda. The key initiatives were: •
Re-energising the organisation: A group wide survey was conducted in association with Gallup wherein we identified 20 engagement driver questions which saw a very high level of participation and the results showed that 14 drivers have a significant positive change as per Gallup benchmarks.
•
Brewing Brilliance: This is an online peer to peer recognition program wherein every employee can share and convey appreciation & recognition to other colleagues. This has been very successful.
•
Perfect Cup: The Company introduced a Global Reward & Recognition programme celebrating a culture of success and recognition.
•
High Performance and Reward: A Global Reward Strategy Benchmarking was undertaken and a key summary was shared with Senior Leadership for their inputs and . A revised approach to the Annual Salary Review process aligned to the recommendation of the benchmarking report and best-in class practices is proposed to be implemented.
•
Statutory Reports 49-124
Financial Statements 125-220
Talent Management Framework - An Integrated approach to Talent Management focusing on Talent, Assessment, Aspiration, Development and Impact was introduced with focus on aligning the Key HR process with talent management process to create an effective framework for attracting and retaining High performing Talent.
The total number of employees on the rolls of Tata Global Beverages Limited as of 31st March 2016 was 2,552.
Internal Controls and Governance Your Company has adequate internal controls and robust systems in place. The Audit Committee of your Company review such controls periodically. The Internal audit function carries out a focused internal audit programme in consultation with the Audit Committee. The internal audit primarily focuses on the adequacy of appropriate systems and controls. The Tata Code of Conduct has prescribed guidelines outlining the key disclosure and governance requirements besides mandating the observance of applicable statutory requirements by the Company. Your Company and its senior management have affirmed adherence to the Code.
Cautionary statement Certain statements made in this report relating to the Company’s objectives, projections, outlook, expectations, estimates, among others may constitute ‘forward-looking statements’ within the meaning of applicable laws and regulations. Actual results may differ from such expectations, projections etc., whether express or implied. Several factors could make a significant difference to the Company’s operations. These include climatic conditions, economic conditions affecting demand and supply, government regulations and taxation, natural calamity, currency rate changes, among others over which the Company does not have any direct control.
Conclusion Your Company’s primary focus will be to grow volumes across markets. TGB will address each market depending on local conditions and consumer trends. While we recognise that the global environment is extremely challenging there are new opportunities emerging to meet consumer needs. Tata Global Beverages will focus on profitable growth through a mix of brand led growth, innovation, efficient cost management and successfully scaling up new businesses.
103
Annual Report 2015-16
•
Connect with every sip
Report on Corporate Governance for the Financial Year 2015-16 1.
Company’s Philosophy on Code of Governance
The corporate governance philosophy of your Company ensures transparency in all dealings and in the functioning of the management and the Board. These policies seek to focus on enhancement of long-term shareholder value without compromising on integrity, social obligations and regulatory compliances. The Company operates within accepted standards of propriety, fair play and justice and aims at creating a culture of openness in relationships between itself and its stakeholders. It has set up a system which enables all its employees to voice their concerns openly and without any fear or inhibition. The corporate governance philosophy of the Company has been further strengthened through the Tata Code of Conduct, Tata Business Excellence Model, Tata Code for Prevention of Insider Trading and Code of Corporate Disclosure policies.
As a global organisation, the corporate governance practices followed by your Company are compatible with international standards and best practices. As a responsible corporate citizen, your Company had established systems to encourage and recognise employee participation and volunteering in environmental and social initiatives that contribute to organisational sustainability, systematic training, learning and personal growth, conservation of energy and other scarce resources, promoting safety and health of its employees and of the neighbouring community etc. These actions have become an integral part of your Company’s operating plans and are not meant for building of image or publicity.
2.
Board of Directors a. Composition & Category of Directors
The Company has an optimum combination of executive and non-executive directors including woman directors. As on 31st March, 2016, the Company had 11 directors and the composition of the Board of Directors is given in the table below. The Chairman of the Board is a non-executive director and 81.82% of the Board comprises of non-executive directors. In of Regulation 17 of Securities and Exchange Board of India (Listing Obligations and Disclosure Requirements) Regulations, 2015, at least 50% of the Board should comprise of non-executive independent directors with at least one woman director. The non-executive independent directors constituted 54.55% of the Board as at 31st March 2016. The Company has three women directors on the Board.
Category
Number of Directors
%
Non-Independent Directors
3
27.27
Managing & Executive Directors
2
18.18
Independent Directors
6
54.55
11
100.00
Total
104
Corporate Overview 01-48
b.
Details of attendance of each Director at Board Meetings and at the last year’s Annual General Meeting with particulars of their other Directorships and Chairman/hip of Board Committees (excluding Tata Global Beverages Limited) along with the number of shares and convertible instruments held by the Directors showing the position as at 31st March 2016 are given in the following table:
Name of Director
Position
Attendance at Board Meetings Held
Attended
Last AGM
No. of Directorships and Chairman/ hip of Board Committees equity in other Indian public companies shares Held Director Committee Committee Member Chairman
Mr. Cyrus P Mistry
C, NED & NI
9
9
Yes
9
-
-
33,000
Mrs. M Srinivasan
NED & I
9
6
Yes
6
-
-
-
Mr. Analjit Singh
NED & I
9
2
No
5
-
-
-
Mr. V Leeladhar
NED & I
9
9
Yes
5
4
-
-
Mrs. Ranjana Kumar
NED & I
9
9
Yes
4
1
2
-
Mr. Darius Pandole
NED & I
9
9
Yes
2
2
-
-
Mr. S Santhanakrishnan NED & NI
9
6
Yes
7
-
4
-
Mrs. Ireena Vittal
9
7
Yes
6
5
-
-
NED & I
Mr. Harish Bhat
NED & NI
9
9
Yes
5
3
1
-
Mr. Ajoy Misra
MD
9
9
Yes
2
-
-
-
Mr. L KrishnaKumar
ED
9
9
Yes
1
-
-
-
C: Chairman; NI: Non-Independent; NED: Non-Executive Director; I: Independent Director; MD: Managing Director; ED: Executive Director
Video / teleconferencing facilities are used as and when required to facilitate Directors at other locations to participate in the meetings.
The Company has not issued any convertible instruments.
Note: Other Directorships do not include Directorships of private limited companies, foreign companies, companies ed under Section 25 of the Companies Act, 1956 and Alternate Directorships.
Financial Statements 125-220
Statutory Reports 49-124
Particulars about Director retiring by rotation and eligible for re-appointment is given in the Annexure to the Notice.
The Company has received declarations on criteria of independence as prescribed in Section 149 of Companies Act 2013 and Regulation 16 (1) (b) of Securities and Exchange Board of India (Listing Obligations and Disclosure Requirements) Regulations, 2015 from the Directors of the Company who have been classified as Independent Directors.
As will be noted from the table above, no director is member of more than 10 Board Committees or Chairman of more than 5 Board Committees across all companies where he/she is a Director. Further no Independent Director serves as Independent Director in more than 7 listed companies.
Chairmanship/hip of Board Committees includes hip of Audit and Stakeholder Relationship Committees of Indian public limited companies only.
105
Annual Report 2015-16
c.
Number of board meetings and dates on which held
During 2015-16, the Board met nine times on 30th April, 2015, 28th May, 2015, 6th August, 2015, 14th August, 2015, 29th October, 2015, 5th November, 2015, 14th January, 2016, 10th February, 2016 and 31st March, 2016. The maximum time gap between two board meetings was less than 120 days. Minutes of the meetings of all the Board and Committees are circulated to all the Directors.
d. No director of the Company is related to any other director of the Company.
e.
f.
Familiarisation programme for Independent Directors The Independent Directors have been familiarised with the Company, their roles and responsibilities in the Company, nature of the Industry in which the Company operates, business model of the Company etc. The details of familiarisation programmes imparted to the Independent Directors during 2015-16 are put up on the website of the Company and can be accessed at http://www. tataglobalbeverages.com/company/leadership/ board-of-directors
Code of conduct Tata Code of Conduct is a comprehensive written code which is applicable to all employees including the Managing and Executive Directors. A separate code of conduct applicable to the Non-Executive Directors was laid down by the Board. Both Tata Code of Conduct and the Code of Conduct for Non-Executive Directors have been posted on the website of the Company and can be accessed at http://www.tataglobalbeverages.com/company/ leadership/board-of-directors. The Board of Directors in their meeting held on 14th August 2015 have adopted the revised / refreshed Tata Code of Conduct which came into effect from 7th August, 2015.
In respect of financial year 2015-16, all Board and Senior Management personnel of the Company have affirmed compliance with the code as applicable to them and a declaration to this effect signed by the Managing Director is published in this Annual Report.
106
g.
•
Connect with every sip
Formal letter of appointment to the independent directors
The Company has issued formal letter of appointment to all the Independent Directors on their appointment explaining inter-alia, their roles, responsibilities, code of conduct, functions and duties as directors of the Company. The and conditions of appointment of independent directors have been hosted on the website of the Company and can be accessed at http://www. tataglobalbeverages.com/docs/default-source/ board-of-directors/-and-conditions-ofappointment-of-independent-directors.pdf
h.
Separate meeting of independent directors
During the financial year 2015-16, the independent directors met separately without the presence of non-independent directors on 31st March, 2016 in compliance with Regulation 25 (3) of the Securities and Exchange Board of India (Listing Obligations and Disclosure Requirements), Regulations, 2015.
The independent directors at their meeting inter-alia discussed the following:
i.
Reviewed the performance of nonindependent directors and the Board as a whole;
ii.
Reviewed the performance of the Chairman of the Company, taking into the views of executive directors and nonexecutive directors;
iii.
Assessed the quality, quantity and timeliness of flow of information between the Company management and the Board that is necessary for the Board to effectively and reasonably perform their duties.
3.
Audit Committee
a
Brief description of of reference A qualified and independent Audit Committee has been set up by the Board in compliance with the requirements of Regulation 18 of Securities and Exchange Board of India (Listing Obligations and Disclosure Requirements) Regulations, 2015 and Section 177 of the Companies Act, 2013. The of reference of the Audit Committee are inter-alia as under:
Corporate Overview 01-48
i.
Review of the quarterly and half yearly financial results with the management and the statutory auditors;
Review with the management and statutory auditors of the annual financial statements before submission to the Board;
ii.
iii.
Review with the management, statutory auditors and the internal auditors about the nature and scope of audits and of the adequacy of internal control systems;
iv.
Consideration of the reports of the internal auditors and discussion about their findings with the management and suggesting corrective actions wherever necessary;
v.
Review of the financial reporting process and disclosure of financial information;
vi.
Review of the adequacy of the internal audit function;
vii.
Look into the reasons for any substantial defaults in payment to the depositors, debenture-holders, shareholders (in case of non-payment of declared dividend) and creditors, if any;
viii.
Recommending the appointment and removal of External Auditors, fixation of audit fee and approval for payment for any other services;
ix.
Review and monitor statutory auditor’s independence and performance and effectiveness of audit process; Approval or any subsequent modification of transactions with related parties;
Financial Statements 125-220
Statutory Reports 49-124
xi.
Scrutiny of inter-corporate loans and investments;
xii.
Evaluation of internal financial controls and risk management systems;
xiii.
Review the functioning of the whistle blower mechanism;
xiv.
Frame policies in relation to implementation of the Code of Conduct for Prevention of Insider Trading (Code) and supervise its implementation under the overall supervision of the Board;
xv.
Reviewing the Company’s financial and risk management policies;
xvi. Authority to review / investigate into any matter covered by Section 177 of the Companies Act, 2013 and matters specified in Part C of Schedule II of the Securities and Exchange Board of India (Listing Obligations and Disclosure Requirements), Regulations, 2015.
b.
Composition, names of and Chairman
As on 31st March 2016, all of the Audit Committee are Non-Executive Directors and four of them, including the Chairman are Independent Directors. All the of the Audit Committee are financially literate as defined in Regulation 18 (1)(c) of Securities and Exchange Board of India (Listing Obligations and Disclosure Requirements) Regulations, 2015.
Mr. V Leeladhar is the Chairman of the Audit Committee. He has expert knowledge in banking and financial matters. He was present at the last Annual General Meeting of the Company held on 14th August 2015.
x.
The composition of the Audit Committee as on 31st March, 2016 and particulars of attendance by the at the meetings of the committee held in 2015-16 are given below: Name
Category
No. of meetings during 2015-16 Held
Attended
Mr. V Leeladhar, Chairman
Independent, Non-Executive
7
7
Mrs. Ranjana Kumar
Independent, Non-Executive
7
6
Mr. Darius Pandole
Independent, Non-Executive
7
7
Mr. S Santhanakrishnan
Non-Independent, Non-Executive
7
5
Mrs. Ireena Vittal
Independent, Non-Executive
7
6
Mr. Harish Bhat
Non-Independent, Non-Executive
7
4
107
Annual Report 2015-16
c.
Meetings and attendance during the year During 2015-16, seven Audit Committee meetings were held on 27th May 2015, 5th August 2015, 28th October 2015, 5th November 2015, 9th February 2016, 4th March, 2016 and 30th March 2016. The Audit Committee Meetings are attended by invitation by the Managing Director, Executive Director, Chief Financial Officer, Chief Internal Auditor and the Statutory Auditors. The Company Secretary acts as the Secretary of the Audit Committee.
4.
Nomination and Remuneration Committee
a.
Brief description of of reference The Board has set up a Nomination and Remuneration Committee. This Committee is inter-alia responsible for: i.
ii.
the Board in matters related to set up and composition of the Board, its committees and the leadership team including formulation of criteria for determining qualifications, positive attributes and independence of a director and recommend to the Board of Directors a policy relating to remuneration of the Directors, Key Managerial Personnel and other employees Carry out evaluation of every director’s performance and the Board and independent directors , as may be required, in evaluation of the performance of the Board, its committees and individual directors
b.
Connect with every sip
iii.
the Board in matters related to remuneration of directors, KMP, executive team and other employees
iv.
Extend oversight on the familiarisation programme of directors
v.
Extend oversight on the HR philosophy , HR and People Strategy and key HR practices
vi.
Recommending to the Board, the remuneration package of Managing and Executive Directors, including their annual increment and incentive remuneration after reviewing their performance
vii.
Devising a policy on diversity of board of directors
viii.
Identifying persons who are qualified to become directors and who may be appointed in senior management in accordance with the criteria laid down, and recommend to the board of directors their appointment and removal
ix.
Whether to extend or continue the term of appointment of the independent directors, on the basis of the report of performance evaluation of independent directors.
Composition, name of and Chairperson As on 31st March 2016, the Nomination and Remuneration Committee consisted of five directors, all of whom are non-executive directors. Mrs. Ranjana Kumar, Independent Director is the Chairperson of the Committee.
The composition of the committee as at 31st March, 2016 and particulars of attendance by the at the meetings of the committee held in 2015-16 are given below: Name
108
•
Category
No. of meetings during 2015-16 Held
Attended
Mrs. Ranjana Kumar, Chairperson
Independent, Non-Executive
2
2
Mr. Cyrus P Mistry
Non-independent, Non-Executive
2
2
Mr. V Leeladhar
Independent, Non-Executive
2
2
Mr. Darius Pandole
Independent, Non-Executive
2
2
Mr. Harish Bhat
Non-independent, Non-Executive
2
2
Corporate Overview 01-48
c.
d.
e.
Statutory Reports 49-124
Meetings and attendance during the year
targets, growth & diversification, remuneration in other companies of comparable size and complexity, performance of the directors at meetings of the Board and of the Board Committees etc.
The Nomination and Remuneration Committee met twice during 2015/16 on 26th May, 2015 and 31st March, 2016 and the particulars of attendance are mentioned in 4(b) above.
Performance Evaluation Pursuant to the provisions of Companies Act, 2013 and the applicable provisions of the Securities and Exchange Board of India (Listing Obligations and Disclosure Requirements) Regulations, 2015, the Board has carried out the Annual performance evaluation of its own performance, the Directors individually as well as the evaluation of the working of its Audit, Nomination and Remuneration, Stakeholder Relationship and CSR Committees. A structured questionnaire was prepared after taking into consideration inputs received from the Directors covering various aspects of the Board’s functioning such as adequacy of the composition of the Board and its Committees, Board culture, execution and performance of specific duties, obligations and governance. A separate exercise was carried out to evaluate the performance of individual directors including the Chairman of the Board who were evaluated on parameters such as guidance/ to management outside Board/ Committee meetings, degree of fulfilment of key responsibilities, effectiveness of meetings etc. The performance evaluation of the Independent Directors was carried out by the entire Board. The Directors expressed their satisfaction with the evaluation process.
Remuneration policy
The Company’s Remuneration policy for Directors, Key Managerial Personnel and other employees is mentioned in the Directors Report.
The remuneration policy followed by the Company takes into consideration performance of the Company during the year and of the Managing and Executive Directors on certain parameters, such as condition of the industry, achievement of budgeted
Financial Statements 125-220
5.
Remuneration of Directors
a)
During the year, there was no pecuniary relationship or transaction between the Company and any of its Non-executive Directors apart from sitting fees and commission.
b)
Non-Executive Directors’ compensation and disclosures
The non-executive Directors, including Independent Directors, are paid Sitting fees for attending the meetings of the Board and Committees of the Board. With effect from 28th May, 2015, the Company pays a fee of Rs. 30,000 per meeting per director for attending meetings of the Board, Audit, Nomination and Remuneration and Executive Committees (Rs. 20,000 in case of Mr. Cyrus Mistry, Chairman and Mr. Harish Bhat, Director). For meetings of all other Committees of the Board, a sitting fee of Rs. 20,000 per meeting per director is paid (Rs. 15,000 in case of Mr. Cyrus Mistry, Chairman and Mr. Harish Bhat, Director).
Within the ceiling of 1% of net profits of the Company computed under the applicable provisions of the Companies Act, 2013, the Non-Executive Directors including Independent Directors are also paid a commission, the amount whereof is determined by the Board. The basis of determining the specific amount of commission payable to a Non-Executive Director is related to his attendance at meetings, role and responsibility as Chairman/Member of the Board/Committees and overall contribution as well as time spent on operational matters other than at the meetings. The shareholders of the Company had approved payment of commission to the non-executive directors at the Annual General Meeting held on 26th August, 2014, which is valid up to the financial year ended 31st March 2019. No Stock option has been granted to the Non-Executive Directors.
109
Annual Report 2015-16
•
Connect with every sip
Non-Executive Directors’ Remuneration paid in 2015-16 and payable for 2015-16 Rs. in Lakhs
Mr. Cyrus P Mistry Mrs. Mallika Srinivasan Mr. Analjit Singh Mr. V. Leeladhar Mrs. Ranjana Kumar Mr. Darius Pandole Mr. S. Santhanakrishnan Mrs. Ireena Vittal Mr. Harish Bhat
Commission* (Relating to 2014-15) 12.00 8.00 60.00 42.00 35.00 30.00 25.00 -
Commission# (Relating to 2015-16) 11.00 4.00 59.00 45.00 39.00 28.00 28.00 -
Sitting Fees 2.20 1.70 0.60 7.85 6.30 5.55 4.35 3.85 3.65
*Paid in 2015-16 # Payable in 2016-17
c)
Note: The resolutions appointing these directors do not provide for payment of severance fees.
(i) & (ii) The Remuneration details of Managing / Executive Directors are mentioned below:
Salary Allowances and perquisites Contribution to Retiral Funds Incentive (relating to 2015-16) Stock option No. of Shares held Service Contract Notice period
Rs. in Lakhs Mr. L KrishnaKumar Executive Director 95.35 60.25 22.47 73.75 5 years from 1st April 2013 6 Months
In addition, both Mr. Ajoy Misra and Mr. L. KrishnaKumar drew the following remuneration during 2015-16 from an overseas subsidiary of the Company: Rs. in Lakhs
Salary and Benefits
Mr. Ajoy Misra Managing Director 114.39 66.52 26.94 73.97 5 years from 1st April 2014 6 Months
Mr. Ajoy Misra Managing Director 65.35
Mr. L KrishnaKumar Executive Director 42.39
Note: The remuneration drawn in GBP has been converted into INR at average exchange rate.
(iii) The of appointment of the Managing and Executive Directors provide that the appointment may be terminated by either party by giving to the other party six months’ notice of such termination or the Company paying six months remuneration in lieu thereof.
(iv) Stock options
110
Note: The resolutions appointing these directors do not provide for payment of severance fees.
The Company has not granted Stock Option to any of its Directors.
Corporate Overview 01-48
6.
Statutory Reports 49-124
Financial Statements 125-220
Stakeholder Relationship Committee a. Name of the Non-Executive Director heading the Committee
As on 31st March, 2016, the Stakeholder Relationship Committee comprised of 3 . Mr. V. Leeladhar is the Chairman and Mr. S. Santhanakrishnan and Mr. L. KrishnaKumar are the other of the said Committee.
The Committee held four meetings during 2015-16 on 8th June, 2015, 7th August, 2015, 9th February, 2016 and 30th March, 2016. The representatives of the Registrars are sometimes present at these meetings. The Committee’s of reference, inter-alia includes consideration and resolving the grievances of shareholders. The Committee also oversees the performance of the Registrar and Share Transfer Agent and recommends measures for overall improvement of the quality of investor services as and when need arises.
To expedite the process of share transfers, the Board has delegated the power of share transfer to the Registrars and share transfer agent and share transfer formalities are approved by them on a fortnightly basis. The composition of the Committee and details of attendance by its at the meetings of the Committee held in 2015-16 are given below:
b.
Name
Category
Mr. V Leeladhar, Chairman Mr. S Santhanakrishnan Mr. L. KrishnaKumar
Independent, Non-Executive Non-Independent, Non-Executive Non-Independent, Executive
No. of meetings during 2015-16 Held Attended 4 4 4 2 4 4
Name and designation of Compliance Officer
Mr. V Madan, Vice-President & Company Secretary is the Compliance Officer for complying with requirements of Securities laws and the Securities and Exchange Board of India (Listing Obligations and Disclosure Requirements) Regulations, 2015.
Number of shareholders’ complaints received, number not solved to the satisfaction of shareholders and number of pending complaints
c.
Given below are the position of queries/complaints and other correspondences received and attended to during 2015-16 in respect of equity shares: Equity Shares 1,978 1,333 3,281 30
For non-receipt of dividend, shares lodged for transfer, repayment cheques Other letters received from shareholders Queries/complaints redressed Pending queries/complaints as on 31/03/2016* *Replied in April 2016
Every letter received from the investors is replied and the response time for shareholders’ correspondences during 2015-16 is shown in the following table: Total number of correspondences received during 2015-16 Replied within 1 to 4 days of receipt Replied within 5 to 7 days of receipt Replied within 8 to 15 days of receipt Replied after 15 days of receipt* Received in last week of March 2016 and replied in April 2016
Number 3,311 2,084 696 481 20 30
% 100.00 62.94 21.02 14.53 0.60 0.91
* 15 queries pertained to issue of duplicate dividend warrants which were awaiting completion of reconciliation by bankers. Remaining 5 correspondences pertained to SEBI Complaints and involved retrieving of old records and hence took longer time to deal with. 111
Annual Report 2015-16
Connect with every sip
Promptness in attending to correspondences of shareholders is shown in the following chart:
Replied within 1 to 4 days of receipt
2,084
Replied within 5 to 7 days of receipt
696
Replied within 8 to 15 days of receipt
481
Replied after 15 days of receipt
20
Received in last week of March 2016 and replied in April 2016
30
The shares of the Company are traded in dematerialised form. A table showing the requests received for dematerialisation/ transfers during 2015/16 is given below: Transfers No. of requests
Transfers No. of Shares
Demats No. of requests
Demats No. of Shares
Lodged
494
6,11,977
1,255
12,59,580
Processed
216
3,77,946
674
7,64,286
Objections
274
2,27,081
567
4,68,164
4
6,950
14
27,130
Pending as on 31/03/2016
•
Note: 97.56% of the issued share capital of the Company is held in dematerialised form as on 31.03.2016.
7.
Other Board Committees
The Board has constituted following other Board committees besides the committees mentioned above:
a)
Ethics and Compliance Committee: The Board has constituted an Ethics and Compliance Committee to look into the requirements under Insider Trading Regulations including the Group guidelines on Insider Trading and Tata Code of Conduct. Three meetings of the said committee were held during 2015-16 on 7th August, 2015, 9th February, 2016 and 30th March, 2016. The composition of the Committee and details of attendance by its at the meetings are given below: Name
112
Category
No. of meetings during 2015-16 Held
Attended
Mr. V Leeladhar, Chairman
Independent, Non-Executive
3
3
Mrs. Ranjana Kumar
Independent, Non-Executive
3
3
Mr. Ajoy Misra
Non-Independent, Executive
3
3
Corporate Overview 01-48
b)
Financial Statements 125-220
Statutory Reports 49-124
Corporate Social Responsibility Committee: The Board has constituted a Corporate Social Responsibility Committee (CSR) to look into the following: yy
Matters specified in Section 135 of the Companies Act 2013 which inter-alia includes:
(a)
formulate and recommend to the Board, a Corporate Social Responsibility Policy which shall indicate the activities to be undertaken by the company as specified in Schedule VII;
(b)
recommend the amount of expenditure to be incurred on the activities referred to in clause (a);
(c)
monitor the Corporate Social Responsibility Policy of the Company from time to time.
yy
Monitor and provide guidance on Company’s policies on environment management, social responsibilities, health & safety, product stewardship, community development, principles of managing branded operations, etc.
yy
Provide guidance on welfare activities in and around Munnar.
Two meetings of the CSR Committee were held during 2015-16 on 28th October, 2015 and 30th March, 2016. The composition of the Committee and details of attendance by its at the meetings are given below: Name
c)
Category
No. of meetings during 2015-16 Held
Attended
Mrs. Ranjana Kumar, Chairperson
Independent, Non-Executive
2
2
Mr. V Leeladhar
Independent, Non-Executive
2
2
Mr. S Santhanakrishnan
Non-Independent, Non- Executive
2
1
Mr. Ajoy Misra
Non-Independent, Executive
2
2
Dr. S Parasuraman
Expert member (Not a Board member)
2
0
Executive Committee The Board has constituted an Executive Committee to review business and strategy, long term financial projections and cash flows, capital/revenue budgets and capital expenditure programmes, acquisition/divestment, business restructuring proposals, senior management succession planning and any other item that the Board may decide to delegate. No meetings of the said committee were held during 2015-16. However the matters mentioned above were reviewed by the Board from time to time. The composition of the Committee is given below: Name
Category
Mr. Cyrus P Mistry, Chairman
Non -Independent, Non-Executive
Mrs. Ireena Vittal
Independent, Non-Executive
Mr. Harish Bhat
Non-Independent Non- Executive
Mr. Ajoy Misra
Non-Independent, Executive
Mr. L KrishnaKumar
Non-Independent, Executive
113
Annual Report 2015-16
d)
•
Connect with every sip
Risk Management Committee
The Risk Management Committee of the Board of Directors has been entrusted with the responsibility to assist the Board in overseeing and approving the Company’s risk management framework. The Company has a comprehensive Risk policy and a Risk detailing the risks that the Company faces under various categories like strategic, financial, commercial, operational, IT, legal, regulatory, people, reputational and other risks and these have been identified and suitable mitigation measures have also been formulated. The Risk Management Committee reviews the key risks and the risk and the mitigation measures periodically.
Three meetings of the Risk Management Committee were held during 2015-16 on 5th August, 2015, 28th October, 2015 and 30th March, 2016. The composition of the Risk Management Committee as on 31st March, 2016 and particulars of attendance by the at the meetings are given below: Name
8.
Category
No. of meetings during 2015-16 Held
Attended
Mr. V Leeladhar, Chairman
Independent, Non-Executive
3
3
Mrs. Ranjana Kumar
Independent, Non-Executive
3
3
Mr. Darius Pandole
Independent, Non-Executive
3
3
Mr. S Santhanakrishnan
Non-Independent, Non-Executive
3
2
Mrs. Ireena Vittal
Independent, Non-Executive
3
3
Mr. Harish Bhat
Non-Independent, Non-Executive
3
3
General Body Meetings a. Location and time where last three AGMs were held, whether any special resolutions ed in the previous 3 AGMs
The last three Annual General Meetings of the Company were held as under:Year
Location
Date
Time
No. of Special Resolutions approved at the AGM
2012- 2013
The Oberoi Grand, 15, Jawaharlal Nehru Road, Kolkata-700 013
15th July, 2013
10.30 a.m.
2013-2014
Same as above
26th August, 2014
10.30 a.m.
2
2014-2015
Same as above
14th August, 2015
10.30 a.m.
Nil
Nil
b
Whether any special resolution ed last year through postal ballot – details of voting pattern
No special resolutions were ed during 2015-16 through postal ballot.
c
Person who conducted the postal ballot exercise
N.A.
d
Whether any special resolution is proposed to be conducted through postal ballot
At present there is no proposal to any special resolution through postal ballot.
e
Procedure for postal ballot
Does not arise
114
Corporate Overview 01-48
9.
Statutory Reports 49-124
Financial Statements 125-220
Means of Communication a
Quarterly results
The quarterly results are published in the newspapers and displayed on the Company’s website
b
Newspapers wherein results normally published
The quarterly results are generally published in Business Standard and Pratidin (Bengali).
c
Any website, where displayed
The quarterly results of the Company are put on the website of the Company after these are submitted to the Stock Exchanges. Our website address is www.tataglobalbeverages.com
d
Whether it also displays official news releases
Yes
e
The presentations made to institutional investors or to analysts
The Company made a presentation to financial analysts on 28th May, 2015 after the results for the financial year 2014-15 were approved by the Board. A similar presentation was also made on 6th November 2015 after the results for the six months ended 30th September 2015 were approved by the Board. For the quarters ended 30th June 2015 and 31st December 2015, there were conference calls with the financial analysts on 6th August 2015 and 11th February 2016 respectively, post the financials for the respective quarters were approved by the board. Copies of the presentations and audio transcripts of the conference calls have been put up on the Company’s website.
10. General Shareholder information a. Annual General Meeting: Day
Date
Time
Wednesday
24th August, 2016 10.30 a.m.
b.
Financial Year : April 1 to March 31
c.
Financial calendar
Venue
Book Closure Period
Dividend payment date
The Oberoi Grand 15 Jawaharlal Nehru Road Kolkata – 700 013
10th August, 2016 to 24th August, 2016 (both days inclusive)
On or after 26th August, 2016
Board Meetings for approval of
Tentative dates
Annual s 2015-16
24th May, 2016
Financial results for 1 Quarter 2016-17
Second week of August, 2016
Financial results for 2nd Quarter 2016-17
Last week of October, 2016
Financial results for 3 Quarter 2016-17
Last week of January, 2017 / First week of February, 2017
Annual s 2016-17
Last week of May, 2017
st
rd
115
Annual Report 2015-16
d.
•
Connect with every sip
Name and address of each Stock Exchange at which Company Shares are listed and Stock Code : Listing on Stock Exchanges
Name
Address
Stock Code
The Calcutta Stock Exchange Association Limited
7, Lyons Range, Kolkata – 700 001
27 (For Physical); 10000027 (For Demat)
BSE Limited
Phiroze Jeejeebhoy Towers, 500800 Dalal Street, Mumbai – 400 001
National Stock Exchange of India Limited
Exchange Plaza, Plot No. C/1, G Block Bandra Kurla Complex, Bandra (E) Mumbai – 400 051
Equity Shares
‘TATAGLOBAL’
Global Depository Shares Luxembourg Stock Exchange London Stock Exchange
Dematerialisation Name
Address
ISIN
National Securities Depository Limited
Trade World, 5 Floor, Kamla Mills Compound Senapati Bapat Marg, Lower Parel, Mumbai 400 013
INE 192A01025
th
Central Depository 17th floor, Phiroze Jeejeebhoy Towers, Dalal Street, Mumbai 400 023 Services Limited
INE 192A01025
Listing Fees
Annual listing fees for 2016-17 has been paid to all the Stock Exchanges where the securities of the Company are listed.
Market price data – high, low during each month in the last financial year
e.
Month
NSE High
116
(in Rs) BSE
Low
High
Low
April 2015
143.15
140.40
163.40
140.50
May 2015
146.65
143.05
150.40
136.75
June 2015
132.75
129.15
146.25
126.05
July 2015
142.80
135.35
143.00
131.45
August 2015
120.15
116.85
147.05
108.85
September 2015
129.40
126.65
129.35
114.25
October 2015
137.25
131.00
141.50
127.40
November 2015
138.10
135.90
138.30
123.15
December 2015
148.00
144.20
146.55
130.00
January 2016
127.45
123.35
149.80
119.65
February 2016
107.10
101.60
128.35
100.10
March 2016
122.30
120.30
123.90
104.50
NSE: National Stock Exchange of India Limited; BSE: BSE Limited. There was no trading of the Company’s shares on the Calcutta Stock Exchange during the year 2015/16.
Corporate Overview 01-48
Financial Statements 125-220
Statutory Reports 49-124
The market share price data is graphically represented below: TGBL v/s Sensex 30,000
180
29,000
170
SENSEX
150
27,000
140
26,000
130 120
25,000
110
24,000
100
23,000 22,000
TGBL SHARE PRICE
160
28,000
90 Apr 15
May 15
Jun 15
Jul 15
Aug 15
Sep 15
Oct 15
Nov 15
Dec 15
Jan 16
Feb 16
Mar 16
Sensex
27011
27828
27781
28115
26283
26155
26657
26146
26118
24871
23002
25342
TGBL
142.15
146.2
132.35
140.1
119.6
127.7
133.1
137.75
144.75
126.35
103.65
121.25
80
f.
Performance in comparison to broad-based indices One year performance Company’s share price - As at 1st April, 2015 - As at 31st March, 2016 - Change Indices - As at 1st April, 2015 - As at 31st March, 2016 - Change Five year performance Company’s share price - As at 1st April, 2011 - As at 31st March, 2016 - Change Indices - As at 1st April, 2011 - As at 31st March, 2016 - Change
NSE
BSE
148.80 121.25 -18.52%
149.50 121.00 -19.06%
S & P CNX NIFTY
Sensex
8483.70 7738.40 -8.79%
27954.86 25341.86 -9.35%
NSE
BSE
97.75 121.25 24.04%
98.00 121.00 23.47%
S & P CNX NIFTY
Sensex
5835.00 7738.40 32.62%
19463.11 25341.86 30.20%
117
Annual Report 2015-16
g.
•
Connect with every sip
Registrar & Transfer Agents: ed office:
Address TSR Darashaw Limited 6-10 Haji Moosa Patrawala Ind. Estate 20 Dr. E Moses Road, Mahalaxmi Mumbai – 400 011
details Telephone: 022-66568484 Fax: 022-66568494 Website: www.tsrdarashaw.com E-mail : [email protected]
TSR Darashaw Limited. 503, Barton Centre, 5th Floor 84, Mahatma Gandhi Road, Bangalore – 560 001 TSR Darashaw Limited. Tata Center, 43, J L Nehru Road, Kolkata – 700 071 TSR Darashaw Limited. Bungalow No. 1 ‘E’ Road, Northern Town, Bistupur Jamshedpur – 831 001 TSR Darashaw Limited. 2/42 Sant Vihar, Ansari Road, Daryaganj New Delhi – 110 002
Tel: 080-25320321 Fax: 080-25580019 E-mail: [email protected]
Branch Offices at : South
East
North
Tel: 033-22883087 Fax: 033-22883062 E-mail: [email protected]
Agent of the Registrar: Shah Consultancy Services Limited
Telefax : 079-26576038 3, Sumathinath Complex, Pritam Nagar, Akhada Road, Ellisbridge, E-mail:[email protected] Ahmedabad – 380 006 The Registrars can be ed between 10 a.m. and 3.30 p.m. on any working day (Monday to Friday, excluding bank holidays)
Shareholders’ Relation Cell: Person
h.
118
Address
details
Mr. V Madan, Vice-President Tata Global Beverages Limited & Company Secretary “Kirloskar Business Park”4th Floor, Block “C”, New Air Port Road, Hebbal, Bangalore – 560 024
Tel: 080-67171200 Fax: 080-67171201 Website: www.tataglobalbeverages.com E-mail:[email protected]
Ms. Deepika Srivastava Manger-Legal and Secretarial
Tata Global Beverages Limited “Kirloskar Business Park”4th Floor, Block “C”, New Air Port Road, Hebbal, Bangalore – 560 024
Tel: 080-67171200 Fax: 080-67171201 Website: www.tataglobalbeverages.com E-mail:[email protected]
Mr. Gautam Mukherjee
Tata Global Beverages Limited 1, Bishop Lefroy Road, Kolkata – 700 020
Tel: 033-22836917 Fax: 033-22833032
Share transfer system Shares in physical form for transfer, should be lodged with the office of the Company’s Registrar & Share Transfer Agent, TSR Darashaw Limited, Mumbai or at their branch offices at the addresses given above or at the ed office of the Company. The transfers are processed if technically found to be in order and complete in all respects. As per directives issued by SEBI, it is compulsory to trade in the Company’s equity shares in dematerialised form.
Corporate Overview 01-48
i.
Distribution of Shareholding Holding
Amount (Rs.)
% to Capital
No. of Holders
% to Total Holders
1 to 500
2,06,97,095
2,06,97,095
3.28
1,42,383
77.25
501 to 1000
1,33,07,848
1,33,07,848
2.11
16,251
8.82
1001 to 2000
1,58,61,782
1,58,61,782
2.51
10,365
5.62
2001 to 3000
1,18,99,948
1,18,99,948
1.89
4,694
2.55
3001 to 4000
88,96,334
88,96,334
1.41
2,509
1.36
4001 to 5000
88,22,688
88,22,688
1.40
1,893
1.03
2,42,60,834
2,42,60,834
3.84
3,395
1.84
5001 to 10000 Greater than 10000 Total
52,73,83,200
52,73,83,200
83.56
2,824
1.53
63,11,29,729
63,11,29,729
100.00
1,84,314
100.00
Categories of Shareholders as at 31st March 2016 Sl. No. Particulars
No. of s
Holdings/Shares held
% to Capital
1
Tata Group Companies
10
21,71,28,190
34.40
2
Indian Financial Institutions
26
7,71,74,450
12.23
3
State Government
1
5,850
0.00
4
Central Government
2
3,53,281
0.06
5
Nationalised Banks
24
30,32,024
0.48
6
Mutual Funds
94
4,15,14,686
6.58
7
Foreign Institutional Investors / Foreign Companies
153
8,36,08,772
13.25
8
GDS Depositories
1
2,34,19,020
3.71
9
Other Companies
10
Individuals & Others Total
Financial Statements 125-220
Distribution of Shareholding as at 31st March 2016: No. of Shares
Statutory Reports 49-124
2,391
2,63,66,504
4.18
1,81,612
15,85,26,952
25.11
1,84,314
63,11,29,729
100.00
The category-wise shareholding is also shown in the chart below: Tata Group Companies Indian Financial Institutions State Government Central Government Nationalised Banks Mutual Funds
21,71,28,190 7,71,74,450 5,850 3,53,281 30,32,024 4,15,14,686
Foreign Institutional Investors / Foreign Companies
8,36,08,772
GDS Depositories
2,34,19,020
Other Companies
2,63,66,504
Individuals & Others
15,85,26,952
119
Annual Report 2015-16
j.
•
Connect with every sip
Dematerialisation of shares and liquidity
The process of conversion of shares from physical form to electronic form is known as dematerialisation. For dematerialising the shares, the shareholders should open a demat with a Depository Participant (DP). The shareholder is required to fill in a Demat Request Form and submit the same along with the original share certificates to his DP. The DP will allocate a demat request number and shall forward the request physically and electronically through NSDL/CDSL to Registrar & Transfer Agent. On receipt of the demat request both physically and electronically and after verification, the shares are dematerialised and an electronic credit of the shares is given in the of the shareholder.
Outstanding GDRs/ADRs/Warrants or any convertible instruments, conversion date and likely impact on equity
k.
l.
As on 31st March, 2016, the outstanding Global Depository Shares were 2,34,19,020. The GDSs are convertible into fully paid equity shares on 1:1 basis. The underlying shares against the outstanding GDSs have been allotted in the name of the Depository. There is no ADR or convertible instrument outstanding as on 31st March, 2016.
Commodity price risk or foreign exchange risk and hedging activities
Tea is a multi harvest agricultural commodity and is sold through public auction or by private treaty. Price levels reflect supply/demand position and as an agricultural crop, supply/demand balance may change quickly when weather conditions are adverse. To manage supply risk the Company spreads its buying between public auction and private treaties.
Cyclical swings in coffee commodity markets are common and the most recent years have been especially volatile for the price of coffee. Increases in the cost of green coffee could reduce our gross margin and profit. Your Group has a robust framework in place to protect its interests from risks arising out of market volatility. Based on market intelligence and continuous monitoring, the sales and procurement teams take appropriate strategy to deal with such market volatility.
Volatility in currency exchange movements like RUB, CAD, USD, GBP and AUD can pose challenges to the Company’s operations through earnings dilution. The Company has established currency hedging policies and practices to manage these risks.
Plant locations
m.
1.
Bangalore Packeting centre
2 3 4
Periakanal Estate Pullivasal Estate & Packeting centre Instant Tea Operations (including Nullatani factory) Tetley (Tea Bag) Division Mineral Water Plant
5 6
n.
Survey No. 14/4, A2 & 14/5, NH 4, Bangalore Tumkur Road, Malonagathi Hally, T. Begur Post, Nelamangla Taluk, Bangalore Rural District, Karnataka – 562123 PO Munnar, Dist. Idukki, Kerala – 685612 PO Munnar, Dist. Idukki, Kerala – 685612 Post Box no. 3, Idukki district, Munnar, Kerala – 685612 73/74 KPK Menon Road; Willingdon Island, Kochi, Kerala – 682 003 Village Dhaula Kuan, District Sirmour, Himachal Pradesh – 173 025
In addition to the above locations, the Company also operates through third party contract manufacturers at several locations.
Address for correspondence Given against 10(g) above
11. Transfer of unclaimed / unpaid amounts to the Investor Education and Protection Fund (IEPF)
Pursuant to Sections 205A and 205C of the Companies Act, 1956 and other applicable provisions, if any, of the Companies Act, 2013, all unclaimed / unpaid dividend, application money, debenture interest and interest on deposits as well as the principal amount of debentures and deposits, as applicable, remaining unclaimed / unpaid for a period of 7 years from the date they became due for payment, have been transferred to the IEPF established by the Central Government. No claim shall lie against the IEPF or the Company for the amounts so transferred prior to 31st March, 2016, nor shall any payment be made in respect of such claims. Shareholders who have not yet encashed their dividend warrants pertaining to the dividend declared in the financial year 2008-09 and/or any subsequent years are requested to make their claims without any delay to the Registrars. 120
Corporate Overview 01-48
Financial Statements 125-220
Statutory Reports 49-124
The following table gives information relating to outstanding dividend s and the dates when due for transfer to IEPF: Financial year ended
Date of payment of dividend
Unpaid dividend to be claimed by
Transfer to IEP Fund in
31st March 2009
04.09.2009
September 2016
October 2016
31 March 2010
27.08.2010
August 2017
September 2017
31st March 2011
02.09.2011
September 2018
October 2018
31 March 2012
03.09.2012
September 2019
October 2019
31 March 2013
18.07.2013
July 2020
August 2020
31st March 2014
28.08.2014
August 2021
September 2021
31 March 2015
19.08.2015
August 2022
September 2022
st
st st
st
Following are the details of unpaid dividend which will be due for transfer to IEPF upto 31st March 2017: Nature of payment
Date of payment
Unpaid dividend to be claimed by
Transfer to IEP Fund in
Dividend
04.09.2009
September 2016
October 2016
While the Registrar of the Company has already written to the shareholders informing them about the due dates of transfer to IEPF for these payments, attention of the shareholders is again drawn to this matter through the Annual Report.
Top Ten Shareholders
As at 31st March 2016, the top ten shareholders of the Company were as follows:Sl. No Name of the Shareholder 1
Tata Sons Limited
No. of shares
%
14,28,54,570
22.63
2
Life Insurance Corporation of India
5,44,16,998
8.62
3
Tata Chemicals Limited
4,31,75,140
6.84
4
Tata Investment Corporation Limited
2,69,45,000
4.27
5
ICICI Prudential Mutual Fund
2,24,01,478
3.55
6
Deutsche Bank Trust Company Americas
2,34,19,020
3.71
7
Government Pension Fund Global
86,82,045
1.38
8
National Westminster Bank PLC as Depository of First State Asia Pacific Fund a sub fund of First State Investments ICVC
79,52,367
1.26
9
National Insurance Company Limited
72,64,780
1.15
10
Dimensional Emerging Markets Value Fund
66,32,236
1.05
121
Annual Report 2015-16
•
Connect with every sip
The Company is compliant with all the mandatory requirements of the Securities and Exchange Board of India (Listing Obligations and Disclosure Requirements) Regulations, 2015 and erstwhile Clause 49 of the Listing Agreement for 2015-16.
The following non-mandatory requirements under Part E of Schedule II of the Securities and Exchange Board of India (Listing Obligations and Disclosure Requirements) Regulations, 2015 to the extent they have been adopted are mentioned below:
Details of non-compliance by the Company, penalties, strictures imposed on the Company by Stock Exchanges or SEBI or any statutory authority, on any matter related to capital markets during the last three years:
•
The Statutory financial statements of the Company are unqualified.
•
The Company has separate posts of Chairman and CEO.
There was no such instance in the last three years.
•
Whistle-blower policy and affirmation that no personnel has been denied access to the Audit Committee:
The Internal Auditors of the Company make presentations to the Audit Committee on their reports.
e
Web link where policy for determining ‘material’ subsidiaries is disclosed:
12. Other disclosures
a
b
c
Disclosures on materially significant related party transactions that may have potential conflict with the interest of company at large: Details of transactions with the related parties as specified in ing Standard 18 have been reported in the Financial Statements. There was no transaction of a material nature with any of the related parties which was in conflict with the interest of the Company.
The Board has approved a whistle-blower policy/ vigil mechanism which have been communicated to the employees. The policy provides a mechanism for employees to report their concerns about unethical behaviour, actual or suspected fraud or violation of Company’s code of conduct and provides safeguards against victimisation of employees who avail the mechanism. The policy permits reporting any concern relating to financial/ing matters and employees at the levels of Vice-Presidents and above as also the Ethics counsellors directly to the Chairman of the Audit Committee. For all other matters the concern can be reported to the Ethics counsellor of the Company. The policy with the name and address of Chairman of the Audit Committee has been circulated to the employees. No employee has been denied access to the Chairman of the Audit Committee.
The whistle Blower policy can be accessed at http:// www.tataglobalbeverages.com/docs/defaultsource/Investor-Governance-Policy-/whistle-blowerpolicy-and-vigil-mechanism-.pdf?sfvrsn=0
Details of compliance with mandatory requirements and adoption of the non-mandatory requirements:
d
122
http://www.tataglobalbeverages.com/docs/defaultsource/Investor-Governance-Policy-/policy-onsubsidiary.pdf?sfvrsn=0
f
Web link where policy on dealing with related party transactions is disclosed:
http://www.tataglobalbeverages.com/docs/ default-source/default-document-library/policy-onrelated-party8b14b6881a2368caa65dff02001c5be1. pdf?sfvrsn=0
g
Disclosure of commodity price risks and commodity hedging activities: Given in 10 (l)
h
Compliance with ing Standard:
In the preparation of the financial statements, the Company has followed the ing Standards specified under section 133 of the Companies Act, 2013 read with Rule 7 of the Companies (s) Rules, 2014 and ing Standard 30 on Financial Instrument to the extent it does not contradict with any other ing Standard. The significant ing policies which are consistently applied have been set out in the notes to the financial statements.
Corporate Overview 01-48
i
Non-compliance of any requirement of corporate governance report of sub-paras (2) to (10) of Schedule V (c) of the Securities and Exchange Board of India (Listing Obligations and Disclosure Requirements) Regulations, 2015: NIL.
j
Extent to which the discretionary requirements specified in Part E of Schedule II of Securities and Exchange Board of India (Listing Obligations and Disclosure Requirements) Regulations, 2015 have been adopted: Covered in 12 (d).
k
Disclosure with respect to demat suspense / unclaimed suspense : Not Applicable.
l
Name of the Debenture Trustees (in respect of 3,250 Secured Redeemable Non-Convertible Debentures of Rs. 10,000 each) with their details:
Company website link http://www.tataglobalbeverages. com/docs/default-source/default-document-library/policyon-related-party8b14b6881a2368caa65dff02001c5be1. pdf?sfvrsn=0
14) Subsidiary Companies
(Pursuant to Regulation 53 of the Securities and Exchange Board of India (Listing Obligations and Disclosure Requirements) Regulations, 2015)
m
SBICAP Trustee Company Limited Apeejay House, 6th Floor 3, Dinshaw Wachha Road Churchgate, Mumbai 400 020 Tel: 022 4302 5555; Fax: 022- 2204 0465.
The Company has duly complied with the requirements specified in Regulation 17 to 27 and clauses (b) to (i) of sub-regulation (2) of Regulation 46 of the Securities and Exchange Board of India (Listing Obligations and Disclosure Requirements) Regulations, 2015.
All transactions entered in to with related parties as defined under the Companies Act, 2013, Regulation 23 of the Securities and Exchange Board of India (Listing Obligations and Disclosure Requirements) Regulations, 2015 and erstwhile Clause 49 of the Listing Agreement during the financial year 2015-16 were in the ordinary course of business and on arm’s length pricing basis and do not attract provisions of Section 188 of the Companies Act, 2013. There were no materially significant transactions with the related parties during the financial year which were in conflict with the interest of Company. Suitable disclosures as required by ing standard (AS 18) have been made in the notes to the Financial Statements. The Board has approved a policy for related party transactions which can be accessed at the
The Company does not have any material non-listed Indian subsidiary whose income or net worth exceeds 20% of the consolidated income or net worth respectively of the Company in the immediately preceding ing year. However, in line with the requirements of the Securities and Exchange Board of India (Listing Obligations and Disclosure Requirements) Regulations, 2015, a policy to determine a material subsidiary has been framed and the same may be accessed on the Company’s website at the link http://www. tataglobalbeverages.com/docs/default-source/InvestorGovernance-Policy-/policy-on-subsidiary.pdf?sfvrsn=0 . The minutes of the Board meetings of unlisted subsidiary companies are placed in the Board meetings of the Company.
15) Insider Trading Regulations
13) Related Party Transactions
Financial Statements 125-220
Statutory Reports 49-124
After the Securities and Exchange Board of India had amended the Insider Trading Regulations in January 2015, which came into effect from 14th May, 2015, the Company has suitably revised the Tata Code of Conduct for Prevention of Insider Trading and Code of Corporate Disclosure practices which your Company has adopted. This code of conduct is applicable to all Directors, such identified employees of the Company who are expected to have access to unpublished price sensitive information relating to the Company and other connected persons. Mr. John Jacob, Chief Financial Officer of the Company, is the compliance officer for the purpose of these regulations.
16) Certificate on Corporate Governance
A Compliance certificate from Dr. Asim Kumar Chattopadhyay, Practicing Company Secretary pursuant to Schedule V of Securities and Exchange Board of India (Listing Obligations and Disclosure Requirements) Regulations, 2015 regarding compliance of conditions of corporate governance is attached. On behalf of the Board of Directors
Mumbai 24th May 2016
Cyrus P Mistry Chairman
123
Annual Report 2015-16
•
Connect with every sip
Declaration by the CEO on Code of Conduct as required by Schedule V of Securities and Exchange Board of India (Listing Obligations and Disclosure Requirements) Regulations, 2015 I, Ajoy Misra, Chief Executive Officer and Managing Director of the Company hereby declare that all the of Board of Directors and Senior Management Personnel have affirmed compliance with Code of Conduct, as applicable to them, in respect of the financial year 2015-16. For Tata Global Beverages Limited
Mumbai 24th May 2016
(Ajoy Misra) Chief Executive Officer and Managing Director
PRACTISING COMPANY SECRETARY’S CERTIFICATE ON CORPORATE GOVERNANCE UNDER SCHEDULE V(E) OF REGULATION 34(3) AND 53(f) OF THE SECURITIES AND EXCHANGE BOARD OF INDIA (LISTING OBLIGATIONS AND DISCLOSURE REQUIREMENTS) REGULATIONS, 2015 To the of Tata Global Beverages Limited I have examined the compliance of the conditions of Corporate Governance by Tata Global Beverages Limited (‘the Company’) for the year ended on 31st March 2016, as stipulated in Schedule V(E) of Regulation 34(3) and 53(f ) of the Securities and Exchange Board of India (Listing Obligations and Disclosure Requirements) Regulations, 2015. The compliance of the conditions of Corporate Governance is the responsibility of the management. My examination was limited to a review of procedures and implementation thereof, adopted by the Company for ensuring the compliance of the conditions of Corporate Governance. It is neither an audit nor an expression of opinion on the financial statements of the Company. In my opinion and to the best of my information and according to the explanations given to me, and the representations made by the Directors and the management, I certify that the Company has complied with the conditions of Corporate Governance as stipulated in the above mentioned Listing Agreement. I state that such compliance is neither an assurance as to the future viability of the Company nor of the efficiency or effectiveness with which the management has conducted the affairs of the Company. Dr. Asim Kumar Chattopadhyay Practising Company Secretary FCS No. 2303 No. 880 24th May 2016
124
Corporate Overview 01-48
Statutory Reports 49-124
Financial Statements 125-220
Independent Auditors’ Report TO THE OF TATA GLOBAL BEVERAGES LIMITED
Report on the Standalone Financial Statements 1.
We conducted our audit in accordance with the Standards on Auditing specified under Section 143(10) of the Act and other applicable authoritative pronouncements issued by the Institute of Chartered ants of India. Those Standards and pronouncements require that we comply with ethical requirements and plan and perform the audit to obtain reasonable assurance about whether the financial statements are free from material misstatement.
6.
An audit involves performing procedures to obtain audit evidence about the amounts and the disclosures in the financial statements. The procedures selected depend on the auditors’ judgment, including the assessment of the risks of material misstatement of the financial statements, whether due to fraud or error. In making those risk assessments, the auditor considers internal financial control relevant to the Company’s preparation of the financial statements that give a true and fair view, in order to design audit procedures that are appropriate in the circumstances. An audit also includes evaluating the appropriateness of the ing policies used and the reasonableness of the ing estimates made by the Company’s Directors, as well as evaluating the overall presentation of the financial statements.
7.
We believe that the audit evidence we have obtained is sufficient and appropriate to provide a basis for our audit opinion on the standalone financial statements.
We have audited the accompanying standalone financial statements of Tata Global Beverages Limited (“the Company”), which comprise the Balance Sheet as at March 31, 2016, the Statement of Profit and Loss, the Cash Flow Statement for the year then ended, and a summary of the significant ing policies and other explanatory information.
Management’s Responsibility for the Standalone Financial Statements 2.
5.
The Company’s Board of Directors is responsible for the matters stated in Section 134(5) of the Companies Act, 2013 (“the Act”) with respect to the preparation of these standalone financial statements to give a true and fair view of the financial position, financial performance and cash flows of the Company in accordance with the ing principles generally accepted in India, including the ing Standards specified under Section 133 of the Act, read with Rule 7 of the Companies (s) Rules, 2014 and ing Standard 30, Financial Instruments: Recognition and Measurement issued by the Institute of Chartered ants of India to the extent it does not contradict any other ing standard referred to in Section 133 of the Act read with Rule 7 of Companies (s) Rules, 2014. This responsibility also includes maintenance of adequate ing records in accordance with the provisions of the Act for safeguarding of the assets of the Company and for preventing and detecting frauds and other irregularities; selection and application of appropriate ing policies; making judgments and estimates that are reasonable and prudent; and design, implementation and maintenance of adequate internal financial controls, that were operating effectively for ensuring the accuracy and completeness of the ing records, relevant to the preparation and presentation of the financial statements that give a true and fair view and are free from material misstatement, whether due to fraud or error.
Auditors’ Responsibility 3.
Our responsibility is to express an opinion on these standalone financial statements based on our audit.
4.
We have taken into the provisions of the Act and the Rules made thereunder including the ing standards and matters which are required to be included in the audit report.
Opinion 8.
In our opinion and to the best of our information and according to the explanations given to us, the aforesaid standalone financial statements give the information required by the Act in the manner so required and give a true and fair view in conformity with the ing principles generally accepted in India, of the state of affairs of the Company as at March 31, 2016, and its profit and its cash flows for the year ended on that date.
Report on Other Legal and Regulatory Requirements 9.
As required by ‘the Companies (Auditor’s Report) Order, 2016’, issued by the Central Government of India in of sub-section (11) of section 143 of the Act (hereinafter referred to as the “Order”), and on the basis of such checks of the books and records of the Company as we considered appropriate and according to the information and explanations given to us, we give in the Annexure B a statement on the matters specified in paragraphs 3 and 4 of the Order.
125
Annual Report 2015-16
10.
As required by Section 143 (3) of the Act, we report that:
(a)
We have sought and obtained all the information and explanations which to the best of our knowledge and belief were necessary for the purposes of our audit.
(b)
In our opinion, proper books of as required by law have been kept by the Company so far as it appears from our examination of those books.
(c)
The Balance Sheet, the Statement of Profit and Loss, and the Cash Flow Statement dealt with by this Report are in agreement with the books of .
(d)
In our opinion, the aforesaid standalone financial statements comply with the ing Standards specified under Section 133 of the Act, read with Rule 7 of the Companies (s) Rules, 2014 and ing Standard 30, Financial Instruments: Recognition and Measurement issued by the Institute of Chartered ants of India to the extent it does not contradict any other ing standard referred to in Section 133 of the Act read with Rule 7 of Companies (s) Rules, 2014.
(e)
(f )
126
Connect with every sip
Company and the operating effectiveness of such controls, refer to our separate Report in Annexure A.
(g)
With respect to the other matters to be included in the Auditors’ Report in accordance with Rule 11 of the Companies (Audit and Auditors) Rules, 2014, in our opinion and to the best of our knowledge and belief and according to the information and explanations given to us:
i.
The Company has disclosed the impact, if any, of pending litigations as at March 31, 2016 on its financial position in its standalone financial statements – Refer Note [31];
ii.
The Company has made provision as at March 31, 2016, as required under the applicable law or ing standards, for material foreseeable losses, if any, on long-term contracts including derivative contracts;
iii.
There has been no delay in transferring amounts, required to be transferred, to the Investor Education and Protection Fund by the Company during the year ended March 31, 2016.
On the basis of the written representations received from the directors as on March 31, 2016 taken on record by the Board of Directors, none of the directors is disqualified as on March 31, 2016 from being appointed as a director in of Section 164 (2) of the Act. With respect to the adequacy of the internal financial controls over financial reporting of the
•
For Lovelock & Lewes Firm Registration Number: 301056E Chartered ants
Place: Mumbai Date : May 24, 2016
Dibyendu Majumder Partner hip Number: 057687
Corporate Overview 01-48
Statutory Reports 49-124
Financial Statements 125-220
Annexure A to Independent Auditors’ Report Referred to in paragraph [10 (f )] of the Independent Auditors’ Report of even date to the of Tata Global Beverages Limited on the standalone financial statements for the year ended March 31, 2016
4.
Our audit involves performing procedures to obtain audit evidence about the adequacy of the internal financial controls system over financial reporting and their operating effectiveness. Our audit of internal financial controls over financial reporting included obtaining an understanding of internal financial controls over financial reporting, assessing the risk that a material weakness exists, and testing and evaluating the design and operating effectiveness of internal control based on the assessed risk. The procedures selected depend on the auditor’s judgement, including the assessment of the risks of material misstatement of the financial statements, whether due to fraud or error.
5.
We believe that the audit evidence we have obtained is sufficient and appropriate to provide a basis for our audit opinion on the Company’s internal financial controls system over financial reporting.
Report on the Internal Financial Controls under Clause (i) of Sub-section 3 of Section 143 of the Act 1.
We have audited the internal financial controls over financial reporting of Tata Global Beverages Limited (“the Company”) as of March 31, 2016 in conjunction with our audit of the standalone financial statements of the Company for the year ended on that date.
Management’s Responsibility for Internal Financial Controls 2.
The Company’s management is responsible for establishing and maintaining internal financial controls based on the internal control over financial reporting criteria established by the Company considering the essential components of internal control stated in the Guidance Note on Audit of Internal Financial Controls Over Financial Reporting issued by the Institute of Chartered ants of India (ICAI). These responsibilities include the design, implementation and maintenance of adequate internal financial controls that were operating effectively for ensuring the orderly and efficient conduct of its business, including adherence to company’s policies, the safeguarding of its assets, the prevention and detection of frauds and errors, the accuracy and completeness of the ing records, and the timely preparation of reliable financial information, as required under the Act.
Meaning of Internal Financial Controls Over Financial Reporting 6.
Auditors’ Responsibility 3.
Our responsibility is to express an opinion on the Company’s internal financial controls over financial reporting based on our audit. We conducted our audit in accordance with the Guidance Note on Audit of Internal Financial Controls Over Financial Reporting (the “Guidance Note”) and the Standards on Auditing deemed to be prescribed under section 143(10) of the Act to the extent applicable to an audit of internal financial controls, both applicable to an audit of internal financial controls and both issued by the ICAI. Those Standards and the Guidance Note require that we comply with ethical requirements and plan and perform the audit to obtain reasonable assurance about whether adequate internal financial controls over financial reporting was established and maintained and if such controls operated effectively in all material respects.
A company’s internal financial control over financial reporting is a process designed to provide reasonable assurance regarding the reliability of financial reporting and the preparation of financial statements for external purposes in accordance with generally accepted ing principles. A company’s internal financial control over financial reporting includes those policies and procedures that (1) pertain to the maintenance of records that, in reasonable detail, accurately and fairly reflect the transactions and dispositions of the assets of the company; (2) provide reasonable assurance that transactions are recorded as necessary to permit preparation of financial statements in accordance with generally accepted ing principles, and that receipts and expenditures of the company are being made only in accordance with authorisations of management and directors of the company; and (3) provide reasonable assurance regarding prevention or timely detection of unauthorised acquisition, use, or disposition of the company’s assets that could have a material effect on the financial statements.
Inherent Limitations of Internal Financial Controls Over Financial Reporting 7.
Because of the inherent limitations of internal financial controls over financial reporting, including the possibility of collusion or improper management override of controls, material misstatements due to error or fraud may occur and not be detected. Also, projections of any evaluation of the internal financial controls over financial reporting
127
Annual Report 2015-16
to future periods are subject to the risk that the internal financial control over financial reporting may become inadequate because of changes in conditions, or that the degree of compliance with the policies or procedures may deteriorate.
In our opinion, the Company has, in all material respects, an adequate internal financial controls system over financial reporting and such internal financial controls over financial reporting were operating effectively as at March 31, 2016, based on the internal control over financial reporting criteria established by the Company considering
128
Connect with every sip
the essential components of internal control stated in the Guidance Note on Audit of Internal Financial Controls Over Financial Reporting issued by the Institute of Chartered ants of India. For Lovelock & Lewes Firm Registration Number: 301056E Chartered ants
Opinion 8.
•
Place: Mumbai Date : May 24, 2016
Dibyendu Majumder Partner hip Number: 057687
Corporate Overview 01-48
Statutory Reports 49-124
Financial Statements 125-220
Annexure B to Independent Auditors’ Report Referred to in paragraph [9] of the Independent Auditors’ Report of even date to the of Tata Global Beverages Limited on the standalone financial statements as of and for the year ended March 31, 2016 i.
(a)
(b)
(c)
The Company is maintaining proper records showing full particulars, including quantitative details and situation, of fixed assets. The fixed assets are physically verified by the Management according to a phased programme designed to cover all the items over a period of 3 years which, in our opinion, is reasonable having regard to the size of the Company and the nature of its assets. Pursuant to the programme, a portion of the fixed assets has been physically verified by the Management during the year and no material discrepancies have been noticed on such verification. The title deeds of immovable properties, as disclosed in Note 12 on fixed assets to the financial statements, are held in the name of the Company.
ii.
The physical verification of inventory excluding stocks with third parties have been conducted at reasonable intervals by the Management during the year. In respect of inventory lying with third parties, these have substantially been confirmed by them. The discrepancies noticed on physical verification of inventory as compared to book records were not material.
iii.
The Company has not granted any loans, secured or unsecured, to companies, firms, Limited Liability Partnerships or other parties covered in the maintained under Section 189 of the Act. Therefore, the provisions of Clause 3(iii), (iii)(a), (iii)(b) and (iii)(c) of the said Order are not applicable to the Company.
iv.
In our opinion, and according to the information and explanations given to us, the Company has complied with the provisions of Section 185 and 186 of the Companies Act, 2013 in respect of the loans and investments made, and guarantees and security provided by it.
v.
The Company has not accepted any deposits from the public within the meaning of Sections 73, 74, 75 and 76 of the Act and the Rules framed there under to the extent notified.
vi.
Pursuant to the rules made by the Central Government of India, the Company is required to maintain cost records as specified under Section 148(1) of the Act in respect of its products. We have broadly reviewed the same, and are of the opinion that, prima facie, the prescribed s and records have been made and maintained. We have not, however, made a detailed examination of the records with a view to determine whether they are accurate or complete.
vii.
(a)
According to the information and explanations given to us and the records of the Company examined by us, in our opinion, the Company is generally regular in depositing undisputed statutory dues in respect of provident fund and service tax and is regular in depositing undisputed statutory dues, including employees’ state insurance, sales tax, income tax, duty of customs, duty of excise, value added tax, cess and other material statutory dues, as applicable, with the appropriate authorities.
(b)
According to the information and explanations given to us and the records of the Company examined by us, there are no dues of duty of customs, duty of excise which have not been deposited on of any dispute. The particulars of dues of income tax, sales tax, service tax, value added tax and cess as at March 31, 2016 which have not been deposited on of a dispute, are as follows:
129
Annual Report 2015-16
•
Connect with every sip
Name of the statute
Nature of dues
Amount Period to which Forum where the dispute is pending (In Crores) the amount relates
Income Tax Act, 1961
Income Tax
2.18 2004-05, 2007 - 08 and 2008-09
Commissioner of Income Tax (Appeals), Kochi
Income Tax Act, 1961
Income Tax
0.01 2009-10
Income Tax Appellate Tribunal, New Delhi
Kerala General Sales Tax Act, 1963
Sales Tax
0.12 1998-99
Sales Tax Appellate Tribunal, Ernakulam
Kerala General Sales Tax Act, 1963
Sales Tax
0.44 (*) 1996-97 to 2000-01, 2002-03
Deputy Commissioner (Appeals), Commercial Taxes, Ernakulam
Kerala Value Added Tax, 2003
Value Added Tax
0.31 (*) 2010-11
Deputy Commissioner (Appeals), Commercial Taxes, Ernakulam
West Bengal Sales Tax Act, 1994
Sales Tax
Central Sales Tax Act, 1956
Sales Tax
Central Sales Tax Act, 1956
Sales Tax
Central Sales Tax Act, 1956
Sales Tax
0.01 2010-11
t Commissioner of Sales Tax, Maharashtra
Karnataka Sales Tax Act,1957
Sales Tax
1.28 1997-98
The Supreme Court of India
Tamil Nadu General Sales Tax Act, 1959
Sales Tax
0.57 (*) 1998-99 to 2006-07
The High Court of Madras
Central Sales Tax Act, 1956
Sales Tax
2.08 (*) 2010-11 to 2013-14
Deputy Commissioner Indore, Madhya Pradesh
Central Sales Tax Act, 1956
Sales Tax
0.94 2012-13
Central Sales Tax Act, 1956
Sales Tax
1.69 (*) 2012-13
West Bengal Value Added Tax Act, 2003
Value Added Tax
1.36 2007-08 & 2008-09
The West Bengal Commercial Taxes Appellate and Revisional Board, Kolkata
Maharashtra Value Added Tax Act, 2002
Value Added Tax
0.02 2008-09
t Commissioner of Sales Tax, Maharashtra
Karnataka Value Added Tax Act, 2003
Value Added Tax
Goa Value Added Tax Act, 2005
Value Added Tax
Central Sales Tax Act, 1956
Sales Tax
0.02 1998-99 & 2000-01
The West Bengal Commercial Taxes Appellate and Revisional Board, Kolkata
0.12 1998-99
Sales Tax Appellate Tribunal, Ernakulam
0.50 (*) 1999-00, 2000-01, 2002-03, 2006-07 and 2011-12
0.06 (*) 2006-07, 2009-10 and 2012-13 0.01 2006-07 0.05 (*) 2012-13
Deputy Commissioner (Appeals), Commercial Taxes, Ernakulam
Assistant Commissioner, Andhra Pradesh Senior t Commissioner of Commercial tax, Kolkata, West Bengal
The t Commissioner (Appeals), Commercial Taxes, Karnataka Commissioner of commercial taxes, Goa. Deputy Commissioner Appeals, Coimbatore
Tamil Nadu Value Added Tax Act 2006 Value Added Tax
- (*) 2014-15
Additional Commissioner, Coimbatore
Andhra Pradesh Value Added Tax Act, Value Added 2005 Tax
- (*) 2005-06
Sales Tax Appellate Tribunal, Hyderabad
2.06 2010-11
The High Court of Madhya Pradesh
Madhya Pradesh Entry Tax Act, 1976
Entry Tax
Madhya Pradesh Entry Tax Act, 1976
Entry Tax
130
0.82 (*) 2003-04, 2005- 06 to 2011-12
The Supreme Court of India
Corporate Overview 01-48
Statutory Reports 49-124
Name of the statute
Nature of dues
Tamil Nadu Panchayat Act,1994
Cess on Land Revenue
Finance Act, 1994
Service Tax
1.46 (*) 2005-06
Financial Statements 125-220
Amount Period to which Forum where the dispute is pending (In Crores) the amount relates 0.05 2000-2001 to 2002-2003
The High Court of Madras Custom Excise & Service Tax Appellate Tribunal, Kolkata
Finance Act, 1994
Service Tax
0.19 (*) 2013-14 and 2014-15 Commissioner Appeals, Bangalore
Finance Act, 1994
Service Tax
0.01 2008-09 and 2009-10 Commissioner Appeals, Kolkata
Finance Act, 1994
Service Tax
- (*) April 2015 to June 2015
Assistant Commissioner- Central Excise and Customs- Kochi
(*) Net of amounts paid of Rs. 8.23 Crores.
viii.
According to the records of the Company examined by us and the information and explanation given to us, the Company has not defaulted in repayment of loans or borrowings to any financial institution or bank or Government or dues to debenture holders as at the balance sheet date.
ix.
The Company has not raised any moneys by way of initial public offer, further public offer (including debt instruments) and term loans. Accordingly, the provisions of Clause 3(ix) of the Order are not applicable to the Company.
x.
xi.
xii.
During the course of our examination of the books and records of the Company, carried out in accordance with the generally accepted auditing practices in India, and according to the information and explanations given to us, we have neither come across any instance of material fraud by the Company or on the Company by its officers or employees, noticed or reported during the year, nor have we been informed of any such case by the Management. The Company has paid/ provided for managerial remuneration in accordance with the requisite approvals mandated by the provisions of Section 197 read with Schedule V to the Act.
xiii.
The Company has entered into transactions with related parties in compliance with the provisions of Sections 177 and 188 of the Act. The details of such related party transactions have been disclosed in the financial statements as required under ing Standard (AS) 18, Related Party Disclosures specified under Section 133 of the Act, read with Rule 7 of the Companies (s) Rules, 2014.
xiv.
Company has not made any preferential allotment or private placement of shares or fully or partly convertible debentures during the year under review. Accordingly, the provisions of Clause 3(xiv) of the Order are not applicable to the Company.
xv.
The Company has not entered into any non-cash transactions with its directors or persons connected with him. Accordingly, the provisions of Clause 3(xv) of the Order are not applicable to the Company.
xvi.
The Company is not required to be ed under Section 45-IA of the Reserve Bank of India Act, 1934. Accordingly, the provisions of Clause 3(xvi) of the Order are not applicable to the Company. For Lovelock & Lewes Firm Registration Number: 301056E Chartered ants
As the Company is not a Nidhi Company and the Nidhi Rules, 2014 are not applicable to it, the provisions of Clause 3(xii) of the Order are not applicable to the Company. Place: Mumbai Date : May 24, 2016
Dibyendu Majumder Partner hip Number: 057687
131
Annual Report 2015-16
•
Connect with every sip
Balance Sheet As at March 31, 2016
Note Equity and Liabilities Shareholders' Funds Share Capital Reserves and Surplus Share Suspense Non-Current Liabilities Long-Term Borrowings Other Long-Term Liabilities Long-Term Provisions Current Liabilities Short-Term Borrowings Trade Payables (includes dues of Micro and Small enterprises Rs. 3.99 Crores (Rs. 1.42 Crores)) Other Current Liabilities Short-Term Provisions Total Assets Non-Current Assets Fixed Assets Tangible Assets Intangible Assets Capital work-in-progress Intangible Assets under development Non-Current Investments Deferred Tax Assets (net) Long-Term Loans and Advances Other Non-Current Assets Current Assets Inventories Trade Receivables Cash and Bank Balances Short-Term Loans and Advances Other Current Assets Total Summary of Significant ing Policies The Notes are an integral part of the Financial Statements.
3 4
63.11 2832.79
5 6 7
177.87
8 9
52.61 198.38
10 11
544.95 195.21
2895.90 -
177.87
991.15 4064.92
13 14 15 16
183.21 16.05 10.10 209.36 2264.34 39.48 120.50 70.50
17 18 19 20 21
889.71 124.09 239.20 104.47 3.27
2
-
2704.18
1360.74 4064.92
For Lovelock & Lewes Firm Registration No. 301056E Chartered ants
Cyrus P Mistry Chairman L Krishnakumar Executive Director V Leeladhar Director John Jacob Chief Financial Officer
132
325.00 72.54 114.02
2500.38 1.27
511.56
153.48 192.61
642.47 3655.68
12
For and on behalf of the Board
Mumbai May 24, 2016
61.84 2438.54
152.50 143.88
This is the Balance Sheet referred to in our Report of even date.
Dibyendu Majumder Partner hip No. 057687
Rs. in Crores 2015
2016
168.91 24.43 11.09 0.18 204.61 2231.86 45.75 71.79 70.50 819.27 93.62 21.01 93.36 3.91
2624.51
1031.17 3655.68
Ajoy Misra Managing Director Harish Bhat Director Darius Pandole Director V Madan Company Secretary
Corporate Overview 01-48
Financial Statements 125-220
Statutory Reports 49-124
Statement of Profit and Loss For the year ended March 31, 2016
Rs. in Crores Note
2016
2015
Income Revenue from Operations (Gross)
22
Less: Excise duty Revenue from Operations (Net) Other Income
23
3090.74
2884.76
(6.82)
(0.24)
3083.92
2884.52
106.57
155.16
Total Revenue
3190.49
3039.68
Expenses 24
1888.96 11.93
1.53
25
(3.95)
(27.99)
Employee Benefits Expense
26
186.88
161.92
Finance Costs
27
29.61
34.19
22.79
19.94
28
657.87
559.25
Cost of Materials Consumed Purchases of Stock in Trade Change in Inventories of Finished Goods/Stock-in-trade/Work-inprogress
Depreciaton and Amortization Expense Other Expenses Total Expenses
2794.09
Profit before Exceptional Items and Taxes Exceptional Items (Net)
1872.87
29
Profit before Tax
2621.71
396.40
417.97
264.57
(68.92)
660.97
349.05
Tax Expenses Current Tax (Refer Note 37)
130.03
55.91
Less: MAT Credit Entitlement
(39.00)
-
91.03
55.91
6.27
4.14
Net Current Tax Deferred Tax Profit for the year
97.30
60.05
563.67
289.00
8.93
4.58
Earning per Equity Share (Nominal Value per share Re. 1 each) Basic and Diluted (Refer Note 39) The Notes are an integral part of the Financial Statements. This is the Statement of Profit and Loss referred to in our Report of even date.
For and on behalf of the Board
For Lovelock & Lewes Firm Registration No. 301056E Chartered ants
Cyrus P Mistry Chairman L Krishnakumar Executive Director V Leeladhar Director John Jacob Chief Financial Officer
Dibyendu Majumder Partner hip No. 057687
Ajoy Misra Managing Director Harish Bhat Director Darius Pandole Director V Madan Company Secretary
Mumbai May 24, 2016
133
Annual Report 2015-16
•
Connect with every sip
Cash Flow Statement For the year ended March 31, 2016 Rs. in Crores A.
2016
2015
660.97
349.05
Cash Flow from Operating Activities Net Profit before Tax Adjusted for : Depreciation and Amortisation Dividend Income
22.79
19.94
(97.98)
(137.07)
Unrealised Exchange Loss / (Gain)
(0.23)
0.48
Finance Cost
29.61
34.19
Interest Income
(7.14)
(17.50)
Profit on sale of Current Investments (net)
(0.14)
(0.11)
Liabilities no longer required written back
(18.09)
(24.74)
1.78
-
(Profit)/Loss on sale / discard of Fixed Assets (net)
(0.94)
0.14
Exceptional item
10.97
6.99
-
38.24
52.25
23.69
Provision for Doubtful Debts/Advances
Provision on Investment Provision for obligations relating to a Overseas Subsidiary Company Profit on Sale of Long-Term Trade Investments
(327.79)
Operating Profit before working capital changes
(334.91)
(55.75)
326.06
293.30
Adjustments for : Trade Receivables
(32.12)
Other Receivables
(27.14)
(0.11)
Inventories
(70.44)
(181.58)
Trade Payables
24.33
76.64
21.03 (53.06) 273.00
Cash generated from Operations Direct Taxes paid (net)
(141.52)
Net Cash from / (used in) Operating Activities B.
(136.33) 156.97 (106.75)
(141.52)
(106.75)
131.48
50.22
Cash Flow from Investing Activities Purchase of Fixed Assets Sale of Fixed Assets
(37.07)
(47.23)
3.47
0.83
(0.31)
(2.09)
Sale/Redemption of Long-Term Investments
336.64
-
Investment in t Ventures
(41.00)
(75.00)
0.14
0.11
97.98
137.07
7.63
20.97
12.75
91.50
Purchase of Long-Term Investments
Placement / Redemption of Current Investments (net) Dividend Income Interest Income received Inter Corporate Deposits & Loans Redeemed Net Cash from / (used in) Investing Activities
134
380.23
126.16
Corporate Overview 01-48
Financial Statements 125-220
Statutory Reports 49-124
Rs. in Crores 2016 C.
2015
Cash Flow from Financing Activities (99.89)
20.98
(142.00)
(139.14)
Dividend Tax paid
(22.36)
(13.70)
Finance Cost
(29.52)
(34.22)
Working Capital Facilities (net) Dividend paid
Net Cash from / (used in) Financing Activities Net increase / (decrease) in Cash and Cash Equivalents D.
(293.77)
(166.08)
217.94
10.30
14.96
2.29
-
2.37
232.90
14.96
Cash and Cash Equivalents Opening Balance Cash & Bank balance acquired on amalgamation Balances at the end of the year Cash and Cash Equivalent comprises of: 0.02
0.02
Balances in Current and Mutual Funds
232.88
14.94
Balances at the end of the year
232.90
14.96
Cash and Cheques in hand
Notes: 1.
The above Cash Flow Statement has been prepared under the ‘ Indirect Method’ as set out in the ing Standard on ‘ Cash Flow Statements (AS-3) ‘ issued by Companies (ing Standards) Rules, 2006.
2.
Previous year’s figures have been rearranged/regrouped wherever necessary.
This is the Cash Flow Statement referred to in our Report of even date.
For and on behalf of the Board
For Lovelock & Lewes Firm Registration No. 301056E Chartered ants
Cyrus P Mistry Chairman L Krishnakumar Executive Director V Leeladhar Director John Jacob Chief Financial Officer
Dibyendu Majumder Partner hip No. 057687
Ajoy Misra Managing Director Harish Bhat Director Darius Pandole Director V Madan Company Secretary
Mumbai May 24, 2016
135
Annual Report 2015-16
•
Connect with every sip
Notes forming part of the Financial Statements 1.
General Information:
Tata Global Beverages Limited (“the holding company”) and its subsidiaries, t ventures and associates (together, “the Group”) is a global beverages company engaged in the trading, production and distribution of Tea, Coffee and Water. The group has branded beverage business operations mainly in India, Europe, US, Canada and Australia, plantation business in India/Sri Lanka and extraction business mainly in lndia, US and China.
2.
Subsidies receivable from government in respect of fixed assets are deducted from the cost of respective assets as and when they accrue.
Depreciation is provided on tangible asset including asset created on lands under lease on a monthly straight line basis over the estimated useful life of the asset or as prescribed in Schedule II to the Companies Act, 2013.
Renewal of land leases is assumed, consistent with past practice.
Management’s estimates of the useful lives of certain assets are as follows:
Significant ing Policies: (a) ing Convention
(b)
The financial statements have been prepared in accordance with the historical cost convention on an accrual basis and comply with the applicable ing Standards specified under section 133 of the Companies Act, 2013 read with Rule 7 of the Companies (s) Rules, 2014 and ing Standard 30 on Financial Instrument to the extent it does not contradict with any other ing Standard. These Financial Statements have been prepared as required under relevant provision of the Companies Act, 2013 and the presentation is based on the Schedule III of the Companies Act, 2013. All assets and liabilities are classified into current and noncurrent generally based on the criteria of realisation/ settlement within twelve months period from the balance sheet date.
Fixed Assets and Depreciation
i) Tangible: Tangible Assets are carried at cost of acquisition less accumulated depreciation and accumulated impairment loss, if any. Subsequent expenditure related to an item of fixed asset are added to its book value only if they increase the future benefits from the existing asset beyond its previously assessed standard of performance. The cost of extension planting of cultivable land including cost of development is capitalised.
136
Assets acquired on hire purchase, for which ownership will vest at a future date, are capitalised at cash cost.
Computers, Printers and Other Office Equipments
4 years
Air Conditioners
10 years
Plant and Machinery
20 - 25 years
Leasehold improvements
Over the life of lease
For the above class of assets, based on internal assessment and independent technical evaluation, management believes that the useful lives as given above best represents the period over which the asset would be used.
ii) Intangible: Intangible Assets are stated at acquisition cost, net of accumulated amortisation and accumulated impairment loss, if any.
Expenditure on software and related implementation costs are capitalized where it is expected to provide enduring economic benefits and are amortised on a monthly basis over a period of five years.
Non-compete fees paid on acquisition of business is being amortised on monthly basis over a period of ten years.
Corporate Overview 01-48
Statutory Reports 49-124
Financial Statements 125-220
Notes forming part of the Financial Statements
recognised in the statement of profit and loss on a straight- line basis over the period of lease.
(e)
At each balance sheet date, the management assess whether there is any indication that the assets are impaired. If any such indication exists, the recoverable amount of the asset is estimated in order to determine the extent of impairment loss. Recoverable amount is the higher of an asset’s net selling price and its value in use. In assessing value in use, the estimated future cash flows expected from the continuing use of the asset and from its disposal are discounted to their present value using a pretax discount rate that reflects the current market assessments of time value of money and the risks specific to the asset. Cash flows used to determine value in use are derived from the annual budgets and strategic plans of the cash generating units. For certain cash generating units, variable growth may be considered even beyond the period of five years, having regard to factors like maturity of the business and scope for geographical expansion.
Borrowing cost includes interest, ancillary costs incurred in connection with the arrangement of borrowings and exchange difference arising from foreign currency borrowings to the extent they are regarded as adjustment to the interest cost.
Borrowing costs that are directly attributable to the acquisition, construction or production of qualifying assets are capitalised. The other costs are charged to the statement of profit and loss. Discount on Commercial Paper is amortised on straight line basis over its tenure.
(f) Investments
Reversal of impairment loss is recognised as income in the statement of profit and loss.
Assets taken on lease by the Company in its capacity as lessee, where the Company has substantially assumed all risks and rewards of ownership are classified as finance lease. Such a lease is capitalised at the inception of the lease period at lower of fair value or present value of the minimum lease payments and a liability is recognised for an equivalent amount. Each lease rental paid is allocated between the liability and the interest cost, so as to obtain a constant periodic rate of interest on the outstanding liability for each year. Lease arrangements where the risks and rewards incidental to ownership of an asset substantially vests with the lessor, are recognised as operating leases. Lease rental under operating leases are
Investments of a long-term nature are stated at cost, less adjustment for any diminution, other than temporary, in the value thereof. Current investments are stated at lower of cost or fair value.
(g) Inventories
(d) Leases
Borrowing Costs
(c) Impairment
Product development cost incurred on new products having enduring benefits is recognised as Intangible Assets and are amortised on a monthly basis over a period of ten years.
(h)
Inventories are stated at lower of cost or net realisable value. Cost is determined on weighted average method for all categories of inventories other than for auction/privately bought teas in which case cost is considered as actual cost for each lot. Cost comprises expenditure incurred in the normal course of business in bringing such inventories to its present location and condition, where applicable, appropriate overheads based on normal level of activity. Provision is made for obsolescence and other anticipated losses wherever considered necessary.
Foreign Currency Transactions Transactions in foreign currencies are recorded at average fortnightly spot rates. The exchange difference resulting from settled transactions is recognised in the statement of profit and loss. Year end balances of monetary items are restated at the year end exchange rates and the resultant net gain or loss is recognised in the statement of profit and loss.
137
Annual Report 2015-16
•
Connect with every sip
Notes forming part of the Financial Statements
or discount on forward contracts where there are underlying assets /liabilities are amortised over the life of the contract. Such foreign exchange forward contracts are revalued at the balance sheet date and the exchange difference between the spot rate at the date of the contract and the spot rate on the balance sheet date is recognised as gain/loss in the statement of profit and loss.
Revenue Recognition
(i)
(i)
Sales are recognised when the significant risks and rewards of ownership in the goods are transferred to the buyer as per of the contract .
(ii)
Income and fees from services are ed as per of relevant contractual agreements/arrangements.
(iii)
Export incentives are ed on accrual basis.
Other Income
(j)
Interest income and income from investments are ed on accrual basis.
Dividend income is recognised when the right to receive dividend is established.
(l)
Post retirement defined benefits including gratuity, pension and medical benefits for qualifying executives / wholetime directors as provided by the Company are determined through independent actuarial valuation at year end and charge recognised in the statement of profit and loss. For schemes, where recognised funds have been set up, annual contributions determined as payable in the actuarial valuation report are contributed. Actuarial gains and losses are recognised in the statement of profit and loss.
The Company recognizes in the statement of profit and loss, gains or losses on settlement of a defined benefit plan as and when the settlement occurs.
ii)
Other Employee Benefits: Other employee benefits are ed for on accrual basis. Liabilities for compensated absences are determined based on independent actuarial valuation at year end and charge is recognised in the statement of profit and loss. Short term Employee Benefits are recognised on an undiscounted basis whereas Long Term Employee Benefits are recognised on a discounted basis.
iii)
Other Employee Termination Benefits: Payments to employees on termination along with additional liabilities towards retirement benefits arising pursuant to the termination are charged to the statement of profit and loss in the year in which it is incurred.
(k) Replanting/Rejuvenation
Plans. In respect of PF contribution made to a Self istered Trust, the Company is liable for annual contributions and any shortfall in the fund assets based on the government specified minimum rates of return, such contribution and shortfall, if any is recognized as an expense in the year incurred.
Cost of replanting/rejuvenating tea bushes/fuel trees is charged to revenue. Related Tea Board subsidies are accrued as Other Income on obtaining approval from Tea Board.
Compensation of Land Compensation, if any, in respect of land surrendered or incidental rights thereto/vested in Governments under various State Land Legislations is ed for as and when received.
(m) Employee Benefits
i)
138
Post retirement employee benefits: Post retirement benefits like Provident Fund which are in the nature of defined benefit plans and also Superannuation schemes, in the nature of defined contribution plans, are maintained by the Company and for certain categories contributions are made to State
(n)
Research and Development Research and Development expenditure of revenue nature is charged to revenue and capital expenditure is included under fixed assets.
Corporate Overview 01-48
Statutory Reports 49-124
Financial Statements 125-220
Notes forming part of the Financial Statements
(o) Taxes on Income
Current Income Tax is measured at the amount expected to be paid to the tax authorities in accordance with Income Tax Act, 1961.
Deferred tax is recognised for all the timing differences, subject to the consideration of prudence in respect of deferred tax assets.
Deferred tax assets are recognised and carried forward only to the extent that there is a reasonable certainty that sufficient future taxable income will be available against which such deferred tax assets can be realised.
(p)
Fair value hedges are marked to market on balance sheet date and gain or loss recognised in the statement of profit and loss.
(q)
(r) Provisions
Financial Instruments
The Company uses foreign currency forward contracts and options to hedge its risks associated with foreign currency fluctuations relating to certain firm commitments and highly probable transactions. The Company designates these hedging instruments as cash flow hedges.
Hedging instruments are initially measured at fair value and are remeasured at subsequent reporting dates. Gain or loss on of change in the fair value of hedging instruments in respect of effective portion of cash flow hedges are recognised in the hedging reserve . On occurrence of the underlying transactions the accumulated balance is transferred from hedging reserve and recognised in the statement of profit and loss. The portion of the gain or loss on the hedging instruments if determined to be an ineffective cash flow hedge is recognised in the statement of profit and loss.
Cash and Cash Equivalent Cash and Cash equivalents for the purpose of cash flow statement comprise of cash at bank and in hand and short term investments/bank deposits with an original maturity of three months or less.
(s)
Provisions are recognised when there is a present obligation as a result of past event and it is probable that an outflow of resources embodying economic benefits will be required to settle the obligation and a reliable estimate can be made of the amount of the obligation. Provisions are measured at the best estimate of the expenditure required to settle the obligation at the reporting date and are not discounted to its present value. These estimates are reviewed at each reporting date and adjusted to reflect the current best estimates.
Contingent Liabilities Contingent liabilities exist when there is a possible obligation arising from past events, the existence of which will be confirmed only by the occurrence or non occurrence of one or more uncertain future events not wholly within the control of the Company, or a present obligation that arises from past events where it is either not probable that an outflow of resources will be required or the amount cannot be reliably estimated. Contingent liabilities are appropriately disclosed unless the possibility of an outflow of resources embodying economic benefits is remote.
139
Annual Report 2015-16
•
Connect with every sip
Notes forming part of the Financial Statements Rs. in Crores 2016
2015
110.00
75.00
63.11
61.84
63.11
61.84
2016
2015
No. of shares
No. of shares
% of holding
% of holding
142854570
142854570
22.63%
23.10%
54416998
31213954
8.62%
5.05%
43175140
43175140
6.84%
6.98%
2016
2015
618398570
618398570
12731159
-
631129729
618398570
3. Share Capital AUTHORISED 110,00,00,000 (75,00,00,000) Equity Shares of Re. 1 each* ISSUED, SUBSCRIBED AND PAID-UP 63,11,29,729 (61,83,98,570) Equity Shares of Re. 1 each, fully paid-up*
a) The details of Shareholders holding more than 5% shares as at March 31, 2016 is set out below : Name of Shareholder
Tata Sons Limited Life Insurance Corporation of India Tata Chemicals Limited b)The reconciliation of the number of shares as at March 31, 2016 is set out below: Particulars Number of shares as at the beginning of the year Add: Shares issued during the year consequent to amalgamation Number of shares as at the end of the year c) Rights, preferences and restrictions attached to shares
The Company has one class of equity shares having a par value of Re. 1 each. Each shareholder is eligible for one vote per share held. The dividend proposed by the Board of Directors is subject to the approval of the shareholders in the ensuing Annual General Meeting, except in case of interim dividend. In the event of liquidation, the equity shareholders are eligible to receive the remaining assets of the Company after distribution of all preferential amounts, in proportion to their shareholding. *Consequent to and as part of the amalgamation of the erstwhile Mount Everest Mineral Water Limited with the Company ,the Authorised Share Capital of the Company stands increased to Rs. 110 Crores made up of 110,00,00,000 Equity Shares of Re. 1/- each with effect from May 18, 2015(effective date of Merger). Pursuant to this amalgamation, the Company during the year has issued 12731159 equity shares which was ed under Shares Suspense in the previous year (Refer Note 34a).
140
Corporate Overview 01-48
Statutory Reports 49-124
Financial Statements 125-220
Notes forming part of the Financial Statements 2016
Rs. in Crores 2015
4. Reserves and Surplus Capital Reserve Opening Balance 15.79 0.09 Add: Addition on Amalgamation (Refer Note 34a) 15.70 Closing Balance 15.79 15.79 Securities Opening Balance 333.79 552.93 Add: Addition on Amalgamation (Refer Note 34a) 86.89 Less: Deduction on Amalgamation (Refer Note 34a) (306.03) Closing Balance 333.79 333.79 Debenture Redemption Reserve Opening Balance 81.25 81.25 Closing Balance 81.25 81.25 Revaluation Reserve Opening Balance 21.86 21.86 Closing Balance 21.86 21.86 Contingency Reserve Opening Balance 1.00 1.00 Closing Balance 1.00 1.00 Hedging Reserve Opening Balance 5.16 3.50 Add: Movement during the year (net) (5.06) 1.66 Closing Balance 0.10 5.16 General Reserve Opening Balance 1059.34 1030.44 Add: Transferred from surplus in statement of profit and loss 56.37 28.90 Closing Balance 1115.71 1059.34 Surplus in the statement of profit and loss Opening Balance 920.35 820.35 Add: Profit for the year 563.67 289.00 Add: Profit of Amalgamating Company (Refer Note 34a) 2.39 Amount available for appropriation 1484.02 1111.74 Appropriations Adjustments on evaluation of useful life of Fixed Assets 0.72 Proposed Dividend 142.00 142.00 Provision for Dividend Distribution Tax * 22.36 19.77 Transferred to General Reserve 56.37 28.90 Net Surplus in the statement of profit and loss 1263.29 920.35 Total Reserves and Surplus 2832.79 2438.54 *For the purpose of computation of Dividend Distribution Tax (DDT) on the proposed dividend, the Company has reduced DDT on the dividend received from its Indian subsidiaries and foreign subsidiaries on which tax has been paid under section 115-O and section 115-BBD of the Income tax act,1961. Accordingly, provision for dividend distribution tax (DDT) for the current year is net of DDT credit/ writeback of Rs. 7.35 Crores (Rs. 9.94 Crores) relating to current/earlier years.
141
Annual Report 2015-16
•
Connect with every sip
Notes forming part of the Financial Statements Rs. in Crores 2016
2015
325.00
325.00
(325.00)
-
-
325.00
5. Long-Term Borrowings Secured Loans 3250 (3250), 3 % Non-Convertible, privately placed, Debentures of Rs. 10 Lakhs each. Less: Maturing in next 12 months Redeemable at of Rs. 223205 per debenture on 22.10.2016, at the end of 3 years from the date of allotment 22.10.2013. Secured by way of a first mortgage on certain immovable assets of the company and partly by pledge of shares of certain companies held as investments.
Rs. in Crores 2016
2015
72.54
72.54
(72.54)
-
-
72.54
6. Other Long-Term Liabilities Payable on Redemption of Debentures Less: Payable in next 12 months
Rs. in Crores 2016
2015
101.93
90.33
75.94
23.69
177.87
114.02
7. Long-Term Provisions Employee Benefits Other Provisions (Refer Note 35)
Rs. in Crores 2016
2015
52.61
80.26
8. Short-Term Borrowings Secured Loans From Banks Working Capital Facilities Secured by way of hypothecation of raw materials, finished products, stores and spares and book debts on pari u basis Unsecured Loans From Banks
142
-
72.24
52.61
152.50
Corporate Overview 01-48
Statutory Reports 49-124
Financial Statements 125-220
Notes forming part of the Financial Statements Rs. in Crores 2016
2015
194.39
142.46
3.99
1.42
198.38
143.88
9. Trade Payables Trade Payables* Due to Micro and Small Enterprises * Includes due to Related Parties - Rs. 16.85 Crores (Rs. 11.79 Crores) Rs. in Crores 2016
2015
6.30
6.05
10. Other Current Liabilities Unpaid Dividends*
4.42
4.33
Statutory Liabilities
13.60
11.25
Security Deposits from Customers
34.98
33.01
Interest Accrued but not due on borrowings
325.00
-
Payable on Redemption of Debentures (Refer Note 6)
72.54
-
Others
88.11
98.84
544.95
153.48
Current Maturities of Long-Term Debentures (Refer Note 5)
*There are no amounts due and outstanding to be credited to the Investor Education and Protection Fund. Rs. in Crores 2016
2015
15.74
15.35
0.29
0.42
11. Short-Term Provision Employee Benefits Wealth Tax less advance payment Rs. 3.81 Crores (Rs. 3.67 Crores)
142.00
142.00
Tax on Dividend (Net of Rs. 13.42 Crores (Rs. 13.42 Crores))
16.29
16.30
Other Provisions (Refer Note 35)
20.89
18.54
195.21
192.61
Proposed Dividend
143
Annual Report 2015-16
•
Connect with every sip
Notes forming part of the Financial Statements 12. Fixed Assets
Rs. in Crores Cost As at March 31, 2015
Depreciation
On Amalgamation (Note 34a)
Additions/ Adjustment
Deductions/ Adjustment
As at March 31, 2016
Net Book Value
As at March 31, 2015
On Amalgamation (Note 34a)
For the Year
Deductions/ Adjustment/ (Impairment)
As at March 31, 2016
As at March 31, 2016
As at March 31, 2015
1.82
TANGIBLE Owned : Land Tea Estate Land/Fuel Area (Including Development)
Buildings Bridges Plant & Equipment Furniture, Fixtures & Office Equipment Motor Vehicles Total
Previous year
1.82
-
-
-
1.82
@
-
-
-
-
-
1.82
(1.42)
(0.40)
-
-
(1.82)
@
-
-
-
-
-
(1.82)
5.55
-
-
-
5.55
-
-
-
-
-
5.55
(5.55)
-
-
-
(5.55)
-
-
-
-
-
(5.55)
48.86
-
4.38
1.40
51.84
@
14.10
-
1.04
0.53
14.61
37.23
(41.52)
(4.52)
(2.81)
-
(48.85)
@
(11.55)
(1.58)
(0.97)
-
(14.10)
(34.75)
0.00
-
-
-
0.00
*
0.00
-
-
-
0.00
*
0.00*
(0.00)
-
-
-
(0.00)
*
(0.00)
-
-
-
(0.00)
*
(0.00)*
215.44
-
26.48
15.23
226.69
@
113.94
-
12.50
13.59
112.85
113.84
(165.87)
(28.05)
(22.89)
(1.38)
(215.43)
@
(87.71)
(15.00)
(11.73)
(0.50)
(113.94)
(101.49)
40.28
-
2.73
0.27
42.74
17.06
-
3.39
0.26
20.19
22.55
(27.68)
(0.81)
(11.95)
(0.16)
(40.28)
(13.30)
(0.29)
(3.56)
(0.10)
(17.05)
(23.23)
4.43
-
0.40
0.08
4.75
2.36
-
0.24
0.07
2.53
2.22
(3.48)
(0.48)
(0.89)
(0.41)
(4.44)
(2.07)
(0.25)
(0.44)
(0.39)
(2.37)
(2.07)
316.38
-
33.99
16.98
333.39
147.46
-
17.17
14.45
150.18
183.21
245.53
34.26
38.54
1.95
316.38
114.63
17.12
16.70
0.99
147.46
168.91
-
5.55
34.75 0.00 101.49 23.23
2.07 168.91
INTANGIBLE Capitalised Software Patent/Knowhow (Refer Note 36 b) Non Compete Fee
24.60
-
4.25
-
28.85
13.04
-
3.56
-
16.60
12.25
(17.64)
(0.23)
(6.73)
-
(24.60)
(10.56)
(0.23)
(2.25)
-
(13.04)
(11.56)
17.63
-
-
-
17.63
5.42
-
1.76
(7.00)
14.18
+
3.45
(17.63)
-
-
-
(17.63)
(3.65)
-
(1.76)
-
(5.41)
3.00
-
-
-
3.00
2.35
-
0.30
-
2.65
(3.00)
-
-
-
(3.00)
(2.05)
-
(0.30)
-
(2.35)
(0.65)
20.81
-
5.62
(7.00)
33.43
16.05
16.27
0.23
4.31
-
20.81
24.43
Total
45.23
-
4.25
-
49.48
Previous Year
38.27
0.23
6.73
-
45.23
-
12.22
(12.22) +
0.35
1)
Cost of Land Includes a portion leased to an Associate.
2)
Cost of Buildings include Rs. 5.90 Crores (Rs. 5.90 Crores) represented by shares in Co-operative Housing Societies / a Company.
3)
(@) Includes amount of Rs. 1.26 Crores (Rs. 1.26 Crores), Rs. 0.62 Crores (Rs. 0.62 Crores), Rs. 0.08 Crores (Rs. 0.08 Crores),respectively, tly owned /held with a subsidiary company.
4)
(+) Unexpired period of amortisation for Patent/Knowhow is 71 months and Non Compete fees is 14 months.
5)
* Amount is below the rounding off norm adopted by the Company.
144
11.56
0.65 24.43
Corporate Overview 01-48
Financial Statements 125-220
Statutory Reports 49-124
Notes forming part of the Financial Statements Rs. in Crores Class
Nos.
Face Value of each
2016
2015
161.51
161.51
161.51
161.51
50.33
50.33
-
2.72
-
0.47
-
0.10
2.34
2.36
-
0.17
-
2.95
52.67
59.10
13. Non-Current Investments Long-Term Trade Investments (Fully paid up and valued at cost) (a) Quoted Equity Investments Investment in Subsidiaries : Tata Coffee Ltd. (Refer Foot Note 1) #
Equity Shares
107359820
Rs.
1
#Inclusive of Rs. 21.86 Crores (Rs. 21.86 Crores) kept in Revaluation Reserve Others: Tata Chemicals Ltd. (Refer Foot Note 1)
Equity Shares
11185522
The Indian Hotels Co Ltd. (Refer Foot Note 4)
Equity Shares
(1687742)
Tata Motors Ltd. (Refer Foot Note 4)
Equity Shares
Tata Investment Corporation Ltd. (Refer Foot Note 4)
"A" Ordinary Shares Equity Shares
10
Re.
(1)
Rs.
(2)
(116665)
Tata Motors Ltd. (Refer Foot Note 4)
Rs.
(16665)
Rs.
(2)
158469
Rs.
10
(160000) Tata Steel Ltd. (Refer Foot Note 4)
Equity Shares
Titan Company Ltd. (Refer Foot Note 4)
Equity Shares
(12021)
Rs.
(10)
(9248060)
Rs.
(1)
(b) Unquoted Equity Investments Investment in Subsidiaries : Tata Tea Extractions Inc.
Common Stock
14000000
US$
1
59.80
59.80
Tata Global Beverages Group Ltd.
Ordinary Shares
70666290
GBP
1
500.71
500.71
Tata Global Beverages Capital Ltd.
Ordinary Shares
89606732
GBP
1
763.89
763.89
Consolidated Coffee Inc.
Common Stock
199
US$
0.01
92.49
92.49
58.24
24.70
0.05
0.05
(58.24)
(24.70)
1416.94
1416.94
Zhejiang Tata Tea Extraction Company Ltd. @ ( Refer Foot Note 3) Tata Tea Holdings Private Limited
Equity Shares
50000
Rs.
Less: Provision for diminution in the value of investment (Refer Foot Note 3)
10
@ Amount of Investments is RMB 7.25 Crores (RMB 3.85 Crores) in the share capital of the company.
145
Annual Report 2015-16
•
Connect with every sip
Notes forming part of the Financial Statements Rs. in Crores Class
Nos.
Face Value of each
2016
2015
Investment in Associates : Estate Management Services (Pvt.) Ltd.
Ordinary Shares *
12078406
LKR
10
14.57
14.57
Amalgamated Plantations Pvt. Ltd.
Equity Shares
61024400
Rs.
10
61.02
61.02
Kanan Devan Hills Plantations Company (Pvt.) Ltd.
Equity Shares
3976563
Rs.
10
12.33
12.33
TRIL Constructions Limited
Equity Shares
11748148
Rs.
10
11.75
11.75
99.67
99.67
* Sale of these investments requires first offer of sale to the venture partners. Investment in t Ventures : NourishCo Beverages Limited (Refer Foot Note 2)
Equity Shares
Tata Starbucks Private Limited (Refer Foot Note 2)
Equity Shares
90500000
Rs.
10
90.50
77.50
Rs.
10
178.00
150.00
268.50
227.50
(77500000) 178000000 (150000000) Others: 1755
Rs.
1000
9.75
9.75
475
Rs.
1000
0.05
0.05
Equity Shares
613598
Rs.
10
0.95
0.95
Equity Shares
6519441
Rs.
100
115.82
115.82
Equity Shares
4200000
Rs.
10
4.20
4.20
130.77
130.77
Tata Sons Ltd.
Equity Shares
Tata Services Ltd.
Ordinary Shares
Tata Capital Ltd. Tata Industries Ltd. Taj Air Ltd. (c) Unquoted Preference Shares Investment in Associates : Amalgamated Plantations Pvt. Ltd.
0.01% Non Cum. Redeemable Preference Shares @
67000000
Rs.
10
67.00
67.00
TRIL Construction Limited
0.001% Non Cumulative, Non-redeemable and mandatorily fully convertible Preference Shares @@
66751852
Rs.
10
66.75
66.75
133.75
133.75
@ Redeemable with Special redemption within 7-9 years from the issue date and extension is being considered in line with the agreements. @@ Redeemable within six years from the issue date.
146
Corporate Overview 01-48
Financial Statements 125-220
Statutory Reports 49-124
Notes forming part of the Financial Statements Rs. in Crores Class
Nos.
Face Value of each
2016
2015
-
2.09
-
2.09
(d) Quoted Debentures The Indian Hotels Co. Ltd. (Refer Foot Note 4)
Compulsory Convertible Debenture
-
(379741)
Rs.
(55)
Other than Trade (Fully paid up and valued at cost) (a) Quoted Equity Investments SBI Home Finance Ltd.
Equity Shares
100000
Rs.
10
Less: Provision for diminution in the value of investment
0.10
0.10
(0.10)
(0.10)
-
-
(b) Unquoted Equity Investments The Annamallais Ropeways Co. Ltd.
Ordinary Shares
2092
Rs.
100
0.02
0.02
ABC Tea Workers Welfare Services
Ordinary Shares
20000
Rs.
10
0.02
0.02
Assam Hospitals Ltd.
Equity Shares
200000
Rs.
10
0.20
0.20
The Valparai Co-operative Wholesale Stores Ltd.
Ordinary Shares
350
Rs.
10
0.00*
0.00
Suryakiran Apartment Services Private Ltd
Equity Shares
2146
Rs.
10
0.00*
0.00
Jalpaiguri Club Ltd. (Cost Re. 1)
Ordinary Shares
60
Rs.
10
0.00
0.00
GNRC Ltd.
Equity Shares
50000
Rs.
10
0.05
0.05
IFCI Venture Capital Funds Ltd.
Equity Shares
250000
Rs.
10
0.25
0.25
Ritspin Synthetics Ltd.
Equity Shares
100000
Rs.
10
0.10
0.10
TEASERVE
Equity Shares
1
Rs.
5000
*
0.00
0.00
12280
Rs.
10
0.00*
0.00
(0.11)
(0.11)
0.53
0.53
*
(The Tamil Nadu Tea Manufacturers' Service Industrial Co-operative Society Ltd.) Woodlands Hospital & Medical Res. Centre Ltd.
Equity Shares
Less: Provision for diminution in the value of investment (c) Unquoted Debentures The Bengal Chamber of Commerce & Industry
6 1/2% Debentures
Shillong Club Ltd. (Cost Rs. 2)
5% Debentures
7
Rs.
1000
0.00*
0.00
31
Rs.
100
0.00*
0.00
0.00
*
0.00
0.00*
0.00
-
-
(d) Unquoted Preference Shares Thakurbari Club Ltd. (Cost Re. 1)
Preference Shares
26
Rs.
100
(e) Unquoted Government Securities
147
Annual Report 2015-16
•
Connect with every sip
Notes forming part of the Financial Statements Rs. in Crores Class W. B. Estates Acquisition Compensation Bond Total Aggregate Amount of Quoted investments Market Value of Quoted Investments Aggregate Amount of Unquoted investments Aggregate provision for diminution in value of investments
Nos.
Face Value of each
2016
2015
0.00* 0.00* 2264.34 214.18 1389.03 2050.16 58.45
0.00 0.00 2231.86 222.70 1875.27 2009.16 24.91
1.
3723648 shares of Tata Chemicals Ltd. and 31000400 shares of Tata Coffee Ltd. are pledged against outstanding 3% Non Convertible privately placed Debentures.
2.
During the year, the Company has invested an amount of Rs. 13 Crores towards issue of equity shares by NourishCo Beverages Limited and Rs. 28 Crores towards issue of equity shares by Tata Starbucks Private Limited. Both these Companies are 50:50 t ventures.
3.
During the year, the Company has converted the Shareholder loan to Zhejiang Tata Tea Extractions Company Limited (ZTTECL), with effect from 25th March 2016, to equivalent equity in that Company. The revised shareholding of the Company post this conversion in ZTTECL stands at 81.46%. Subsequent to year end, fresh equity infusion was made in ZTTECL amounting to Rs. 74.41 Crores.
4.
During the year, the Company has sold some of its investments and the resultant profit has been ed under exceptional item (Refer Note 29).
*
Investment costs are below Rs. 0.01 Crores. Rs. in Crores 2016
2015
15.90
17.39
15.90
17.39
3.12
2.51
35.45
31.17
14. Deferred Tax Assets (net) Deferred Tax Liability Depreciation Deferred Tax Asset
Provision for doubtful debts/advances
Employee Benefits
Employee Separation Schemes
3.75
4.11
on Redemption of Debentures
4.44
12.81
Other Assets
8.62
12.54
55.38
63.14
39.48
45.75
148
Corporate Overview 01-48
Financial Statements 125-220
Statutory Reports 49-124
Notes forming part of the Financial Statements Rs. in Crores 2016
2015
15. Long-Term Loans and Advances Unsecured and Considered Good unless other wise stated Capital Advances
1.15
1.83
Security Deposit
24.38
25.39
Advance Tax (net of provisions of Rs. 1406.99 Crores (Rs. 1315.96 Crores))
31.22
19.86
MAT Credit entitlement
39.00
-
Inter Corporate Loans (Secured)
24.00
24.00
Employee Loans and Advances
0.75
0.71
Other Advances
Loan to Subsidiary (Refer note 13, foot note 3)
-
Less: Provision for Impairment
-
33.54 -
33.54
-
Considered Doubtful Security Deposit
0.29
Less: Provision for Doubtful Deposits
0.29
0.29 -
0.29
120.50
71.79 Rs. in Crores
2016
2015
70.50
70.50
70.50
70.50
16. Other Non-Current Assets Property Rights Pending Development (Refer Note 34b)
Rs. in Crores 2016
2015
17. Inventories (At lower of cost or net realisable value) Raw Material
Tea (Includes in transit Rs. 2.32 Crores (Rs. 3.10 Crores))
Packing Materials
634.23
565.00
34.92
34.94 669.15
599.94
Finished Goods Tea Others
209.49
209.50
3.24
0.55 212.73
210.05
Traded Goods
Formulations and Others
2.14
0.87
Stores and Spare Parts
5.69
8.41
889.71
819.27
149
Annual Report 2015-16
•
Connect with every sip
Notes forming part of the Financial Statements Rs. in Crores 2016
2015
Considered Good
1.57
0.82
Considered Doubtful
6.98
5.20
122.52
92.80
131.07
98.82
18. Trade Receivables (Unsecured) Outstanding for a period exceeding six months from the date they are due for payment
Others Considered Good Less : Provision for Doubtful Debts
6.98
5.20
124.09
93.62 Rs. in Crores 2015
2016 19. Cash and Bank Balances Cash and Cash Equivalents Cash and Cheques in hand Fixed Deposit with Banks In Mutual Funds Bank Balances in Current Other Bank Balances Unclaimed Dividend s
0.02 50.00 173.33 9.55
232.90
0.02 10.83 4.11
6.30 239.20
14.96 6.05 21.01 Rs. in Crores
2016
2015
32.43
18.16
4.29
5.57
20. Short-Term Loans and Advances Unsecured and Considered Good unless other wise stated Due from Related Parties Insurance Claims Receivable Other Trade Advances
18.42
18.72
Taxes Receivable
16.55
9.33
Inter Corporate Deposits (Includes secured deposit of Rs. 4.75 Crores (Rs. 5.00 Crores))
13.75
26.50
Employee Loans and Advances Prepaid Expenses
0.33
0.52
18.70
14.56
Considered Doubtful Other Advances for Supply of Goods and Services
1.75
Less: Provision for Advances
1.75
1.75 104.47
150
1.75
93.36
Corporate Overview 01-48
Statutory Reports 49-124
Financial Statements 125-220
Notes forming part of the Financial Statements Rs. in Crores 2016
2015
Interest Accrued
1.52
2.01
Export Incentive Receivable
1.75
1.90
3.27
3.91
21. Other Current Assets
Rs. in Crores 2016
2015
22. Revenue from Operations 2953.43
2774.29
Others
25.94
19.03
Sales of Traded Goods
Sales of Tea
10.50
3.27
Service Income
1.44
1.36
Less: Excise duty
6.82
0.24 2984.49
2797.71
Other Operating Revenues 7.59
7.52
Liabilities no longer required written back
18.09
24.74
Management Service Fees
47.07
41.84
Miscellaneous Receipts
26.68
12.71
Export Incentive
99.43
86.81
3083.92
2884.52 Rs. in Crores
2016
2015
23. Other Income Dividend Income from Non Current Trade Investments Dividend from Mutual Funds Dividend from Investment in Subsidiaries
29.30
23.35
1.30
0.62
67.38
113.10 97.98
137.07
Profit on Sale of Current Investments
0.14
0.11
Rent Income
0.37
0.48
Profit on sale/discard of Fixed Assets (net)
0.94
-
Interest Income on Advances/Deposits etc.
7.14
17.50
106.57
155.16
151
Annual Report 2015-16
•
Connect with every sip
Notes forming part of the Financial Statements Rs. in Crores 2016
2015
24. Cost of Materials Consumed Tea
Opening Stock
565.00
420.62
Add: Purchases
1759.99
1827.94
Less: Closing Stock
634.23
565.00
Green Leaf
1690.76
1683.56
18.45
16.25
Packing Material
Opening Stock
34.95
25.90
Add: Purchases
170.70
171.37
Less: Closing Stock
34.92
34.95 170.73
Others
162.32
9.02
10.74
1888.96
1872.87 Rs. in Crores
2016 25. Change in Inventories of Finished Goods/Stock-in-trade/ Work-in-progress Stock as at March 31, 2015 Tea Others On Amalgamation Stock as at March 31, 2016 Tea Others
209.50 1.42
2015
179.93 2.61 210.92 -
209.49 5.38
182.54 0.39 209.50 1.42
214.87 (3.95)
210.92 (27.99) Rs. in Crores
26. Employee Benefits Expense Salaries, Wages and Bonus* (Refer Note 38) Contribution to Provident Fund and other Funds Workmen and Staff Welfare Expenses Others
2016
2015
132.78 18.89 28.56 6.65 186.88
119.62 17.92 17.70 6.68 161.92
* Includes net credit of earlier years Rs. 2.56 Crores (Rs. 1.70 Crores) and expense on Corporate Social Responsibility Rs. 1.51 Crores (Rs. 0.95 Crores).
152
Corporate Overview 01-48
Statutory Reports 49-124
Financial Statements 125-220
Notes forming part of the Financial Statements Rs. in Crores 2016
2015
27. Finance Costs Interest On Fixed Loans
10.33
17.88
On Debentures
9.75
9.75
On Other Loans
9.32
6.38 29.40
Bank Charges
34.01
0.21
0.18
29.61
34.19 Rs. in Crores 2016
2015
62.85
55.38
9.95
8.42
Power and Fuel (net of recovery)
26.76
27.84
Repairs to Plant and Machinery
4.27
3.56
Repairs to Buildings
5.48
4.66
45.64
38.77
8.23
6.75
279.64
207.65
45.79
55.49
6.54
3.43
21.81
18.89
28. Other Expenses Manufacturing and Contract Packing Expenses * Consumption of Stores and Spare Parts
Rent Rates and Taxes (net) ment and Sale Charges Freight Insurance Management Service Fees Loss on sale/discard of Fixed Assets (net) Provision for Doubtful debts/advances Miscellaneous Expenses ** ( Refer Note 38)
-
0.14
1.78
-
139.13
128.27
657.87
559.25
* Includes Contract Packing Expenses Rs. 38.15 Crores (Rs. 33.55 Crores). ** Includes exchange gain Rs. 7.00 Crores (Rs. 7.80 Crores) and expense on Corporate Social Responsibility Rs. 4.02 Crores (Rs. 2.96 Crores).
153
Annual Report 2015-16
•
Connect with every sip
Notes forming part of the Financial Statements Rs. in Crores 2016
2015
327.79
-
Levy relating to past demerged business
(3.00)
-
Provision for retrospective amendment of legislation relating to employee benefit
(0.97)
-
29. Exceptional Items (Net) Income Profit on sale of Non-Core Investment (Expenditure)
-
(6.99)
(52.25)
(61.93)
(7.00)
-
264.57
(68.92)
Cost of new Initiatives and restructuring activities Provision for Impairment/obligations relating to a Subsidiary (Refer Note 36a) Provision for impairment of Intangibles (Refer note 36b)
30. Estimated amount of contracts remaining to be executed on capital and not provided for as at March 31, 2016 aggregated Rs. 2.29 Crores (Rs. 7.70 Crores) (Capital Advances Rs. 1.15 Crores (Rs. 1.83 Crores)).
31. Contingent Liabilities not provided for in respect of:
(a)
Claims under adjudication not acknowledged as debts:
(i) (ii)
Taxes, Statutory Duties/ Levies etc. Commercial and other Claims
Gross Rs. in Crores
Net of Estimated Tax Rs. in Crores
25.18
19.39
(11.64)
(7.23)
2.33
1.42
(4.72)
(2.99)
(b)
Labour disputes under adjudication relating to some staff – amount not ascertainable.
(c)
Guarantees given to the lenders of subsidiary Rs. 75.94 Crores (Rs. 72.53 Crores). These corporate guarantees were issued against loans drawn by a Subsidiary Company from banks as working capital loans and term debts. Subsequent to year end, loans to the extent of Rs. 71.88 Crores have been repaid.
32. Micro enterprises and small enterprises under the Micro, Small and Medium Enterprises Development Act, 2006 have been determined based on the confirmations received in response to intimation in this regard sent by the Company to the suppliers. No interest in of Section 16 of Micro, Small and Medium Enterprises Development Act, 2006 or otherwise has either been paid or payable or accrued and remaining unpaid as at March 31, 2016.
33. The company had entered into a put option agreement with International Finance Corporation (IFC) in relation to their investment in Amalgamated Plantations Private Limited (APPL) under which IFC could exercise a put option by 29th April 2016, with an obligation on the Company to purchase a maximum of 300 Lakhs shares. This option was not exercised by IFC.
154
Corporate Overview 01-48
Statutory Reports 49-124
Financial Statements 125-220
Notes forming part of the Financial Statements 34. (a)
During the previous year, pursuant to a Scheme of Amalgamation of Mount Everest Mineral Water Limited (Subsidiary of the Company) with the Company as sanctioned by the Honorable High Courts of Himachal Pradesh and Calcutta, all assets and liabilities of the subsidiary had been transferred to and vested with the Company retrospectively with effect from 1st April 2013. The amalgamation has been ed for in the books of of the Company according to the “Pooling of Interests Method” of ing as per the ing Standard (AS) 14, ‘ing for Amalgamations’ specified under section 133 of the Companies Act, 2013 read with Rule 7 of the Companies (s) Rules, 2014. All assets and liabilities, reserves have been recorded in the books of of the Company at their existing carrying amounts and in the same form. Further, in accordance with the Scheme, the difference between carrying value of investments in the Amalgamating Company as reflected in the books of the Company and the corresponding paid up capital of the amalgamating Company along with the debit balance in the Statement of Profit and Loss as of April 1, 2013 of the Amalgamating Company had been adjusted against the securities of the Company. The application and reduction of the securities was effected as an integral part of the sanctioned Scheme under reference to section 391 and section 394 of the Companies Act, 1956 read with section 78 and section 100 of the Companies Act, 1956.
The company during 2013-14 had entered into a development agreement with Tata Reality and Infrastructure Limited for development of commercial /residential property through a special purpose vehicle TRIL Constructions Limited (TCL). The consideration for the transfer of land with buildings/structures in Yehswantpur, Bangalore was Rs. 195 Crores. The said consideration was discharged by combination of cash, investment in TCL through equity and compulsorily convertible preference shares (Refer Note 13 - Non-Current Investments) and constructed office space in the property to be developed.
(b)
35.
Other Provisions Rs. in Crores Description
Trade Obligations Restructuring Costs Obligations relating to a Overseas Subsidiary Company
Opening Balance
Provision during the year
Amount paid/ Adjusted during the year
Closing balance
Classification
13.09
6.04
-
19.13
Short-Term
5.46
-
3.70
1.76
Short-Term
23.69
52.25
-
75.94
Long-Term
36. (a)
During the year the Company has evaluated its exposure in its Chinese Subsidiary Company which is under t Venture Control. In view of delays in startup and stabilisation of technology for an enhanced product range and on considerations of ing prudence the Company has recognised a provision of Rs. 52.25 Crores (Rs. 23.69 Crores) on of obligations arising from bank loans availed by the Subsidiary. In previous year the Company had recognised a dimuntion, other than temporary, in its investment and convertible loans cumulating to Rs. 38.24 Crores.
The Company has recognised an impairment loss in the carrying value of its Patent/Knowhow. The impairment arose on of revision in the business plans with lower than expected economic benefits over its estimated useful life. A pre tax discounting rate of 22.3 % has been used for value in use evaluation (Refer Note 48).
(b)
37. The current tax charge is net of credit on of writebacks pertaining to earlier years of Rs. 18.10 Crores (Rs. 51.40 Crores). Prior year included one-time credit arising on amalgamation of Mount Everest Mineral Water Limited with the Company and credit relating to debenture redemption charged to Securities in an earlier year.
155
Annual Report 2015-16
•
Connect with every sip
Notes forming part of the Financial Statements 38. Corporate Social Responsibility (CSR)
As per Section 135 of the Companies Act, 2013, a CSR Committee has been formed by the Company.
(a)
Gross Amount required to be spent by the Company during the year Rs. 4.50 Crores
(b)
Amount spent during the year on: Rs. in Crores Particulars
In Cash
Yet to be paid in cash
Total
-
-
-
5.43
0.10
5.53
2016
2015
563.67
289.00
631129729
618398570
-
12731159
631129729
631129729
Basic
8.93
4.58
Diluted
8.93
4.58
(i) Construction/acquisition of any asset (ii) On purposes other than (i) above
39.
Earnings Per Share Profit after taxation (Rs. in Crores ) Numbers of Equity Shares Outstanding Add: Equity shares to be issued consequent to Amalgamation lying in Share Suspense Total Number of Shares Earnings Per Share (Rs.)
Rs. in Crores
40.
2016
2015
Capital Expenditure
0.71
0.34
Revenue Expenditure
5.50
4.99
6.21
5.33
Expenditure incurred in respect of the Company's Research and Development
41. The Company’s leasing arrangements are in respect of operating leases for premises (residential, office, godown etc.) and motor cars. These operating leasing arrangements which are cancellable ranges between 5 months to 5 years and are usually renewable on mutually agreeable . The aggregate lease rentals payable in respect of premises are charged as Rent and in respect of motor cars amounting to Rs. 4.59 Crores (Rs. 4.34 Crores) are charged under Miscellaneous expense under Note 29 of the Statement of Profit and Loss.
156
Corporate Overview 01-48
Statutory Reports 49-124
Financial Statements 125-220
Notes forming part of the Financial Statements 42. Value of Raw Materials and Stores and Spare Parts consumed - Gross Raw Materials Value % of total Rs. in Crores consumption Imported Indigenous
54.18 (54.48) 1834.78 (1818.39) 1888.96 (1872.87)
2.87 (2.91) 97.13 (97.09) 100.00 (100.00)
Stores and Spares Value % of total Rs. in Crores consumption 0.75 (0.80) 14.24 (13.65) 14.99 (14.45)
5.00 (5.54) 95.00 (94.46) 100.00 (100.00)
2016
Rs. in Crores 2015
190.82 1.32 57.76 47.07 17.87
166.13 1.24 103.60 41.84 1.41 8.96
2016
Rs. in Crores 2015
2.93 9.93 19.03 1.45
2.91 3.79 16.81 3.51
2016
Rs. in Crores 2015
55.85 1.97 0.72 5.76
55.46 1.32 0.56 1.69
2016
2015
1 2.37 5.33 2014-15
1 1.04 2.34 2013-14
43. Earnings in Foreign Exchange Value of Exports at F.O.B. Technical Service Fees - Gross Dividends - Gross Management Service Fees Interest Others (Freight, Insurance etc.)
44. Expenditure in Foreign Currency Foreign Travel Professional Fees Management Service Fees Other Expenses
45. Value of Imports on C.I.F. basis Raw Materials Finished Goods Stores & Spare Parts Capital Goods
46.
Dividend remitted in foreign currency No. of shareholders No. of shares held in Crores Dividend remitted (Rs. Crores) Year
157
Annual Report 2015-16
•
Connect with every sip
Notes forming part of the Financial Statements 47. A)
Related Party Disclosure
Subsidiaries (contd..)
Related Parties
OOO Tea Trade LLC
Promoter
OOO Sunty LLC
Tata Coffee Limited
Tata Sons Limited
Subsidiaries
Tata Global Beverages Group Limited
Tata Global Beverages Holdings
Tata Global Beverages Services Limited
Tata Global Beverages GB Limited
Tata Global Beverages Overseas Holdings Limited
Tata Global Beverages Overseas Limited
Lyons Tetley Limited
Tata Global Beverages U.S. Holdings, Inc.
Tetley USA Inc.
Tata Global Beverages Canada Inc.
Tata Global Beverages Australia Pty Limited
Stansand Limited Stansand (Brokers) Limited
Consolidated Coffee Inc. Eight ‘O Clock Coffee Company Eight ‘O Clock Holdings Inc. Tata Tea Extractions Inc.
Tata Global Beverages Capital Limited
Zhejiang Tata Tea Extraction Company Limited
Tata Tea Holdings Private Limited
Earth Rules Pty. Ltd.
Associates
Estate Management Services Pvt. Limited, Sri Lanka
Amalgamated Plantations Pvt. Limited
Kanan Devan Hills Plantation Company Private Limited TRIL Constructions Limited
Stansand (Africa) Limited
t Ventures
Stansand (Central Africa) Limited
NourishCo Beverages Limited
Tata Global Beverages Polska Sp.z.o.o
Tata Starbucks Private Limited
Drassington Limited, UK Good Earth Corporation
Associates of Subsidiaries
Good Earth Teas Inc.
Bjets Pte. Ltd.
Teapigs Limited Teapigs US LLC.
Tata Global Beverages Czech Republic a.s
Joekels Tea Packers (Proprietary) Limited (South Africa)
Tata Global Beverages Investments Limited
Campestres Holdings Limited Kahutara Holdings Limited Suntyco Holding Limited Onomento Co. Limited
158
t Venture of Subsidiaries
Tetley ACI (Bangladesh) Limited
Southern Tea LLC Empirical Group LLC
Tetley Clover (Private) Limited
Key Management Personnel
Mr. Ajoy Misra - CEO & Managing Director
Mr. L KrishnaKumar - Executive Director & Group CFO
Corporate Overview 01-48
Statutory Reports 49-124
Financial Statements 125-220
Notes forming part of the Financial Statements Particulars of transactions during the year ended March 31, 2016 Nature of Transactions Subsidiaries Associates
Sale of Goods & Services Other Operating Income # Rent Paid Purchase of Goods & Services Fees for Marketing Other Expenses (Net) Reimbursement of Expenditure/(Income) Dividend/Interest received Dividend Paid Sale of Investments Deposits Redemmed Investments Made Guarantee Given Directors Remuneration *
t Ventures
Promoter
193.70 (170.77) 51.84 (41.84) 56.30 (37.27) 2.66 ((0.93)) 67.38 (114.50) 33.54 3.41 (72.53) -
0.60 (0.04) (1.09) 1.84 (1.34) 289.53 (266.50) 3.25 (2.83) 3.92 (1.16 ) 10.44 (12.02) -
20.35 (19.62) 0.30 (0.31) 7.57 (13.82) (1.51) ((1.23)) 41.00 (75.00) -
(0.32) 9.20 (8.47) 0.41 ((0.01)) 4.21 (1.40) 32.14 (32.14) 312.31 (1.00) -
Key Management Personnel 6.18 (5.14)
83.35 (43.71) 1.36 (1.96)
25.18 (24.09) 6.75 (2.14)
5.11 (2.32) 0.36 -
8.38 (7.69)
-
Rs. in Crores Total
214.65 (190.43) 52.14 (43.24) 1.84 (1.66) 345.83 (303.77) 7.57 (13.82) 12.45 (11.30) 5.48 ((1.01)) 82.03 (127.92) 32.14 (32.14) 312.31 (1.00) 74.54 (75.00) 3.41 (72.53) 6.18 (5.14)
Outstanding at the year end : Debit Credit
-
* Provision for employee benefits, which are based on actuarial valuation done on an overall Company basis, is excluded. # Includes amount recovered for expenditure incurred on Tata Coffee Grand which is an Instant Coffee product, tly developed by the Company with its Subsidiary under a provisional agreement. The Company is in the process of finalising the definitive agreements pertaining to “ Tata Coffee Grand”. The above does not include share of recurring benefits payable to former Managing Directors. In respect of Royalty agreements, moratorium period are prescribed and such transactions are not disclosed above to the extent there are no outflows/inflows.
159
Annual Report 2015-16
•
Connect with every sip
Notes forming part of the Financial Statements 47. B) Disclosures in respect of transactions in excess of 10% of the total related party transactions of the same type: Rs. in Crores 1
Sale of Goods and Services
2016
2015
Tata Global Beverages Group Limited
106.58
94.80
Tata Global Beverages Polska Sp.z.o.o
-
16.39
58.70
45.65
-
19.62
47.07
41.84
Tata Tea Extractions US Inc. NourishCo Beverages Limited 2
Other Operating Income
3
Purchase of Goods & Services
Tata Global Beverages Services Ltd. Kanan Devan Hills Plantation Company Private Limited Amalgamated Plantations Pvt. Ltd. Kanan Devan Hills Plantation Company Private Limited Tata Global Beverages Services Ltd.
4
Rent Paid
-
1.09
206.89
180.29
82.64
86.21
-
18.06
-
0.32
Amalgamated Plantations Pvt. Ltd.
1.35
0.85
Kanan Devan Hills Plantation Company Private Limited
0.49
0.49
Tata Sons Ltd.
5
Fees for Marketing
NourishCo Beverages Limited
7.57
13.82
6
Other Expenses (Net)
Tata Sons Ltd.
9.20
8.47
Amalgamated Plantations Pvt. Ltd.
3.25
2.83
7
Reimbursement of Expenditure (Net)
Consolidated Coffee Inc.
1.51
0.51
Tata Global Beverages Services Ltd.
0.33
(1.50)
Amalgamated Plantations Pvt. Ltd.
3.95
1.14
Kanan Devan Hills Plantation Company Private Limited
(0.04)
0.03
NourishCo Beverages Limited
(1.44)
(1.21)
Tata Starbucks Private Limited
(0.07)
(0.03)
Tata Sons Ltd.
0.41
(0.01)
Tata Coffee Ltd.
0.80
-
0.07
-
Tata Tea Extractions US Inc.
(0.03)
-
Tetley USA Inc. 8
Dividend and Interest Received
Tata Global Beverages Group Limited
18.44
34.04
Tata Global Beverages Capital Limited
12.27
32.94
Tata Coffee Ltd.
13.96
13.96
Consolidated Coffee Inc.
16.79
20.54
-
11.62
Tata Tea Extractions US Inc. 9
Dividend Paid
Tata Sons Ltd.
32.14
32.14
10
Sale of Investments
Tata Sons Ltd.
312.31
-
11
Deposits Redeemed
Tata Sons Ltd.
-
1.00
12
Investments Made
NourishCo Beverages Limited
13.00
15.00
Tata Starbucks Private Limited
28.00
60.00
Zhejiang Tata Tea Extraction Company Limited*
33.54
-
Zhejiang Tata Tea Extraction Company Limited
3.41
43.59
13
Guarantee Given
*Converted into Equity during the year
160
Corporate Overview 01-48
Statutory Reports 49-124
Financial Statements 125-220
Notes forming part of the Financial Statements 47. C) Disclosure under Regulation 34(3) of the SEBI (Listing Obligations and disclsoure requirements) Regulations, 2015. Amount of Loans and Advances in nature of loans outstanding from subsidiaries and associates as at March 31, 2016: Rs. in Crores Outstanding
Maximum
March 31, 2016
during the year
Subsidiary Company -
33.54
(33.54)
(37.33)
Zhejiang Tata Tea Extraction Company Limited* Associate Company Kanan Devan Hills Plantation Company Private Limited
24.00
24.00
(24.00)
(24.00)
*Converted into Equity during the year
48. The Company is primarily engaged in tea with some presence in coffee and water. As per the threshold limits prescribed under ing Standard (AS-17) on “Segment Reporting” specified under section 133 of the Companies Act, 2013 read with Rule 7 of the Companies (s) Rules, 2014, the Company’s reportable activity falls within a single business segment, viz “Buying / Blending and Sale of tea in bulk and value added form” and hence the disclosure requirements are not applicable. It has identified Geographical segment as the secondary segment. During the year and previous year, the value of export sales made by the Company did not exceed the quantitative threshold provided for the relevant ing Standards. Accordingly no disclosures in the secondary format of geographical segment is required.
49.
Interest in t Venture i)
The Company's interest, as a venturer, in tly controlled entities (incorporated t Venture) is : Country of Incorporation
% Ownership interests as at March 31, 2016
% Ownership interests as at March 31, 2015
NourishCo Beverages limited
India
50%
50%
Tata Starbucks Private Limited
India
50%
50%
Name
161
Annual Report 2015-16
•
Connect with every sip
Notes forming part of the Financial Statements
ii)
The Company’s interest in these t Ventures is reported as Non-Current Trade Investments (Note - 13) and stated at cost. However, the Company’s share of each of the assets, liabilities, income and expenses, etc. (each without elimination of the effect of transactions between the Company and the t Venture) relating to its interests in these t Ventures are : Rs. in Crores 2016
2015
Balance Sheet SOURCES OF FUNDS
(a)
Share Capital
(b)
Reserves and Surplus
Shareholder's Funds
268.50
227.50
(161.69)
(125.61)
106.81
101.89
-
0.04
1.18
1.03
1.18
1.07
22.22
17.88
Non-current liabilities
(a)
Other long-term liabilities
(b)
Long-term provisions
Sub-total - Non-current liabilities Current Liabilities
(a)
Trade Payables
(b)
Other current liabilities
9.94
11.33
(c)
Short-term provisions
0.27
0.28
Sub-total - Current liabilities
32.43
29.49
TOTAL SOURCES OF FUNDS
140.42
132.45
79.44
81.00
Assets Non-current assets
(a)
Fixed Assets
(b)
Long-term loans and advances
Sub-total - Non-current assets
14.65
12.92
94.09
93.92
Current assets
(a)
(b) Inventories
Current investments
(c)
Trade Receivables
(d)
Cash & Bank balance
(e)
Short-term loans and advances
(f )
Other current assets
Sub-total - Current assets TOTAL APPLICATION OF FUNDS
162
8.59
3.37
17.09
15.30
4.03
1.29
4.54
11.92
12.01
6.58
0.07
0.07
46.33
38.53
140.42
132.45
Corporate Overview 01-48
Statutory Reports 49-124
Financial Statements 125-220
Notes forming part of the Financial Statements Rs. in Crores 2016
2015
184.56
137.63
2.01
1.49
186.57
139.12
Material Cost
96.56
72.51
Employee Benefits Expense
26.93
22.97
0.04
0.18
Statement of Profit and Loss Income Revenue from Operations Other Income Total Revenue Expenses
Finance Costs Depreciaton and Amortization expense
13.63
9.17
Other Expenses
85.49
75.94
Total Expenses
222.65
180.77
Profit before exceptional items
(36.08)
(41.65)
-
-
(36.08)
(41.65)
Exceptional items (net) Profit before tax Provision for tax Profit after tax
-
0.00*
(36.08)
(41.65)
* Amount is below the rounding off norm adopted by the Company.
50. Post Retirement Employee Benefits:
The Company operates defined benefit schemes like provident fund and defined contribution superannuation schemes. For these schemes, contributions are made by the Company, based on current salaries, to recognized funds maintained by the Company and for certain categories contributions are made to State Plans. In case of provident fund schemes, contributions are also made by the employees. An amount of Rs. 10.03 Crores (Rs. 9.35 Crores) has been charged to the statement of profit & loss on of defined contribution schemes.
The Company also operates defined benefit schemes like retirement gratuity, defined superannuation benefits and post retirement medical benefits. The superannuation benefits and medical benefits are restricted to certain categories of employees and qualifying employee/directors in the form of pension, medical and other benefits in of a specific policy related to the same (others). The defined benefit schemes offer specified benefits to the employees on retirement. Annual actuarial valuations are carried out by an independent actuary in compliance with ing Standard 15 (revised 2005) on Employee Benefits. Wherever recognized funds have been set up, annual contributions are also made by the Company. Employees are not required to make any contribution.
163
Annual Report 2015-16
•
Connect with every sip
Notes forming part of the Financial Statements
Amounts recognized in the statement of profit and loss and charged to Contribution to Provident Fund and other Funds, Workmen and Staff: Rs. in Crores Pension
Gratuity
Medical
Others
2016
2015
2016
2015
2016
2015
2016
2015
-
-
2.58
1.65
1.97
1.31
1.50
1.16
Current Service Cost
0.77
1.10
2.95
2.85
2.44
2.82
3.51
3.43
Expected Return on plan assets
(0.57)
(0.86)
(2.17)
(2.06)
-
-
-
-
Net actuarial loss/(gain) recognized during the year
(0.25)
0.16
4.31
5.22
0.62
(4.44)
6.65
3.15
Interest on obligation
-
-
-
(0.01)
-
-
-
-
Effects of the limit in Para 59(b)
(0.27)
(0.09)
-
-
-
-
-
-
Total recognized in statement of profit and loss
(0.32)
0.31
7.67
7.65
5.03
(0.31)
11.66
7.74
Losses/(Gains) on Acquistion/Divestiture
Reconciliation of opening and closing balances of the present value of the obligations: Pension Opening defined benefit obligation On amalgamation (Refer Note 34a ) Current Service Cost Interest Cost Actuarial loss/ (gain) Liabilities assumed on Acquisition / (settled on Divestiture) etc. Benefit Paid Closing Defined Benefit Obligation
Gratuity
Rs. in Crores Others
Medical
2016 10.61 0.77
2015 10.53 1.10
2016 38.69 2.58 2.95
2015 30.84 0.63 1.65 2.85
2016 29.88 1.97 2.44
2015 31.11 1.31 2.82
2016 43.83 1.50 3.51
2015 39.08 1.16 3.43
(0.48) -
(0.01) -
4.82 -
5.16 (0.70)
0.62 -
(4.44) -
6.65 -
3.15 -
(1.26) 9.64
(1.01) 10.61
(3.40) 45.64
(1.74) 38.69
(0.64) 34.27
(0.92) 29.88
(3.27) 52.22
(2.99) 43.83
Reconciliation of opening and closing balances of the fair value of plan assets: Rs. in Crores Pension Opening fair value of plan assets On amalgamation (Refer Note 34a )
Gratuity
2016
2015
2016
2015
8.50
8.39
31.51
26.50
-
-
-
0.81
0.57
0.86
2.17
2.06
Actuarial gain/ (loss)
(0.22)
(0.16)
0.51
(0.06)
Contribution/ ( Withdrawal) by employer
(1.00)
0.00
7.18
4.64
Expected Return on plan assets
-
-
-
(0.70)
(0.87)
(0.59)
(3.40)
(1.74)
Closing Fair value of Plan Assets
6.98
8.50
37.97
31.51
Actual Return on Plan Assets
0.35
0.70
2.68
2.00
Assets acquired on Acquisition / (settled on Divestiture) Benefits Paid
164
Corporate Overview 01-48
Financial Statements 125-220
Statutory Reports 49-124
Notes forming part of the Financial Statements
Major Categories of Plan Assets as a percentage of fair value of the total plan assets: 2016
2015
Govt of India Securities
3.6%
5.0%
PSU bonds
2.6%
3.3%
93.5%
91.5%
0.4%
0.2%
100.0%
100.0%
Insurance managed Funds Others Total
Effect of increase / decrease of one percentage point in the assumed medical inflation rates: Rs. in Crores Increase
Decrease
2016
2015
2016
2015
Effect on aggregate of interest cost and current service cost
0.68
0.53
(0.54)
(0.56)
Effect on defined benefit obligation
5.85
4.47
(4.67)
(4.01)
2016 7.80% 7.50% 8% LIC 1994-96 mortality tables
2015 8.00% 7.50% 8% LIC 1994-96 mortality tables
Principal Actuarial assumptions used:
Discount rates Expected rate of return on plan assets Medical inflation rate Mortality rates
The estimates of future salary increases considered in the actuarial valuation takes into factors like inflation, future salary increases, supply and demand in the employment market etc. The expected return on plan assets is based on actuarial expectation of the average long term rate of return expected on investments of the Funds during the estimated term of the obligations. Amounts recognized in the Balance Sheet are as follows: Rs. in Crores Pension Present value of funded obligation Fair Value of Plan Assets Present Value of Unfunded Obligation Amount not recognized as an asset (limit in Para 59 (b) of AS -15) Contribution adjustment Net Liability
Gratuity
2016 5.75 6.98 (1.23) 3.89 0.42
2015 6.47 8.50 (2.03) 4.14 0.69
2014 6.11 8.39 (2.28) 4.42 0.77
2013 6.42 8.37 (1.95) 4.63 0.66
2012 8.41 10.01 (1.60) 4.83 0.71
2016 45.64 37.97 7.67 0.00*
2015 38.69 31.51 7.18 -
2014 30.84 26.50 4.34 -
2013 26.36 21.20 5.16 -
2012 21.09 20.52 0.57 -
(0.99) 2.09
2.80
2.91
3.34
3.94
7.67
7.18
4.34
5.16
0.57
* Amount is below the rounding off norm adopted by the Company
165
Annual Report 2015-16
•
Connect with every sip
Notes forming part of the Financial Statements Rs. in Crores Medical
Others
2016
2015
2014
2013
2012
2016
2015
2014
2013
Present value of funded obligation
-
-
-
-
-
-
-
-
-
Fair Value of Plan Assets
-
-
-
-
-
-
-
-
-
34.27
29.88
31.11
32.79
27.95
52.22
43.83
39.08
26.56
-
-
-
-
-
-
-
-
-
34.27
29.88
31.11
32.79 27.95
52.22
43.83
39.08
26.56
2016
2015
2014
2013
2012
Experience adjustment on Plan Liability
10.09
(4.59)
7.51
(0.06)
3.14
Experience adjustment on Plan Assets
0.76
0.42
0.03
1.03
0.13
Present Value of Unfunded Obligation Amount not recognized as an asset (limit in Para 59 (b) of AS -15) Net Liability
Rs. in Crores
The contribution expected to be made by the Company for the year ending March 31, 2017 is not readily ascertainable.
The Guidance on Implementing AS15, Employee Benefits (revised 2005) issued by ing Standards Board (ASB) states that benefits involving employer established provident funds, which require interest shortfalls to be recompensed are to be considered as defined benefit plans. The Actuarial Society of India has issued the final guidance for measurement of provident fund liabilities during the quarter ended December 31, 2011.
The actuary has accordingly provided a valuation and based on the below provided assumptions there is no shortfall as at March 31, 2016. Rs. in Crores Particulars
2016
2015
Plan Assets as at period end
98.42
95.00
Present Value of Funded Obligations at period end
98.42
95.00
-
-
Amount Recognised in the Balance Sheet
Provident Fund
Assumptions used in determining the present value obligation of the interest rate guarantee under the Deterministic Approach: Particulars
Provident Fund 2016
2015
Guaranteed Rate of Return
8.75%
8.75%
Discount Rate for remaining term to Maturity of Investment
7.77%
7.95%
Expected Rate of Return on Investment
8.97%
8.94%
166
Corporate Overview 01-48
Financial Statements 125-220
Statutory Reports 49-124
Notes forming part of the Financial Statements 51. Disclosure requirement for Derivatives Instruments
The Company uses foreign currency hedges to manage its risks associated with foreign currency fluctuations relating to certain firm commitments and highly probable transactions. The Company does not use derivative contracts for trading or for speculative purposes.
a)
The outstanding forward exchange contracts for sale of foreign currency as at March 31, 2016 are: Type of Contract
2016
2015
No. of Contract
Foreign Currency in Crores
INR in Crores
No. of Contract
Foreign Currency in Crores
INR in Crores
USD
41
0.59
41.04
73
1.01
66.30
AUD
35
0.61
31.00
62
0.92
49.41
Forward Contract
b)
The foreign currency exposures of monetary items that have not been hedged are: 2016
2015
Foreign Currency in Crores
INR in Crores
Foreign Currency in Crores
INR in Crores
AUD
0.41
20.67
0.23
10.92
EUR
0.04
3.19
0.01
0.70
SGD
0.00*
0.04
-
-
USD
0.50
33.35
0.43
27.35
USD
0.06
4.13
0.04
2.44
GBP
0.01
1.02
0.02
1.85
Amounts receivable in foreign currency
Amounts payable in foreign currency
* Amount is below the rounding off norm adopted by the Company.
167
Annual Report 2015-16
•
Connect with every sip
Notes forming part of the Financial Statements Rs. in Crores
52.
2016
2015
Statutory Audit
0.60
0.53
Tax Audit
0.13
0.11
Arrears for Previous year
0.14
-
Other Services
0.69
0.48
Reimbursement of Expenses (including Service tax)
0.27
0.21
a) Auditors Remuneration and expenses
53. Unless otherwise stated, figures in brackets relate to previous year and have been rearranged / regrouped wherever necessary. For Lovelock & Lewes Firm Registration No. 301056E Chartered ants Dibyendu Majumder Partner hip No. 057687 Mumbai May 24, 2016
168
Cyrus P Mistry Chairman L Krishnakumar Executive Director V Leeladhar Director John Jacob Chief Financial Officer
Ajoy Misra Managing Director Harish Bhat Director Darius Pandole Director V Madan Company Secretary
Corporate Overview 01-48
Statutory Reports 49-124
Financial Statements 125-220
Independent Auditors’ Report To the of Tata Global Beverages Limited
implementation and maintenance of adequate internal financial controls, that were operating effectively for ensuring the accuracy and completeness of the ing records, relevant to the preparation and presentation of the financial statements that give a true and fair view and are free from material misstatement, whether due to fraud or error, which has been used for the purpose of preparation of the consolidated financial statements by the Directors of the Holding Company, as aforesaid.
Report on the Consolidated Financial Statements 1.
We have audited the accompanying consolidated financial statements of Tata Global Beverages Limited (“hereinafter referred to as the Holding Company”) and its subsidiaries (the Holding Company and its subsidiaries together referred to as “the Group”), its tly controlled entities and associate companies; (refer Note 2 (b)(i) to the attached consolidated financial statements), comprising of the consolidated Balance Sheet as at March 31, 2016, the consolidated Statement of Profit and Loss, the consolidated Cash Flow Statement for the year then ended, and a summary of significant ing policies and other explanatory information prepared based on the relevant records (hereinafter referred to as “the Consolidated Financial Statements”).
Management’s Responsibility for the Consolidated Financial Statements 2.
The Holding Company’s Board of Directors is responsible for the preparation of these consolidated financial statements in of the requirements of the Companies Act, 2013 (hereinafter referred to as “the Act”) that give a true and fair view of the consolidated financial position, consolidated financial performance and consolidated cash flows of the Group including its associates and tly controlled entities in accordance with ing principles generally accepted in India including the ing Standards specified under Section 133 of the Act read with Rule 7 of the Companies (s) Rules, 2014 and ing Standard 30, Financial Instruments: Recognition and Measurement issued by the Institute of Chartered ants of India to the extent it does not contradict any other ing standard referred to in Section 133 of the Act read with Rule 7 of Companies (s) Rules, 2014. The Holding Company’s Board of Directors is also responsible for ensuring accuracy of records including financial information considered necessary for the preparation of Consolidated Financial Statements. The respective Board of Directors of the companies included in the Group and of its associates and tly controlled entities are responsible for maintenance of adequate ing records in accordance with the provisions of the Act for safeguarding the assets of the Group and its associates and tly controlled entities respectively and for preventing and detecting frauds and other irregularities; the selection and application of appropriate ing policies; making judgements and estimates that are reasonable and prudent; and the design,
Auditors’ Responsibility 3.
Our responsibility is to express an opinion on these consolidated financial statements based on our audit. While conducting the audit, we have taken into the provisions of the Act and the Rules made thereunder including the ing standards and matters which are required to be included in the audit report.
4.
We conducted our audit in accordance with the Standards on Auditing specified under Section 143(10) of the Act and other applicable authoritative pronouncements issued by the Institute of Chartered ants of India. Those Standards and pronouncements require that we comply with ethical requirements and plan and perform the audit to obtain reasonable assurance about whether the consolidated financial statements are free from material misstatement.
5.
An audit involves performing procedures to obtain audit evidence about the amounts and disclosures in the consolidated financial statements. The procedures selected depend on the auditors’ judgement, including the assessment of the risks of material misstatement of the consolidated financial statements, whether due to fraud or error. In making those risk assessments, the auditor considers internal financial control relevant to the Holding Company’s preparation of the consolidated financial statements that give a true and fair view, in order to design audit procedures that are appropriate in the circumstances. An audit also includes evaluating the appropriateness of the ing policies used and the reasonableness of the ing estimates made by the Holding Company’s Board of Directors, as well as evaluating the overall presentation of the consolidated financial statements.
6.
We believe that the audit evidence obtained by us and the audit evidence obtained by the other auditors in of their reports referred to in sub-paragraph 9 of the Other Matters paragraph below, is sufficient and appropriate to 169
Annual Report 2015-16
Opinion In our opinion and to the best of our information and according to the explanations given to us, read with the proviso and the effect of the matter referred in the paragraph 8, below the aforesaid consolidated financial statements give the information required by the Act in the manner so required and give a true and fair view in conformity with the ing principles generally accepted in India of the consolidated state of affairs of the Group, its associates and tly controlled entities as at March 31, 2016, and their consolidated profit and their consolidated cash flows for the year ended on that date.
Emphasis of Matter 8.
As mentioned in Note 48 (c) to the consolidated financial statements, the overseas subsidiaries of the group have defined benefit schemes relating to which the actuarial losses or gains are allowed to be recognized in the Reserves as per the local generally accepted ing practices followed in those respective jurisdictions. For the purpose of consolidated financial statements the holding company has adopted the ing policy in respect of actuarial gains or losses for its overseas defined benefit schemes to reflect the applicable ing framework of the respective jurisdictions and consequently ed it in the Reserves instead of in the Statement of Profit and Loss. Had the Company followed the practice of recognition of actuarial gains/losses on the aforesaid defined benefit plans in the Statement of Profit and Loss as per ing Standard (AS 15) on Employee Benefits, the charge to employee benefits expense would have been higher by Rs. 53.15 Crores, the deferred tax charge would have been lower by Rs. 10.54 Crores, the consolidated profit before taxes and minority interest would have been lower by Rs. 53.15 Crores and the consolidated profit after taxes and minority interest would have been lower by Rs. 37.77 Crores.
Our opinion on the consolidated financial statements and our report on Other Legal and Regulatory Requirements below, is not modified in respect of the above matters with respect to our reliance on the work done and the reports of the other auditors.
Report on Other Legal and Regulatory Requirements 10.
As required by Section 143(3) of the Act, we report, to the extent applicable, that:
(a)
We have sought and obtained all the information and explanations which to the best of our knowledge and belief were necessary for the purposes of our audit of the aforesaid consolidated financial statements.
(b)
In our opinion, proper books of as required by law maintained by the Holding Company, its subsidiaries included in the Group, associate companies and tly controlled entities incorporated in India including relevant records relating to preparation of the aforesaid consolidated financial statements have been kept so far as it appears from our examination of those books and records of the Holding Company and the reports of the other auditors.
(c)
The Consolidated Balance Sheet, the Consolidated Statement of Profit and Loss, and the Consolidated Cash Flow Statement dealt with by this Report are in agreement with the relevant books of
Other Matter 9.
We did not audit the financial statements/financial information of 39 subsidiaries, and 6 tly controlled entities whose financial statements/ financial information reflect total assets of Rs. 7,397.35 Crores and net assets of Rs. 5,469.71 Crores as at March 31, 2016, total revenue of Rs. 5,319.66 Crores, net loss of Rs. 160.22 Crores and net decrease in cash flows amounting to Rs. 242.28 170
Connect with every sip
Crores for the year ended on that date, as considered in the consolidated financial statements. The consolidated financial statements also include the Group’s share of net loss of Rs. 1.41 Crores for the year ended March 31, 2016 as considered in the consolidated financial statements, in respect of 4 associate companies whose financial statements/ financial information have not been audited by us. These financial statements/ financial information have been audited by other auditors whose reports have been furnished to us by the Management, and our opinion on the consolidated financial statements insofar as it relates to the amounts and disclosures included in respect of these subsidiaries, tly controlled entities and associate companies and our report in of sub-section (3) of Section 143 of the Act insofar as it relates to the aforesaid subsidiaries, tly controlled entities and associates, is based solely on the reports of the other auditors.
provide a basis for our audit opinion on the consolidated financial statements.
7.
•
Corporate Overview 01-48
(d)
(e)
(f )
Statutory Reports 49-124
maintained by the Holding Company, its subsidiaries included in the Group, associate companies and tly controlled entities incorporated in India including relevant records relating to the preparation of the consolidated financial statements.
In our opinion, the aforesaid consolidated financial statements comply with the ing Standards specified under Section 133 of the Act, read with Rule 7 of the Companies (s) Rules, 2014 and ing Standard 30, Financial Instruments: Recognition and Measurement issued by the Institute of Chartered ants of India to the extent it does not contradict any other ing standard referred to in Section 133 of the Act read with Rule 7 of Companies (s) Rules, 2014.
i.
The consolidated financial statements disclose the impact, if any, of pending litigations as at March 31, 2016 on the consolidated financial position of the Group, its associates and tly controlled entities– Refer Note 34 and 35 to the consolidated financial statements.
ii.
Provision has been made in the consolidated financial statements, as required under the applicable law or ing standards, for material foreseeable losses, if any, on longterm contracts including derivative contracts as at March 31, 2016.
iii.
There were no amounts which were required to be transferred to the Investor Education and Protection Fund by the Holding Company, and its subsidiary companies, associate companies and tly controlled companies incorporated in India during the year ended March 31, 2016.
On the basis of the written representations received from the directors of the Holding Company as on March 31, 2016 taken on record by the Board of Directors of the Holding Company and the reports of the statutory auditors of its subsidiary companies, associate companies and tly controlled companies incorporated in India, none of the directors of the Group companies, its associate companies and tly controlled companies incorporated in India is disqualified as on March 31, 2016 from being appointed as a director in of Section 164 (2) of the Act. With respect to the adequacy of the internal financial controls over financial reporting of the Holding Company, its subsidiary companies, associate companies and tly controlled companies incorporated in India and the operating effectiveness of such controls, refer to our separate Report in Annexure A.
(g)
Financial Statements 125-220
With respect to the other matters to be included in the Auditors’ Report in accordance with Rule 11 of the Companies (Audit and Auditors) Rules, 2014, in our opinion and to the best of our information and according to the explanations given to us:
For Lovelock & Lewes Firm Registration Number: 301056E Chartered ants
Place: Mumbai Date : May 24, 2016
Dibyendu Majumder Partner hip Number: 057687
171
Annual Report 2015-16
•
Connect with every sip
Annexure A to Independent Auditors’ Report Referred to in paragraph 10 (f ) of the Independent Auditors’ Report of even date to the of Tata Global Beverages Limited on the consolidated financial statements for the year ended March 31, 2016
Those Standards and the Guidance Note require that we comply with ethical requirements and plan and perform the audit to obtain reasonable assurance about whether adequate internal financial controls over financial reporting was established and maintained and if such controls operated effectively in all material respects.
Report on the Internal Financial Controls under Clause (i) of Sub-section 3 of Section 143 of the Act 1.
In conjunction with our audit of the consolidated financial statements of the Company as of and for the year ended March 31, 2016, we have audited the internal financial controls over financial reporting of Tata Global Beverages Limited (hereinafter referred to as “the Holding Company”) and its subsidiary companies, its associate companies and tly controlled companies, which are companies incorporated in India, as of that date.
4.
Our audit involves performing procedures to obtain audit evidence about the adequacy of the internal financial controls system over financial reporting and their operating effectiveness. Our audit of internal financial controls over financial reporting included obtaining an understanding of internal financial controls over financial reporting, assessing the risk that a material weakness exists, and testing and evaluating the design and operating effectiveness of internal control based on the assessed risk. The procedures selected depend on the auditor’s judgement, including the assessment of the risks of material misstatement of the financial statements, whether due to fraud or error.
5.
We believe that the audit evidence we have obtained and the audit evidence obtained by the other auditors in of their reports referred to in the Other Matters paragraph below, is sufficient and appropriate to provide a basis for our audit opinion on the Company’s internal financial controls system over financial reporting.
Management’s Responsibility for Internal Financial Controls 2.
The respective Board of Directors of the Holding company, its subsidiary companies, its associate companies and tly controlled companies, which are companies incorporated in India, are responsible for establishing and maintaining internal financial controls based on internal control over financial reporting criteria established by the Company considering the essential components of internal control stated in the Guidance Note on Audit of Internal Financial Controls Over Financial Reporting issued by the Institute of Chartered ants of India (ICAI). These responsibilities include the design, implementation and maintenance of adequate internal financial controls that were operating effectively for ensuring the orderly and efficient conduct of its business, including adherence to the respective company’s policies, the safeguarding of its assets, the prevention and detection of frauds and errors, the accuracy and completeness of the ing records, and the timely preparation of reliable financial information, as required under the Act.
Auditor’s Responsibility 3.
Our responsibility is to express an opinion on the Company’s internal financial controls over financial reporting based on our audit. We conducted our audit in accordance with the Guidance Note on Audit of Internal Financial Controls Over Financial Reporting (the “Guidance Note”) issued by the ICAI and the Standards on Auditing deemed to be prescribed under section 143(10) of the Companies Act, 2013, to the extent applicable to an audit of internal financial controls, both applicable to an audit of internal financial controls and both issued by the ICAI. 172
Meaning of Internal Financial Controls Over Financial Reporting 6.
A company’s internal financial control over financial reporting is a process designed to provide reasonable assurance regarding the reliability of financial reporting and the preparation of financial statements for external purposes in accordance with generally accepted ing principles. A company’s internal financial control over financial reporting includes those policies and procedures that (1) pertain to the maintenance of records that, in reasonable detail, accurately and fairly reflect the transactions and dispositions of the assets of the company; (2) provide reasonable assurance that transactions are recorded as necessary to permit preparation of financial statements in accordance with generally accepted ing principles, and that receipts and expenditures of the company are being made only in accordance with authorisations of management and directors of the company; and (3) provide reasonable assurance regarding prevention or timely detection of unauthorised acquisition, use, or disposition of the company’s assets that could have a material effect on the financial statements.
Corporate Overview 01-48
Inherent Limitations of Internal Financial Controls Over Financial Reporting 7.
Because of the inherent limitations of internal financial controls over financial reporting, including the possibility of collusion or improper management override of controls, material misstatements due to error or fraud may occur and not be detected. Also, projections of any evaluation of the internal financial controls over financial reporting to future periods are subject to the risk that the internal financial control over financial reporting may become inadequate because of changes in conditions, or that the degree of compliance with the policies or procedures may deteriorate.
Statutory Reports 49-124
Financial Statements 125-220
Company considering the essential components of internal control stated in the Guidance Note on Audit of Internal Financial Controls Over Financial Reporting issued by the Institute of Chartered ants of India.
Other Matters 9.
Our aforesaid reports under Section 143(3)(i) of the Act on the adequacy and operating effectiveness of the internal financial controls over financial reporting insofar as it relates to 2 subsidiary companies, 3 associate companies and 2 tly controlled companies, which are companies incorporated in India, is based on the corresponding reports of the auditors of such companies incorporated in India. Our opinion is not qualified in respect of this matter.
Opinion 8.
In our opinion, the Holding Company, its subsidiary companies, its associate companies and tly controlled companies, which are companies incorporated in India, have, in all material respects, an adequate internal financial controls system over financial reporting and such internal financial controls over financial reporting were operating effectively as at March 31, 2016, based on the internal control over financial reporting criteria established by the
For Lovelock & Lewes Firm Registration Number: 301056E Chartered ants
Place: Mumbai Date : May 24, 2016
Dibyendu Majumder Partner hip Number: 057687
173
Annual Report 2015-16
•
Connect with every sip
Consolidated Balance Sheet As At March 31, 2016
Equity and Liabilities Shareholders' Funds Share Capital Reserves and Surplus Share Suspense Minority Interest Non-Current Liabilities Long Term Borrowings Deferred Tax Liabilities (Net) Other Long Term Liabilities Long Term Provisions Current Liabilities Short Term Borrowings Trade Payables Other Current Liabilities Short Term Provisions Total Assets Non-Current Assets Fixed Assets Tangible Assets Intangible Assets Goodwill on Consolidation Capital Work in Progress Intangible Assets under Development
Note 4 5
63.11 5655.81
6 7 8 9
505.53 179.81 6.09 260.28
10
293.07 758.22 741.27 273.86
11 12
5718.92 880.69
951.71
2066.42 9617.74
854.79 202.50 3791.79 43.89 4892.97 600.57 42.28 240.40 70.50 8.59 1728.11 632.08 538.93 819.17 44.14
5846.72
3771.02 9617.74
This is the Consolidated Balance Sheet referred to in our Report of even date.
For and on behalf of the Board
For Lovelock & Lewes Firm Registration No. 301056E Chartered ants
Cyrus P Mistry Chairman L KrishnaKumar Executive Director V Leeladhar Director John Jacob Chief Financial Officer
Mumbai 24th May, 2016 174
61.84 5429.68
883.94 156.42 79.58 224.99 382.03 759.37 387.32 269.18
5491.52 1.27 876.21
1344.93
1797.90 9511.83
13
Non-current Investments 14 Deferred Tax Assets (Net) 15 Long Term Loans and Advances 16 Other non-current Assets 17 Current Assets Current Investments 18 Inventories 19 Trade Receivables 20 Cash and Bank Balances 21 Short Term Loans and Advances 22 Other Current Assets 23 Total Summary of Significant ing Policies 3 The Notes are an integral part of the Consolidated Financial Statements
Dibyendu Majumder Partner hip No. 057687
Rs in Crores 2015
2016
779.81 249.76 3892.12 46.98 0.19 4968.86 617.76 54.25 189.32 70.50 4.26 1625.30 616.09 544.24 791.59 29.66
5900.69
3611.14 9511.83
Ajoy Misra Managing Director Harish Bhat Director Darius Pandole Director V Madan Company Secretary
Corporate Overview 01-48
Statutory Reports 49-124
Financial Statements 125-220
Consolidated Statement of Profit and Loss For The Year Ended March 31, 2016
Note Income Revenue from Operations-Net 24 Other Income 25 Total Revenue Expenses Cost of Materials Consumed 26 Purchase of Stock in Trade 27 Change in Inventories of Finished Goods/Work-in-progress/ 28 Stock in Trade Employee Benefits Expense 29 Finance Costs 30 Depreciaton and Amortisation Expense Less : Amount drawn from Revaluation Reserve Other Expenses 31 Total Expenses Profit before Exceptional Items and Taxes Exceptional Items 32 Profit before Tax Tax expenses Current tax (Refer Note 38) Less : MAT Credit Entitlement Net Current tax Deferred tax Profit after Taxation before Share of results of Associates and Minority Interest Share of net profit/(loss) in Associates Minority Interest Profit for the year Earnings Per Share 42 Equity share of nominal value of Re. 1 each Basic and Diluted (Rs.) The Notes are an integral part of the Consolidated Financial Statements
Rs in Crores 2015
2016 8110.51 70.60
7993.39 69.98 8181.11
8063.37
3605.00 330.54 (10.13)
3625.12 263.47 (51.25)
902.01 68.77 142.93 2608.43
857.67 81.86 135.77 (2.67) 2523.53 7647.55 533.56 11.88 545.44
219.86 39.00 180.86 29.54
7433.50 629.87 (129.99) 499.88 168.36 168.36 47.16
210.40 335.04 (1.41) (7.72) 325.91
(10.88) (25.66) 247.82
5.16
3.93
This is the Consolidated Statement of Profit and Loss referred to in our Report of even date.
For and on behalf of the Board
For Lovelock & Lewes Firm Registration No. 301056E Chartered ants
Cyrus P Mistry Chairman L KrishnaKumar Executive Director V Leeladhar Director John Jacob Chief Financial Officer
Dibyendu Majumder Partner hip No. 057687
215.52 284.36
Ajoy Misra Managing Director Harish Bhat Director Darius Pandole Director V Madan Company Secretary
Mumbai 24th May, 2016 175
Annual Report 2015-16
•
Connect with every sip
Consolidated Cash Flow Statement For The Year Ended March 31, 2016
A.
B.
Cash Flow from Operating Activities Net Profit before Tax Adjusted for : Depreciation and Amortisation (net of withdrawals from Revaluation Reserve) Dividend Income Profit on Sale of Long Term Trade Investments Profit on sale of current investments (net) Unrealised foreign exchange (gain) / loss Finance Cost Interest Income Provision for doubtful debts and advances Liabilities no longer required written back Debts and advances written off Provision for doubtful debts and advances no longer required written back (Profit) / loss on sale / discard of fixed assets (net) Other Exceptional Expense / (Income) (net) Operating Profit before working capital changes Adjustments for: Trade and other receivables Inventories Trade payables Cash generated from operations before Exceptionals Outflow on of Exceptional Items Direct taxes paid Net Cash from Operating Activities Cash Flow from Investing Activities Purchase of fixed assets Sale of fixed assets Purchase of Long Term Investments Sale of Long Term Investments Additional Investments in Subsidiaries (Purchase) / Sale of Current Investments (net) Dividend Income (including dividend from associates) Interest received Redemption of Bank Deposits (net) Inter Corporate Loans and Deposits (net) Net cash from / (used in) Investing Activities
176
2016
Rs in Crores 2015
545.44
499.88
142.93 (22.43) (327.79) (1.32) 1.05 68.77 (43.52) 2.39 (20.69) 5.59
133.11 (15.70) (0.75) 0.48 81.86 (52.02) 0.34 (50.43) 0.42
(0.07) (2.18) 315.91
(0.04) 1.02 120.33
(71.76) (102.54) (103.27)
118.64 664.08
(277.57) 386.51 (28.05) (246.94) 111.52
(166.24) 9.66 (0.31) 336.64 (3.37) 30.82 17.76 (0.25) 68.44
(19.28) (135.88) 23.12
218.62 718.50
(132.04) 586.46 (168.65) 417.81
(179.23) 0.37 (72.55) (93.19) (2.63) 24.17 36.97 111.24 293.15
(174.85)
Corporate Overview 01-48
Statutory Reports 49-124
Financial Statements 125-220
Rs in Crores 2015
2016 C.
D.
Cash Flow from Financing Activities Repayment of long term borrowings Working capital facilities (net) Dividend paid Dividend tax paid Interest paid Net Cash used in Financing Activities Net increase / (decrease) in Cash and Cash Equivalents Cash and Cash Equivalents Balances at the beginning of the year Exchange Gain/ (Loss) on translation of foreign currency cash/ cash equivalents Balances at the end of the year Cash and Cash Equivalents comprises of: Cash, Bank Balances in Current and Mutual Funds Short-Term Bank Deposits Balances at the end of the year
(80.38) (95.89) (159.09) (28.04) (65.62)
(180.86) 49.78 (161.46) (17.83) (82.01) (429.02) (24.35)
(392.38) (149.42)
536.53 18.59
718.15 (32.20)
530.77
536.53
255.19 275.58 530.77
85.12 451.41 536.53
Notes: 1 The above Cash Flow Statement has been prepared under the ' Indirect Method' as set out in the ing Standard on Cash Flow Statements (AS-3) specified under Section 133 of the Companies Act, 2013 read with Rule 7 of the Companies (s) Rules, 2014 2 Previous year's figures have been rearranged/regrouped wherever necessary. This is the Cash Flow statement referred to in our Report of even date. This is the Cash Flow statement referred to in our Report of even date.
For and on behalf of the Board
For Lovelock & Lewes Firm Registration No. 301056E Chartered ants
Cyrus P Mistry Chairman L KrishnaKumar Executive Director V Leeladhar Director John Jacob Chief Financial Officer
Dibyendu Majumder Partner hip No. 057687
Ajoy Misra Managing Director Harish Bhat Director Darius Pandole Director V Madan Company Secretary
Mumbai 24th May, 2016
177
Annual Report 2015-16
•
Connect with every sip
Notes to Consolidated Financial Statements
1.
General Information
Tata Global Beverages Limited (“the Holding Company”) and its subsidiaries, t ventures and associates (together, “the Group”) is a global beverages company engaged in the trading, production and distribution of Tea, Coffee and Water. The group has branded beverage business operations mainly in India, Europe, US, Canada and Australia, plantation business in India /Sri Lanka and extraction business mainly in lndia, US and China.
2.
(a) Basis of Consolidation
The consolidated financial statements comprises of the financial statements of the Group. The consolidated financial statements are prepared in accordance with ing Standard 21 on “Consolidated Financial Statements”, ing Standard 23 on “ing for Associates in Consolidated Financial Statements” and ing Standard 27 on “Financial Reporting of Interests in t Ventures” as required under Companies Act, 2013. The consolidated financial statements are prepared on the following basis:
(i) Investment in Subsidiaries The financial statements of the Holding Company and its subsidiary companies have been combined on a line by line basis by adding together like items of assets, liabilities, income and expenses. The intra-group balances, intra-group transactions and unrealised profits or losses thereon have been fully eliminated.
178
The financial statements of the subsidiaries used in the consolidation are drawn up to the same reporting date as that of the Holding Company.
The value of the consideration given over / below the net value of the identifiable assets acquired in the subsidiary companies are recognised as goodwill / capital reserve. Goodwill on consolidation disclosed under fixed assets is not amortised but is, however, tested for impairment.
(ii) Investment in Associates Investments in associates have been ed for using the equity method whereby the investment is initially recorded at cost and adjusted thereafter for post acquisition change in the Holding Company’s share of net assets. On acquisition of an associate, the goodwill/capital reserve from such acquisition is included in the carrying value of the investment and also disclosed separately. (iii) Investment in t Ventures t Venture of Holding Company as well as subsidiaries has been ed in the consolidated financial statements using the proportionate consolidation method whereby a venturer’s share of each of the assets, liabilities, income and expenses of the tly controlled entity is ed for on a pro-rata basis.
Corporate Overview 01-48
Financial Statements 125-220
Statutory Reports 49-124
Notes to Consolidated Financial Statements
b)
i) The subsidiaries, t ventures and associates considered in the consolidated financial statements are: Name of the Companies
Effective Voting Effective Country of Voting Incorporation power voting power power voting power held by the held held by the held Holding Holding Company Company (%)
(%)
(%) 2016
A)
(%) 2015
SUBSIDIARIES
Tata Global Beverages Group Ltd. [58.59% through subsidiaries]
UK
88.65
88.65
88.65
88.65
Tata Global Beverages Holdings Ltd.
UK
100.00
88.65
100.00
88.65
Tata Global Beverages Services Ltd.
UK
100.00
88.65
100.00
88.65
Tata Global Beverages GB Ltd.
UK
100.00
88.65
100.00
88.65
Tata Global Beverages Overseas Holdings Ltd.
UK
100.00
88.65
100.00
88.65
Tata Global Beverages Overseas Ltd.
UK
100.00
88.65
100.00
88.65
Lyons Tetley Ltd.
UK
100.00
88.65
100.00
88.65
Drassington Ltd.
UK
100.00
88.65
100.00
88.65
Teapigs Ltd.
UK
100.00
88.65
100.00
88.65
Teapigs US LLC
USA
100.00
88.65
100.00
88.65
Stansand Ltd.
UK
100.00
88.65
100.00
88.65
Stansand (Brokers) Ltd.
UK
100.00
88.65
100.00
88.65
Stansand (Africa) Ltd.
Kenya
100.00
88.65
100.00
88.65
Stansand (Central Africa) Ltd.
Malawi
100.00
88.65
100.00
88.65
South Africa
51.00
45.21
51.00
45.21
Subsidiaries of Tata Global Beverages Group Ltd.
Joekels Tea Packers (Proprietary) Ltd.
Poland
100.00
88.65
100.00
88.65
Czech Republic
100.00
88.65
100.00
88.65
Tata Global Beverages US Holdings Inc.
USA
100.00
88.65
100.00
88.65
Tetley USA Inc.
USA
100.00
88.65
100.00
88.65
Good Earth Corporation.
USA
100.00
88.65
100.00
88.65
Good Earth Teas Inc.
USA
100.00
88.65
100.00
88.65
Tata Global Beverages Canada Inc.
Canada
100.00
88.65
100.00
88.65
Tata Global Beverages Australia Pty Ltd.
Australia
100.00
88.65
100.00
88.65
Earth Rules Pty Ltd.
Australia
100.00
88.65
100.00
88.65
UK
100.00
88.65
100.00
88.65
Campestres Holdings Ltd.
Cyprus
100.00
88.65
100.00
88.65
Kahutara Holdings Ltd.
Cyprus
65.00
57.62
65.00
57.62
Suntyco Holding Ltd.
Cyprus
100.00
57.62
100.00
57.62
Onomento Co Ltd.
Cyprus
100.00
57.62
100.00
57.62
Tata Global Beverages Polska sp.zo.o Tata Global Beverages Czech Republic a.s.
Tata Global Beverages Investments Ltd.
179
Annual Report 2015-16
•
Connect with every sip
Notes to Consolidated Financial Statements
Name of the Companies
Effective Voting Effective Country of Voting Incorporation power voting power power voting power held by the held held by the held Holding Holding Company Company (%)
(%)
(%) 2016
(%) 2015
OOO Tea Trade LLC
Russia
100.00
57.62
100.00
57.62
OOO Sunty LLC
Russia
100.00
57.62
100.00
57.62
Empirical Group LLC
USA
56.00
49.64
56.00
49.64
Southern Tea LLC
USA
50.00
44.33
50.00
44.33
Bangladesh
50.00
44.33
50.00
44.33
Pakistan
50.00
44.33
50.00
44.33
USA
-
-
32.80
29.08
UK
100.00
100.00
100.00
100.00
India
57.48
57.48
57.48
57.48
USA
100.00
78.70
100.00
78.70
Eight O’Clock Holdings Inc.
USA
100.00
78.70
100.00
78.70
Eight O’Clock Coffee Inc.
USA
100.00
78.70
100.00
78.70
USA
-
-
27.09
21.32
USA
100.00
100.00
100.00
100.00
China
81.46
81.46
70.00
70.00
India
100.00
100.00
100.00
100.00
India
41.03
41.03
41.03
41.03
Sri Lanka
31.85
31.85
31.85
31.85
Kanan Devan Hills Plantations Co. Pvt. Ltd.
India
28.52
28.52
28.52
28.52
TRIL Constructions Ltd.
India
32.50
32.50
32.50
32.50
NourishCo Beverages Ltd.
India
50.00
50.00
50.00
50.00
Tata Starbucks Pvt. Ltd.
India
50.00
50.00
50.00
50.00
t ventures of Tata Global Beverages Group Ltd.
Tetley ACI (Bangladesh) Ltd. Tetley Clover (Pvt.) Ltd. Associates of Tata Global Beverages Group Ltd. RBC HoldCo. LLC (Refer Note (ii) below) Tata Global Beverages Capital Ltd. Tata Coffee Ltd. Subsidiaries of Tata Coffee Ltd. Consolidated Coffee Inc. Subsidiary of Consolidated Coffee Inc.
Associates of Consolidated Coffee Inc. RBC HoldCo LLC (Refer Note (ii) below) Tata Tea Extractions Inc. Zhejiang Tata Tea Extraction Company Ltd. (Refer Note (iii) below) Tata Tea Holdings Pvt. Ltd. B)
ASSOCIATES
Amalgamated Plantations Pvt. Ltd. Estate Management Services Pvt. Ltd.
C)
180
T VENTURES
Corporate Overview 01-48
Statutory Reports 49-124
Financial Statements 125-220
Notes to Consolidated Financial Statements
ii)
The entity formed post sale of the entire stake in a US based functional beverage company has been dissolved during the year, the same has not been consolidated for part of the year as the control was intended to be temporary.
iii)
With effect from March 25, 2016 the Holding Company converted the shareholder loan into equity in Zhejiang Tata Tea Extraction Company Ltd.
iv)
v)
vi)
The Holding Company during previous year amalgamated, pursuant to a Scheme of Amalgamation, Mount Everest Mineral Water Limited (subsidiary of the Holding Company) with the Holding Company as sanctioned by Honorable High Courts of Himachal Pradesh and Calcutta, retrospectively with effect from April 1, 2013. European Bank of Reconstruction and Development (EBRD) has entered into a put option agreement with Campestres Holdings Ltd. (CHL) and Tata Global Beverages Investments Ltd. (TGBIL), overseas subsidiaries of the holding company, in relation to their investment in Kahutara Holdings Ltd. In of the said agreement, EBRD has the right to exercise a put option whereby CHL and TGBIL are obliged to purchase the shares held by EBRD at fair market value after 6 years from the subscription date. Conversely, CHL has the right to exercise a call option on all the shares held by EBRD at the end of the stipulated 8 years at fair market value. The stipulated time period of 8 years may be bought forward if certain events as per the agreement are triggered. The Holding Company had entered into a put option agreement with International Finance Corporation (IFC) in relation to their investment in Amalgamated Plantations Private Limited (APPL) under which IFC could exercise a put option, by April 28, 2016, with an obligation on the Holding Company to purchase a maximum of 300 Lakh shares in APPL. This option was not exercised by IFC.
3. Significant ing Policies a) ing Convention
The financial statements have been prepared in accordance with the historical cost convention on an accrual basis and comply with the applicable
ing Standards specified under section 133 of the Companies Act, 2013 read with Rule 7 of the Companies (s) Rules, 2014 and ing Standard – 30 on Financial Instruments to the extent it does not contradict any other ing Standard.
These Financial Statements have been prepared as required under relevant provision of the Companies Act, 2013 and the presentation is based on the Schedule III of the Companies Act, 2013. All assets and liabilities are classified into current and noncurrent generally based on the criteria of realisation/settlement within twelve months period from the balance sheet date.
b. Fixed Assets and Depreciation
i) Tangible Tangible Assets are carried at cost of acquisition less accumulated depreciation and accumulated impairment losses, if any. Cost of extension planting of cultivable land including cost of development is capitalised. Assets acquired on hire purchase, for which ownership will vest at a future date, are capitalised at cash cost. Subsidies receivable from government in respect of fixed assets are deducted from the cost of respective assets as and when they accrue.
Depreciation is provided on assets, including assets created on land under lease, on a straight-line basis over the estimated useful life of fixed assets as stipulated by Schedule II of Companies Act, 2013 or as appropriate based on technical evaluation of the asset. Renewal of land leases is assumed, consistent with past practice. Estimated useful lives of assets are as follows: Leasehold buildings Leasehold Improvements Buildings Plant and Machinery Furniture and Fixtures Office Equipments Motor Vehicles
- Over the life of lease - Over the life of lease -
30 to 60 years 3 to 25 years 7 to 16 years 2 to 16 years 4 to 10 years
181
Annual Report 2015-16
•
Connect with every sip
Notes to Consolidated Financial Statements
ii) Intangible
Intangibles assets are stated at acquisition cost, net of accumulated amortisation and accumulated impairment loss, if any. Expenditure on software and related implementation cost, product development cost on new products, non-compete fee and other intangibles items, qualifying for recognition as intangibles assets and which provide enduring benefits are recognized as such.
interest cost so as to achieve a constant periodic rate of interest on the outstanding liability for each year.
e) Borrowing Costs
Intangible assets are amortised over their estimated useful life on a straight line basis. Estimated useful lives are as follows:
-
10 years
Trademark
-
25 years
Computer Software
-
5 to 10 years
f) Investments
Non-Compete Fees
-
10 years
At each balance sheet date, the management assesses whether there are any indications that the assets are impaired. If any such indication exists, the recoverable amount of the asset is estimated in order to determine the extent of impairment loss. Recoverable amount is the higher of an asset’s net selling price and its value in use. Value in use is the present value of estimated future cash flows expected from the continuing use of the asset and from its disposal at the end of its useful life. For certain cash generating units, variable growth is considered even beyond five years, given the potential of the business. Reversal of impairment loss is recognised as income in the statement of profit and loss.
182
Lease of assets where the Group, as a lessee, has substantially assumed all the risks and rewards of ownership are classified as finance leases. Finance leases are capitalised at the inception of the lease at lower of the fair value or the present value of the minimum lease payments and a liability is recognised for an equivalent amount. Each lease rental is allocated between the liability and the
Investments of a long-term nature are stated at cost, less adjustment for any diminution, other than temporary, in the value thereof. Current investments are stated at lower of cost or fair value.
g) Inventories
Inventories, other than stores and spares are stated at cost or net realisable value whichever is lower. Stores and spares are carried at cost, provision is made for obsolete, slow-moving and defective stocks, where necessary.
Cost is determined on weighted-average/FIFO method for all categories of inventories other than for auction / privately bought teas in which case cost is considered as actual cost for each lot. Cost comprises expenditure incurred in the normal course of business in bringing such inventories to its present location and condition, where applicable, includes, appropriate overheads based on the normal level of activity.
d) Leases
Borrowing costs that are directly attributable to the acquisition, construction or production of qualifying assets are capitalised as part of such assets. Borrowing costs include amortisation of issue / ancillary costs relating to the borrowings which are appropriately amortised over the expected term of the borrowing.
Patent /Knowhow
c) Impairment
Lease arrangements where the risks and rewards incidental to ownership of an asset substantially vest with the lessor, are recognised as operating leases. Lease rental under operating leases are recognised in the statement of profit and loss on a straight line basis over the period of lease.
h) Foreign Currency Transactions / Translation
i) Foreign Currency Transactions Transactions in foreign currency are recorded at a rate that approximates the prevalent exchange rate on the transaction date. Exchange differences resulting from settled transactions are adjusted in the statement of
Corporate Overview 01-48
Statutory Reports 49-124
Financial Statements 125-220
Notes to Consolidated Financial Statements
profit and loss. Year-end balances of monetary items are restated at the year-end exchange rates and the resultant net gain or loss is recognised in the statement of profit and loss.
or discount on forward contracts where there are underlying assets/liabilities are amortised over the life of the contract. Such foreign exchange forward contracts are revalued at the balance sheet date and the exchange differences between the spot rate at the date of the contract and the spot rate on the balance sheet date is recognised as gain/loss in the statement of profit and loss.
ii) Foreign Currency Translation In relation to non-integral overseas subsidiaries/t ventures all assets and liabilities are translated at the yearend exchange rates, where as income and expenditure are translated at an exchange rate that approximates the prevalent exchange rate on the transaction date. All resulting exchange differences are cumulated in Foreign Currency Translation Reserve until the disposal of net investment. On disposal of the net investment, the amount accumulated in Foreign Currency Translation Reserve is recognized in the statement of profit and loss.
Dividend income are recognised when the right to receive dividend is established
k) Replanting/Rejuvenation
Cost of replanting / rejuvenating tea / coffee bushes / fuel trees is charged to revenue.
Related Tea / Coffee Board subsidies are accrued as other income on obtaining approval from Tea / Coffee Board.
Compensation for Land
l)
Compensation, if any, in respect of land surrendered or incidental rights thereon vested in Governments under various State Land Legislations in India is ed for as and when received.
m) Employee Benefits
i)
Post retirement employee benefits: Contribution to post retirement defined benefit and contribution schemes like Provident Fund (PF), Superannuation Schemes and other such schemes are ed for on accrual basis by the Group. With regard to PF contribution made by the holding company to a Self istered Trust, holding company is generally liable for annual contributions and any shortfall in the fund assets based on the government specified minimum rates of return and recognises such contribution and shortfall, if any, as an expense in the year incurred.
Post retirement defined benefits including gratuity, pension and medical benefits for qualifying executives/wholetime directors as provided by the Group are determined through independent actuarial valuation at year end and charge recognised in the statement of profit and loss. For schemes, where recognised funds have been set up, annual contributions determined as payable in the actuarial valuation report are contributed. Actuarial gains and losses are recognised in the statement of profit and loss.
The Group recognises in the statement of profit and loss, gains or losses on curtailment
i) Revenue Recognition
In respect of integral foreign operations, the financial statements are translated as if the transactions of the foreign operations are those of the Holding Company.
Sales are recognised when significant risks and rewards of ownership in the goods are transferred to the buyer as per the of contract. Provisions for sales returns and other off invoice allowances relating to that year’s sale are offset from sales. Income and fees from services are ed as per of relevant agreements /arrangements. Export incentives are ed on an accrual basis.
j) Other Income
Interest income and income from investments are ed on an accrual basis.
183
Annual Report 2015-16
•
Connect with every sip
Notes to Consolidated Financial Statements
management’s expectation of future profits for set off with reasonable or virtual certainty, as applicable, deferred tax assets pertaining to business loss are recognised. Deferred tax assets and liabilities are offset when legal right exist. The resultant net balances are reported, as appropriate.
or settlement of a defined benefit plan as and when the curtailment or settlement occurs.
ii)
iii)
iv)
Other Employee Benefits: Other employee benefits are ed for on accrual basis. Liabilities for compensated absences are determined based on independent actuarial valuation at year end and charge is recognised in the statement of profit and loss. Short Term Employee Benefits are recognised on an undiscounted basis whereas Long Term Employee Benefits are recognised on a discounted basis. Employee Termination Benefits: Payments to employees on termination along with additional liabilities towards retirement benefits arising pursuant to the termination are charged to the statement of profit and loss in the year in which it is incurred.
p) Financial Instruments
Foreign currency forward contracts, interest rate swaps and options relating to commodities and foreign currencies are used to hedge associated risk relating to certain firm commitments and forecasted transactions. The Group designates these hedging instruments as cash flow hedges.
Hedging instruments are initially measured at fair value and are re-measured at subsequent reporting dates. Gain or loss on of change in the fair value of hedging instrument in respect of effective portion of the cash flow hedges are recognised in the hedging reserve . On occurrence of the underlying transactions the accumulated balance is transferred from hedging reserve and recognised in the statement of profit and loss. The portion of the gain or loss on the hedging instruments if determined to be an ineffective cash flow hedge is recognised in the statement of profit and loss. Fair value hedges are marked to market on the balance sheet date and gain or loss recognised in the statement of profit and loss.
Cash and Cash Equivalent
With regard to overseas subsidiaries and associates, liabilities for retirement benefits are determined as per the regulations and principles followed in the respective countries. Defined benefit obligation of overseas subsidiaries ed for in the reserves in its financial statements, in compliance with the local generally accepted ing principles, are recognised in Group’s Reserve and Surplus (Refer Note 48(c).
n) Research and Development
q)
Research and Development expenditure of revenue nature is charged to revenue and capital expenditure is treated as fixed assets.
Taxes on Income
Current Income Tax is measured at the amount expected to be paid to the tax authorities in accordance with local laws of various jurisdiction where the Group operates.
Deferred tax is recognized on all timing differences to the extent that it is probable that a liability or asset will crystallize in accordance with local practices of various jurisdictions where the Group operates. As at the balance sheet date, unless there is evidence to the contrary, based on
o)
184
Cash and Cash equivalents for the purpose of cash flow statement comprise of cash at bank and in hand and short term investments with an original maturity of three months or less.
r)
Provision Provisions are recognised when there is a present obligation as a result of past event and it is probable that an outflow of resources embodying economic benefits will be required to settle the obligation and a reliable estimate can be made of the amount of the obligation. Provisions are measured at the best estimate of the expenditure required to settle the obligation at the reporting date and are not discounted to its present value. These estimates are reviewed at each reporting date and adjusted to reflect the current best estimates.
Corporate Overview 01-48
Statutory Reports 49-124
Financial Statements 125-220
Notes to Consolidated Financial Statements
s)
Contingent Liabilities Contingent liabilities exist when there is a possible obligation arising from past events, the existence of which will be confirmed only by the occurrence or non occurrence of one or more uncertain future events not wholly within the control of the Group,
or a present obligation that arises from past events where it is either not probable that an outflow of resources will be required or the amount cannot be reliably estimated. Contingent liabilities are appropriately disclosed unless the possibility of an outflow of resources embodying economic benefits is remote.
2016
Rs in Crores 2015
110.00
75.00
63.11 63.11
61.84 61.84
2016
2015
No of shares
No of shares
% of holding
% of holding
142854570
142854570
22.63%
23.10%
54416998
31213954
8.62%
5.05%
43175140
43175140
6.84%
6.98%
2016
2015
618398570
618398570
12731159
-
631129729
618398570
4. Share Capital AUTHORISED 1100000000 (750000000) Equity Shares of Re.1 each* ISSUED, SUBSCRIBED AND PAID-UP 631129729 (618398570) Equity Shares of Re.1 each, fully paid-up a) Details of Shareholders holding more than 5% shares as at March 31, 2016 is set out as below : Particulars
Name of Share holder
Tata Sons Limited
Life Insurance Corporation of India Tata Chemicals Limited
b) Reconciliation of the number of shares as at March 31, 2016 is set out below : Particulars
Number of shares as at the beginning of the year
Add: Shares issued during the year *
Number of shares as at the end of the year
c) Rights, preferences and restrictions of equity shares :
The Holding Company has one class of equity shares having a par value of Re 1 each. Each shareholder is eligible for one vote per share held. The dividend proposed by the Board of Directors is subject to the approval of the shareholders in the ensuing Annual General Meeting, except in case of interim dividend. In the event of liquidation, the equity shareholders are eligible to receive the remaining assets of the Holding Company after distribution of all preferential amounts, in proportion to their shareholding.
*Consequent to and as part of the amalgamation of the esrtwhile Mount Everest Mineral Water Limited with the Holding Company ,the Authorised Share Capital of the Holding Company stand increased to Rs 110 Crores made up of 1100000000 Equity Shares of Re. 1/- each with effect from May 18, 2015 (effective date of amalgamation). Pursuant to this amalgamation, the Holding Company during the year has issued 12731159 equity shares which was ed under Shares Suspense in the previous year (Refer Note 2b(iv). 185
Annual Report 2015-16
•
Connect with every sip
Notes to Consolidated Financial Statements
Rs in Crores 2016
2015
15.79
0.09
5. Reserves and Surplus Capital Reserves Opening Balance Add: Addition on amalgamation (Refer Note 2b(iv) Closing Balance Capital Redemption Reserve
-
15.70
15.79
15.79
0.10
0.10
333.79
552.93
-
(219.14)
333.79
333.79
81.25
81.25
Securities Opening Balance Less: Deduction on amalgamation (Refer Note 2b(iv) Closing Balance Debenture Redemption Reserve Revaluation Reserve 41.23
42.07
Add: Other Adjustments
-
1.83
Less: Amount transferred to Statement of Profit and Loss
-
(2.67)
Opening Balance
41.23
41.23
Contingency Reserve
Closing Balance
1.00
1.00
Amalgamation Reserves
8.33
8.33
Foreign Currency Translation Reserve Opening Balance
678.88
926.35
Add: Movements during the year (net)
129.17
(236.63)
-
(10.84)
808.05
678.88
22.89
(9.79)
Less: Amount transferred to Statement of Profit and Loss * Closing Balance Hedging Reserve Opening Balance Add/(Less): Movement during the year (net) Closing Balance
(26.35)
32.68
(3.46)
22.89
(135.19)
(92.54)
(37.77)
(42.65)
(172.96)
(135.19)
1051.06
1001.57
67.35
49.49
1118.41
1051.06
Actuarial Gain/(Loss) Reserve Opening Balance Add/(Less): Movement during the year (net) Closing Balance General Reserves Opening Balance Add: Transferred from Surplus Closing Balance * Repesents reversal on disposal of an overseas associate
186
Corporate Overview 01-48
Financial Statements 125-220
Statutory Reports 49-124
Notes to Consolidated Financial Statements
Rs in Crores 2016
2015
3330.55
3275.64
325.91
247.82
Surplus in the Statement of Profit and Loss Opening Balance Add: Profit for the year Add: Adjustment on Amalgamation (Refer Note 2b(iv) Amount available for appropriation
-
20.64
3656.46
3544.10
Less : Appropriation (142.00)
(142.00)
Provision for Dividend Distribution Tax
(22.83)
(21.24)
Transfer to General Reserve
(67.35)
(49.49)
Proposed Dividend
-
(0.82)
Net Surplus in the Statement of Profit and Loss
3424.28
3330.55
Total Reserve and Surplus
5655.81
5429.68
Adjustment on evaluation of useful life of Fixed Assets
Rs in Crores 2016
2015
6. Long Term Borrowings Secured (unless otherwise stated) Debentures 3250, 3% Non-convertible, privately placed, Debentures of Rs10 Lakhs each. (Refer Note a) Less : Maturing within the next 12 months
325.00
325.00
(325.00)
-
325.00
Loan From Banks Term Loan (Refer Note b)
19.78
34.66
Less : Maturing within the next 12 months
(9.01)
(11.18) 10.77
External Commercial Borrowing (Refer Note c) Less : Maturing within the next 12 months
23.48
20.71
35.16
(16.57)
(15.63) 4.14
19.53
Senior Debt (Refer Note d)
523.74
547.18
Less : Maturing within the next 12 months
(33.12)
(31.25) 490.62
Total Long Term Borrowings Total Long Term Borrowings (Gross) Less: Total Maturing within the next 12 months
515.93
505.53
883.94
889.23
942.00
(383.70)
(58.06) 505.53
883.94
187
Annual Report 2015-16
•
Connect with every sip
Notes to Consolidated Financial Statements a.
Redeemable at of Rs.223205 per debenture on October 22, 2016, at the end of 3 years from the date of allotment October 22, 2013. Secured by way of a first mortgage on certain immovable assets and partly by pledge of shares of certain companies held as investments by the Holding Company.
b.
Debt amounting to Rs 3.62 Crores (Rs 10.68 Crores) is repayable in quarterly installments, last installment due in September 2016, secured by way of mortgage of certain immovable and movable properties of an overseas subsidiary and guarantee given by the Holding Company. Debts amounting to Rs 16.16 Crores (Rs 23.98 Crores) is repayable in equal installments and is secured by way of mortgage on certain immovable property of an overseas subsidiary.
c.
Repayable in sixteen equal quarterly installments commencing from September 3, 2013.The borrowing is secured by deposit of title deeds of a immovable property and a charge over the machinery of an expansion project of an Indian subsidiary.
d.
Debt is repayable within March 28, 2018 and is secured over assets of certain overseas subsidiaries. Rs in Crores 2016
2015
195.68
178.22
7. Deferred Tax Liabilities (net) Deferred Tax Liability Depreciation Others
2.66
1.29
198.34
179.51
Deferred Tax Asset
Provision for Doubtful Debts/Advances
0.25
1.22
Employee Benefits
4.66
4.73
13.62
17.14
Others Net Deferred Tax Liabilities
18.53
23.09
179.81
156.42 Rs in Crores
2016
2015
-
72.54
2.89
3.02
8. Other Long Term Liabilities payable on Redemption of Debentures Deposits Others
3.20
4.02
6.09
79.58 Rs in Crores
2016
2015
260.28
224.99
260.28
224.99
9. Long Term Provisions Employee Benefits
188
Corporate Overview 01-48
Statutory Reports 49-124
Financial Statements 125-220
Notes to Consolidated Financial Statements
Rs in Crores 2016
2015
248.07
289.79
10. Short Term Borrowings From Banks Secured Working Capital Facilities (Refer below) Unsecured Working Capital Facilities
45.00
92.24
293.07
382.03
Secured by way of hypothecation of inventories, book debts of the holding company. For an Indian subsidiary, working capital facility is secured by hypothecation of coffee crop, stocks and receivables, whilst a part of the working capital facilities is also secured by deposit of title deeds of a coffee estate. For overseas subsidiaries working capital facilities are secured by specific security over certain assets and in an instance by a guarantee given by the Holding Company. Rs in Crores 2016
2015
383.70
58.05
11. Other Current Liabilties Current Maturities of Long Term Borrowings (Refer Note 6)
38.03
35.74
Unpaid Dividends*
8.16
7.71
Interest Accrued but not due
5.02
5.53
Security Deposits from Customers
payable on Redemption of Debentures Other Payables
72.54
-
233.82
280.29
741.27
387.32
* There are no amounts due to and ourstanding to be credited to the Investor Education and Protection Fund. Rs in Crores 2016
2015
Employee Benefits
53.35
52.18
Taxation less advance payment
15.17
19.97
142.00
142.00
Tax on Dividend [Net of Rs 13.42 Crores (Rs 13.42 Crores)]
21.24
21.24
Other Provisions (Refer Note 37)
42.10
33.79
273.86
269.18
12. Short Term Provisions
Proposed Dividend
189
Annual Report 2015-16
•
Connect with every sip
Notes to Consolidated Financial Statements 13. Fixed Assets
Rs in Crores Cost
Depreciation/Amortisation
As at Additions Deductions/ Translation March 31 Adjustment Exchange 2015 difference
As at March 31 2016
As at March 31 2015
Net Book Value
Depreciation/ Deductions/ Translation Amortisation Adjustment/ Exchange for the year Impairment difference
As at March 31 2016
As at March 31 2016
TANGIBLE Land (including Development)
60.09
0.15
(0.52)
0.30
60.02*
0.97
0.13
-
0.02
1.12
58.90
Previous Year
60.11
0.03
-
(0.05)
60.09
0.81
0.13
-
0.03
0.97
59.12
Tea / Coffee Estate Land / Fuel Area (including Development)
7.56
-
-
-
7.56
-
-
-
-
-
7.56
7.56
-
-
-
-
-
7.56
251.16
13.81
(2.19)
5.41
268.19
92.82
9.69
(8.74)
2.14
95.91
172.28
Previous Year Buildings
Previous Year
7.56 237.81
16.42
(0.10)
(2.97)
251.16
81.03
9.66
3.34
(1.21)
92.82
158.34
Bridges
0.16
-
-
-
0.16
0.02
-
-
-
0.02
0.14
Previous Year
0.16
-
-
-
0.16
0.02
-
-
-
0.02
0.14
1365.91
123.54
(48.93)
27.65
1468.17
938.89
69.29
(55.47)
23.80
976.51
491.66
Previous Year
1313.43
121.11
(16.14)
(52.49)
1365.91
896.15
62.99
24.01
(44.26)
938.89
427.02
Furniture and Fixtures
283.29
25.41
(16.48)
6.32
298.54
170.36
28.24
(13.84)
4.63
189.39
109.15
Plant and Machinery
Previous Year
254.63
46.77
(3.54)
(14.57)
283.29
152.65
27.38
1.01
(10.68)
170.36
112.93
Office Equipment
9.12
0.55
(1.17)
0.24
8.74
6.26
0.53
(0.48)
0.17
6.48
2.26
Previous Year
7.12
2.06
(0.13)
0.07
9.12
4.65
0.80
0.75
0.06
6.26
2.86
27.05
2.49
(5.97)
0.17
23.74
15.21
2.16
(6.62)
0.15
10.90
12.84
Motor Vehicles
Previous Year
26.21
5.98
(3.61)
(1.53)
27.05
14.75
2.96
(1.50)
(1.00)
15.21
11.84
2004.34
165.95
(75.26)
40.09
2135.12
1224.53
110.04
(85.15)
30.91
1280.33
854.79
1907.03
192.37
(23.52)
(71.54)
2004.34
1150.06
103.92
27.61
(57.06)
1224.53
779.81
Intangibles ^
312.14
-
-
19.07
331.21
102.23
13.56
43.53 &
Previous Year
305.24
-
-
6.90
312.14
87.08
12.89
-
2.26
102.23
209.91
Capitalised Software
70.91
6.36
-
1.90
79.17
31.71
11.05
-
0.23
42.99
36.18
Previous Year
39.96
29.80
(0.01)
1.16
70.91
23.27
11.12
-
(2.68)
31.71
39.20
Non Compete Fee
3.00
-
-
-
3.00
2.35
0.30
-
-
2.65
0.35
Previous Year
3.00
-
-
-
3.00
2.05
0.30
-
-
2.35
0.65
386.05
6.36
-
20.97
413.38
136.29
24.91
43.53
6.15
210.88
202.50
348.20
29.80
(0.01)
8.06
386.05
112.40
24.31
-
(0.42)
136.29
249.76
4026.97
-
-
140.02
4166.99
134.85
5.74
375.20
3791.79
Total Tangibles
Previous Year INTANGIBLE
Total Intangibles
Previous Year Goodwill on Consolidation
Previous Year Total
Previous Year
7.98 $
226.63 &
5.92
165.24 @
165.97
4243.07
77.38
(203.51)
(89.97)
4026.97
54.82
7.54
70.54
1.95
134.85
3892.12
6417.36
172.31
(75.26)
201.08
6715.49
1495.67
142.93
185.01
42.80
1866.41
4849.08
6498.30
299.55
(227.04)
(153.45)
6417.36
1317.28
135.77
98.15
(55.53)
1495.67
4921.69
Notes: 1.
(*) Includes leasehold land of Rs. 2.02 Crores (Rs. 2.02 Crores) belonging to two Indian subsidiaries and also includes a portion of land leased to an Associate.
2.
Cost of Buildings include Rs. 5.90 Crores (Rs. 5.90 Crores) represented by shares in Co-operative Housing Societies / a Company.
3.
($) Represents amortisation of certain intangible assets included as goodwill under India GAAP by an overseas subsidiary.
4.
(@) Unexpired period of amortisation for certain intangibles 184 months and 71 months.
5.
(^) Includes Trademark, Brands and Patents/Knowhow.
6.
(&) Adjustment in Goodwill and Intangibles includes impairment charge of Rs 226.64 Crores and Rs 43.53 Crores respectively (Refer Note 40).
7.
During the year, an Indian subsidiary of the Holding Company has revised its policy of providing depreciation on fixed assets with effect from April 1, 2015. Depreciation is now provided on a straight line basis for all assets as against the policy of providing on written down value basis for certain assets and straight line basis for others. As prescribed by Para 21 of ing Standard 6 - ‘Depreciation ing’, depreciation has been recomputed from the date the asset came into use. The adoption of new policy resulted in depreciation for the year 2015-16 being lower by Rs 2.61 Crores and the write back of depreciation amounting to Rs. 16.97 Crores relating to earlier years. In the previous year, the gross block and accumulated depreciation of assets under written down value method amounted to Rs 143.20 Crores and Rs 53.63 Crores respectively.
190
Corporate Overview 01-48
Financial Statements 125-220
Statutory Reports 49-124
Notes to Consolidated Financial Statements
Face Value of each
Nos
2016
Rs in Crores 2015
54.57 -
54.57 2.72
-
0.47
-
0.10
2.34
2.36
-
0.17
-
2.95
0.07 56.98
0.07 63.41
14. Non - Current Investments TRADE INVESTMENT (fully paid and valued at cost) (a) Quoted Equity Investments Tata Chemicals Ltd. (Refer Note (a)) The Indian Hotels Co Ltd. (Refer Note (e))
Rs. Re.
10 1
Tata Motors Ltd. (Refer Note (e))
Rs.
2
Tata Motors Ltd. - 'A' Ordinary Shares (Refer Note (e))
Rs.
2
Tata Investment Corporation Ltd. (Refer Note (e))
Rs.
10
Tata Steel Ltd. (Refer Note (e))
Rs.
10
Titan Industries Ltd. (Refer Note (e))
Re.
1
Joonktolle Tea & Industries Ltd.
Rs.
10
11345522 (1687742) (116665) (16665) 158469 (160000) (12021) (9248060) 12602
Rs.
10
61024400
61.02
61.02
LKR
10
12078406
14.57
14.57
Rs.
10
3976563
12.33
12.33
Rs.
10
11748148
11.75
11.75
99.67
99.67
9.75 0.95 0.05 115.82 29.29 0.01 0.01 0.07 0.00 0.00
9.75 0.95 0.05 115.82 28.50 0.01 0.01 0.07 -
155.96
155.16
(b) Unquoted Equity Investments Investment in Associates (Refer Note (f ) below) Amalgamated Plantations Pvt. Ltd. [Cumulative Group share of profits /(losses) - Rs 69.31 Crores (Rs 79.31 Crores)] Estate Management Services Pvt. Ltd. [Cumulative Group share of profits /(losses) - Rs 15.69 Crores (Rs 9.77 Crores)] Kanan Devan Hills Plantations Company Pvt. Ltd. [Cumulative Group share of profits /(losses) - (Rs 1.62 Crores) (Rs 4.05 Crores)] TRIL Constructions Limited [Cumulative Group share of profits /(losses) - (Rs 0.62 Crores) ((Rs 0.56 Crores))] Others Tata Sons Ltd. Tata Capital Ltd. Tata Services Ltd. Tata Industries Ltd. Taj Air Ltd. Chembra Peak Estates Ltd. Wartyhully Estates Ltd. Southern Scribe Instruments Pvt. Ltd. # Armstrong Power Private Limited # (Refer Note (d)) Armstrong Power Systems Private Limited # (Refer Note (d)) # relatings to power purchase agreement entered by an Indian subsidiary
Rs. Rs. Rs. Rs. Rs. Rs. Rs. Rs. Rs. Rs.
1000 10 1000 100 10 10 10 100 100 100
1755 613598 475 6519441 22200000 3481 24748 7280 375 460
191
Annual Report 2015-16
•
Connect with every sip
Notes to Consolidated Financial Statements
Face Value of each (c) Unquoted Preference Shares Investment in Associates Amalgamated Plantations Pvt. Ltd. 0.01% Non Cum Redeemable Preference Shares (Redeemable with special redemption within 7 - 9 years from issue date and extension is being considered in line with the agreements) TRIL Constructions Limited 0.001% Non Cumulative Non redeemable, mandatorily and fully convertible Preference Shares (Redeemable within 6 years from issue date ) (d) Quoted Debentures The Indian Hotels Co Ltd. Compulsory Convertible Debenture
Nos
2016
Rs in Crores 2015
Rs.
10
67000000
67.00
67.00
Rs.
10
66751852
66.75
66.75
133.75
133.75
-
2.09
-
2.09
Rs.
55
(379741)
OTHERS INVESTMENT (fully paid and valued at cost) (a) Quoted Equity Investments SBI Home Finance Ltd. (Refer Note (c)) Industrial Development Bank of India
Rs. Rs.
10 10
100000 16160
0.13 0.13
0.13 0.13
Rs. Rs. Rs. Rs.
100 10 10 10
2092 20000 200000 350
0.02 0.20 -
0.02 0.20 -
(b) Unquoted Equity Investments The Annamallais Ropeways Company Ltd. - Ordinary Shares (Refer Note (c)) ABC Tea Workers Welfare Services - Ordinary Shares Assam Hospitals Ltd. The Valparai Co-operative Wholesale Stores Ltd. - Ordinary Shares (Refer Note (c)) Suryakiran Apartment Services Pvt. Ltd. (Refer Note (d)) Jalpaiguri Club Ltd.- Ordinary Shares (Cost Re 1) GNRC Ltd. IFCI Venture Capital Funds Ltd. Ritspin Synthetics Ltd. (Refer Note (c)) Coorg Orange Growers Co-operative Society Ltd. Tata Coffee Co-operative Stores Limited Coorg Cardamom Co-operative Marketing Society Ltd. TEASERVE (Refer Note (d)) (The Tamil Nadu Tea Manufacturers' Service Industrial Co-op Society Ltd.) Woodlands Hospital & Medical Res. Centre Ltd. - Equity Shares
Rs. Rs. Rs. Rs. Rs. Rs. Rs. Rs. Rs.
10 10 10 10 10 100 5 100 5000
2146 60 50000 250000 200000 4 20 1 1
0.00 0.05 0.25 0.00
0.00 0.05 0.25 0.00
Rs.
10
12280
0.00 0.53
0.00 0.53
(c) Unquoted Preference Shares Thakurbari Club Ltd. (Cost Re 1)
Rs.
100
26
-
-
192
Corporate Overview 01-48
Financial Statements 125-220
Statutory Reports 49-124
Notes to Consolidated Financial Statements
Face Value of each
Nos
(d) Unquoted Government Securities: W.B. Estates Acquisition Compensation Bond (Refer Note (d)) (e) Unquoted Debentures The Bengal Chamber of Commerce & Industry - 6 1/2% Debentures (Refer Note (d)) Shillong Club Ltd. - 5% Debentures - (Cost Rs 2)
0.00 0.00
0.00 0.00
1000
7
0.00
0.00
Rs.
100
31
0.00
0.00
70.80 70.80 517.81 82.76
70.45 70.45 525.19 92.57
600.57
617.76
57.11 472.66 70.80 600.57 431.22
65.63 481.68 70.45 617.76 903.97
Total
Total of Investments Quoted Unquoted Investment Properties Aggregate Amount Market value of quoted investments
Rs in Crores 2015
Rs.
INVESTMENT PROPERTIES Commercial Property Net appreciation in investments in associates under equity method (Refer Note (f ))
2016
Notes : (a) (b) (c) (d) (e) (f )
3723648 shares of Tata Chemicals Ltd. is pledged against outstanding 3% Non Convertible privately placed Debentures. Cost of investments in Amalgamated Plantations Pvt. Ltd. and Kanan Devan Hills Plantations Co. Pvt. Ltd. includes capital reserve of Rs 15.60 Crores and Rs 11.80 Crores respectively. Fully provided (Original Cost Rs 0.32 Crores). Investment costs are below Rs 0.01 Crores. During the year, the Holding Company has sold some of its investments and the resultant profit has been ed under exceptional item (Refer Note 32). Includes the following adjustments on of Associate Companies:
Pre-acquisition share of profit / (loss) Post acquisition profit Current year profit / (loss) Dividend received
2016 (1.52) 122.72 (1.41) (37.03) 82.76
Rs in Crores 2015 (1.52) 133.60 (10.88) (28.63) 92.57
193
Annual Report 2015-16
•
Connect with every sip
Notes to Consolidated Financial Statements
Rs in Crores 2016
2015
15. Deferred Tax Assets (net) Deferred Tax Asset
Provision for Doubtful Debts/Advances
Employee Benefits
on redemption of Debentures
3.12
2.51
39.20
35.28
4.44
12.81
11.42
18.32
58.18
68.92
Depreciation
15.90
14.67
15.90
14.67
Net Deferred Tax Assets
42.28
54.25
Others Deferred Tax Liability
Rs in Crores 2016
2015
57.13
102.11
2.12
2.13
17.96
12.39
16. Long Term Loans and Advances (unsecured and considered good unless otherwise stated) Inter Corporate Loans - Secured Capital Advances Deposits Security Deposit
Considered Good
Considered Doubtful
Less: Provision for Doubtful Deposits
37.18
37.60
0.28
0.28
37.46
37.88
(0.28)
(0.28) 37.18
37.60
Other Advances
Considered Good
Considered Doubtful
Less: Provision for Doubtful Advances
15.97
15.23
0.07
0.12
16.04
15.35
(0.07)
(0.12) 15.97
15.23
Advance Tax [net of provisions of Rs 1406.99 Crores (Rs 1315.96 Crores)]
31.22
19.86
MAT Credit Entitlement
39.00
-
Advance for purchase of shares in a subsidiary
39.82
-
240.40
189.32
194
Corporate Overview 01-48
Financial Statements 125-220
Statutory Reports 49-124
Notes to Consolidated Financial Statements
Rs in Crores 2016
2015
70.50
70.50
70.50
70.50
17. Other Non current Assets Property rights pending development
Rs in Crores Face Value of each
Nos
2016
2015
-
18. Current Investments (At lower of cost and fair value) Unquoted Mutual Fund Tata Liquid Fund
Rs. 1000
17590.5
4.90
JM Financial Mutual Fund
Rs. 10
900768
3.69
-
ICICI Prudential Liquid - Units of Regular Plan - Growth
Rs. 100
-
-
1.42
-
1.89
-
0.06
-
0.89
Total Current Investments
8.59
4.26
Net fair value of investment in Mutual Fund
8.63
4.43
(72313.5) Kotak Floater Short Term - Units of Regular Plan - Growth
Rs. 1000
(8657.5)
Sundaram Money Fund - Units of Regular Plan - Growth
Rs. 10
HSBC Ultra Short Term Fund - Weekly Dividend
Rs. 10
(21554.5) (887448)
Rs in Crores 2016
2015
19. Inventories (At lower of cost and net realisable value) 84.03
89.01
Raw Material*
982.42
866.64
Finished Goods**
647.20
656.73
6.60
4.37
Stores, Spare Parts and Packing Materials
Stock in Trade Work in Progress
7.86
8.55
1728.11
1625.30
*includes intransit of Rs. 13.79 Crores (Rs. 19.41 Crores) **includes intransit of Rs. 6.54 Crores (Rs. 5.61 Crores)
195
Annual Report 2015-16
•
Connect with every sip
Notes to Consolidated Financial Statements
Rs in Crores 2016
2015
20. Trade Receivables Receivables outstanding for a period exceeding six months from due date
Considered Good
Doubtful
Less : Provision for Doubtful Debts
2.51
1.69
6.98
8.11
9.49
9.80
(6.98)
(8.11) 2.51
1.69
Other Receivables
Considered Good*
Doubtful
Less : Provision for Doubtful Debts
629.57
614.40
0.85
0.62
630.42
615.02
(0.85)
(0.62) 629.57
614.40
632.08
616.09
*Other Receivable includes secured receivable of Rs. 20.79 Crores (Rs. 20.04 Crores) Rs in Crores 2016
2015
21. Cash and Bank Balances Cash and Cash Equivalents
Cash/Cheques in hand
Others - Investment in Mutual Fund
0.62
0.66
173.33
10.83
Balances with Bank Current *
Deposit ^
81.24
73.63
275.58
451.41 530.77
536.53
Other Bank Balances
Unclaimed Dividend
8.16
7.71 8.16
7.71
538.93
544.24
* Includes remittance in transit - Rs 14.78 Crores (Nil). ^ The cash held in bank deposits includes Nil (Rs 0.62 Crores) of restricted cash which may only be used to service the external debt.
196
Corporate Overview 01-48
Statutory Reports 49-124
Financial Statements 125-220
Notes to Consolidated Financial Statements
Rs in Crores 2016
2015
601.69
579.75
22. Short Term Loans and Advances (unsecured and considered good unless otherwise stated) Inter Corporate Loans (including secured loan amounting to Rs. 170.37 Crores (Rs. 165.24 Crores)) Deposits
Considered Good
5.63
5.00
Considered Doubtful
0.38
0.38
6.01
5.38
(0.38)
(0.38)
Less : Provision for Doubtful Deposits
5.63
5.00
Other Advances
Considered Good
Considered Doubtful
Less : Provision for Doubtful Advances
152.41
165.05
2.67
2.67
155.08
167.72
(2.67)
(2.67) 152.41
165.05
Prepaid Expenses
43.16
32.09
Advance Tax
16.28
9.70
819.17
791.59 Rs in Crores 2016
2015
23. Other Current Assets Interest Accrued
14.10
3.62
Export Incentive receivable
18.42
14.79
Others receivables
11.62
11.25
44.14
29.66
197
Annual Report 2015-16
•
Connect with every sip
Notes to Consolidated Financial Statements
Rs in Crores 2016
2015
Sale of Products
7979.23
7827.17
Sale of Services
9.66
6.05
24. Revenue from Operations
Other Operating Revenues
Miscellaneous Receipts
32.47
34.07
Liabilities no longer required written back
20.69
50.43
Provision for debts and advances written back
0.07
0.04
Royalty Income
48.08
49.21
Export Incentive
27.50
26.97
Less: Excise Duty
128.81
160.72
8117.70
7993.94
(7.19)
(0.55)
8110.51
7993.39 Rs in Crores
2016
2015
43.52
52.02
25. Other Income Interest Income - on advances and deposits Dividend income
Long-term Investments
Current Investments
21.13
15.07
1.30
0.62 22.43
15.69
Profit on sale of Current Investments (net)
1.32
0.75
Profit on sale of Fixed Asset (net)
2.18
-
Rent Income
0.93
1.02
Other non operating income
0.22
0.50
70.60
69.98 Rs in Crores
2016
2015
26. Cost of Materials Consumed Raw Materials Consumed 2459.51
2459.48
Coffee
630.83
668.69
Others
34.01
Tea
24.41 3124.35
Consumption of Packing Materials
198
3152.58
480.65
472.54
3605.00
3625.12
Corporate Overview 01-48
Statutory Reports 49-124
Financial Statements 125-220
Notes to Consolidated Financial Statements
Rs in Crores 2016
2015
171.98
156.50
Coffee
89.59
48.20
Others
68.97
58.77
330.54
263.47
27. Purchase of Stock in Trade Tea
Rs in Crores 2016
2015
28. Changes in Inventories of Finished Goods/Work in progress/ Stock in Trade Stock as at 1st April 656.73
606.05
Stock-in-Trade
4.37
3.58
Work-in-Progress
8.55
Finished Goods
8.77 669.65
618.40
Stock as at 31st March 647.20
656.73
Stock-in-Trade
6.60
4.37
Work-in-Progress
7.86
8.55
Finished Goods
Less: Partial diminution in the value of Inventory ed in Exceptional Items (Refer Note 32)
29. Employee Benefits Expense Salaries, Wages and Bonus (Refer Note 39) Contribution to Provident Fund and other Funds Workmen and Staff Welfare Expenses
30. Finance Costs Interest Expense Other Borrowing Cost Exchange loss (net)
661.66
669.65
7.99
(51.25)
18.12
-
(10.13)
(51.25)
2016
Rs in Crores 2015
800.78 59.94 41.29 902.01
775.89 53.86 27.92 857.67
2016
Rs in Crores 2015
64.21 0.96 3.60 68.77
77.90 0.92 3.04 81.86 199
Annual Report 2015-16
•
Connect with every sip
Notes to Consolidated Financial Statements
31. Other Expenses Manufacturing and Contract Packing Expenses Consumption of Stores and Spare Parts Power and Fuel Repairs to Plant and Machinery Repairs to Buildings General Repairs Rent Rates and Taxes ment and Sale Charges Commission on Sales Freight Insurance Legal and Professional Expenses Miscellaneous Expenses* (Refer Note 39) Provision for Doubtful Debts and Advances Debts and Advances written off (net) Loss on sale of fixed assets
2016
Rs in Crores 2015
130.25 50.14 81.43 27.20 17.02 22.82 108.97 20.51 1368.77 116.27 187.18 28.10 126.88 314.91 2.39 5.59 2608.43
111.39 47.52 84.78 23.03 15.21 21.52 96.94 18.78 1325.57 137.63 199.94 24.82 115.67 298.96 0.34 0.42 1.01 2523.53
*Includes Exchange gain - Rs. 6.36 Crores (Rs. 9.77 Crores) Rs in Crores 2015
2016 32. Exceptional Items Income Profit on sale of Non-Core Investments Write back on Change in ing Policy [Refer Note 13] Exchange Gain
327.79 16.97 -
0.87 344.76
Expenditure Impairment of Intangible / Other Assets* Re-organisation/Business Restructure costs Disposal of an Associate Acquisition related Expenditure Provision for retrospective amendment of legislation relating to employee benefits Levy relating to past demerged business Others **
(288.28) (18.48) (13.07) (5.13)
0.87 (95.38) (17.52) (17.96) -
(3.00) (4.92)
(332.88)
(130.86)
11.88
(129.99)
* includes impairment of intangible assets (Refer Note 40) and partial diminution in the value of inventory - Rs 18.12 Crores (Nil). ** includes settlement of legal claims - Rs 2.51 Crores (Nil).
200
Corporate Overview 01-48
Statutory Reports 49-124
Financial Statements 125-220
Notes to Consolidated Financial Statements
33. Estimated amount of contracts remaining to be executed on capital and not provided for as at March 31, 2016 aggregated Rs 12.45 Crores (Rs 10.83 Crores).
34. Contingent Liabilities not provided for in respect of :
a)
Claims under adjudication not acknowledged as debts:
Rs in Crores Particulars
2016
2015
i
Taxes, Statutory Duties/ Levies etc
53.33
35.88
ii
Commercial and other Claims
9.27
11.41
b)
Labour disputes under adjudication relating to some staff – amount not ascertainable for holding company and Rs 0.90 Crores (Rs 0.80 Crores) for an Indian subsidiary.
c)
In the case of overseas subsidiaries there are contingent liabilities in respect of outstanding letters of credit and financing arrangements of t ventures. All of these arrangements have been undertaken in the normal course of trade and are centrally managed by the central treasury team of the overseas subsidiary. Because the value of many of these liabilities is dependent on future events, the directors believe that it is not practically possible to provide an estimate of the Group’s potential liability under such arrangements.
d)
Bank and other guarantees - Rs 9.73 Crores (Rs 9.23 Crores).
35. Litigations
i)
Stamp duty claim yet to be reassessed – amount not ascertainable
ii)
Product / commercial liability claims not established – amounts not ascertainable
iii)
Holding Company’s overseas subsidiary in US alongwith several other coffee companies that roast, package, market and/ or sell coffee in the State of California are defendants in a public interest litigation filed by an organisation named Council of Education and Research on Toxics (CERT). The litigation contends that since coffee contains the chemical acrylamide, warning have to be included for coffee sold in that state pursuant to California state law. Acrylamide is not added to coffee but forms in trace amounts as part of a chemical reaction that occurs in coffee beans when it is roasted. The subsidiary is part of a t Defense Group that is arguing the case on behalf of several leading coffee companies as defendants. The outcome and potential liability, if any, to the subsidiary on of their sales in the state of California is not determinable at present.
36. Research & Development Expenditure: Rs in Crores Particulars
2016
2015
Capital
0.71
0.34
Revenue
9.59
8.59
10.30
8.93
Total
201
Annual Report 2015-16
•
Connect with every sip
Notes to Consolidated Financial Statements
37. Details of provision: Rs in Crores Particulars
Reorganisation Cost
#
Others
&
2016
2015
2016
2015
20.69
27.90
13.09
6.92
9.96
11.47
6.03
6.94
Amount paid / adjusted during the year
(7.67)
(18.68)
-
(0.77)
Closing Balance
22.98
20.69
19.12
13.09
Opening Balance Provision made during the year
#
relates to restructure costs and is expected to be paid in near future .
&
relates to provision for trade obligations.
38. The current tax charge is net of credit pertaining to earlier year Rs 20.11 Crores (Rs 53.35 Crores). Prior year included onetime credit arising on amalgamation of Mount Everest Mineral Water Limited with the Holding Company and credit relating to debenture redemption charged to Securities in an earlier year.
39. As per Section 135 of the Companies Act 2013, the amount contributed for Corporate Social Responsibility causes are as follows: Rs in Crores Particulars Employee Benefit Expenses incurred on specific CSR activities
2016
2015
1.51
0.95
Others Expenses - Miscellaneous
6.50
5.50
Total
8.01
6.45
40. During the year, the Group recognized a non-cash impairment loss mainly on goodwill relating to its branded businesses in Eastern Europe and US. While the Company is actively pursuing various growth opportunities, the ing impairment has been recognised due to underperformances as compared to plans mainly arising out of factors like macro-economic instability in Russia and category decline in every day black tea / competitive intensity in other markets. Accordingly, impairment of Rs 157.03 Crores has been recognized in Eastern European markets [Russia (coffee segment), Poland (tea segment) and Czech (tea segment)] wherein the pre-tax discount rate is within the range of 7.1% to 14.9% and Rs 106.13 Crores in the US tea business primarily within the specialty tea segment after applying a pre-tax discount rate of 8.0%. Additionally, an impairment loss of Rs 7.00 Crores has been recognised on Patent/Knowhow (water segment) which arose on of revision in the business plans with lower than expected economic benefits over its estimated useful life. A pre-tax discounting rate of 22.3 % was used for evaluation of value in use.
The impact of impairment has been ed under exceptional items and is disclosed as unallocated items in the segment report.
202
Corporate Overview 01-48
Statutory Reports 49-124
Financial Statements 125-220
Notes to Consolidated Financial Statements
41. Leases Operating Lease
Group’s leasing arrangements are for premises (residential, office, factory, godown and Stores), equipments and vehicles, these ranges between 5 months to 15 years and are usually renewable on mutually agreed .
Disclosure in respect of operating leases: Rs in Crores Particulars
2016
2015
Minimum lease payments under Non-cancellable operating lease 50.70
52.26
128.53
124.27
67.45
24.11
Total
246.68
200.64
Lease payments recognised in the Statement of Profit and Loss
121.39
104.26
Within one year
Later than one year and not later than five years
Later than five years
42. Earning Per Share Rs in Crores Particulars
2016
2015
325.91
247.82
631129729
618398570
-
12731159
631129729
631129729
Basic
5.16
3.93
Diluted
5.16
3.93
Group Net Profit (Rs in Crores) Numbers of Equity Shares Outstanding Add: Equity shares to be issued consequent to amalgamation lying in share suspense Total number of Shares (No.) Earnings Per Share (Rs.)
203
Annual Report 2015-16
•
Connect with every sip
Notes to Consolidated Financial Statements
43. The proportionate share of the assets, liabilities, income and expenditure of the t venture of Holding Company and its subsidiary companies (refer note 2(b) above) are given below: JV’s Balance Sheet as at March 31, 2016 Particulars
Rs in Crores 2016
2015
326.16
275.38
Reserves and Surplus
(165.92)
(133.09)
Shareholders Funds
160.24
142.29
-
(0.73)
Equity and Liabilities Share Capital
Non Current Liabilities: Deferred Tax (net)
-
0.05
Long Term Provisions
1.18
1.03
Total Non Current Liabilities
1.18
0.35
Short Term Borrowings
24.05
34.66
Trade Payables
55.40
54.72
9.94
11.34
Other Long Term Liabilities
Current Liabilities:
Other Current Liabilities
1.19
1.56
90.58
102.28
252.00
244.92
Tangible Assets
75.38
77.83
Intangible assets
4.69
4.38
Capital work in progress
9.98
9.06
Short Term Provisions Total Current Liabilities Total Assets Non-Current Assets Fixed Assets
-
0.01
14.65
12.92
104.70
104.20
8.59
3.37
Inventories
91.16
88.73
Trade Receivables
18.65
18.84
Cash and Bank Balance
10.79
17.93
Short Term Loans and Advances
18.05
11.78
0.06
0.07
Total Current Assets
147.30
140.72
Total
252.00
244.92
Intangible assets under development Long Term Loans and Advances Total Non Current Assets Current Assets Current investments
Other Current Assets
204
Corporate Overview 01-48
Statutory Reports 49-124
Financial Statements 125-220
Notes to Consolidated Financial Statements
JV’s Statement of Profit and Loss for the year ended March 31, 2016 Particulars
Rs in Crores 2016
2015
618.98
560.36
2.57
1.63
621.55
561.99
388.90
366.58
54.87
49.57
1.60
2.53
16.24
11.49
Other Expenses
174.71
161.49
Total Expenses
636.32
591.66
Profit before Exceptional Items and Taxes
(14.77)
(29.67)
-
-
(14.77)
(29.67)
0.88
0.33
(15.65)
(30.00)
Income Revenue from Operations Other Income Total Revenue Expenses Material Cost Employee Benefits Expense Finance Costs Depreciaton and Amortisation Expense
Exceptional Items (net) Profit before tax Tax Expenses Profit after Taxation
205
Annual Report 2015-16
•
Connect with every sip
Notes to Consolidated Financial Statements
44 a.
Consolidated Related Party Disclosure as per ing Standard - 18 Particulars of transactions during the year ended March 31, 2016 Rs in Crores Nature of Transactions
t Ventures Associates
Sale of Goods and Services Other Operating Income Purchase of Goods and Services
Promoter
Key Management Personnel
19.53
0.59
20.12
(23.24)
(0.04)
(23.28)
0.15
-
0.15
(0.16)
(1.09)
(1.25)
74.30
298.43
372.73
(72.44)
(273.97)
(346.41)
Rent Paid
1.84
-
1.84
(1.34)
(0.32)
(1.66) 3.79
3.79
Fees paid for Product Development
(6.91)
(6.91) Other Expenses (Net)
3.25
12.52
15.77
(2.83)
(12.80)
(15.63)
-
Deposits Redeemed
(1.00)
(1.00) Directors Remuneration * Dividend Paid Sale of Investment Reimbursement of Expenditure/(Income) Dividend/Interest Received Balances Outstanding
Debit Credit
206
Total
7.01
7.01
(5.74)
(5.74)
32.14
32.14
(32.14)
(32.14)
312.31
312.31
-
-
(0.75)
3.91
0.41
3.57
((0.62))
(1.17)
((0.01))
(0.54)
-
10.44
4.21
14.65
-
(12.02)
(1.40)
(13.42)
5.05
25.18
-
30.23
(4.28)
(30.08)
-
(34.36)
1.88
6.75
11.70
20.33
(1.57)
(2.14)
(12.02)
(15.73)
* Provision for employee benefits, which are based on actuarial valuation done on an overall basis, is excluded. The above does not include share of recurring/special benefits payables to former Directors.
Corporate Overview 01-48
Statutory Reports 49-124
Financial Statements 125-220
Notes to Consolidated Financial Statements Related Parties Promoter
Key Management Personnel
Tata Sons Ltd.
Mr. Ajoy Misra - CEO & Managing Director Mr. L Krishna Kumar - Executive Director & Group CFO
Associates
t Ventures
Estate Management Services Pvt. Ltd.
NourishCo Beverages Ltd.
Amalgamated Plantations Pvt. Ltd.
Tata Starbucks Pvt. Ltd.
Kanan Devan Hills Plantations Co. Pvt. Ltd. TRIL Constructions Ltd. t Ventures of Subsidiary
Associate of Subsidiary
Tetley ACI (Bangladesh) Ltd.
Bjets Pte. Ltd. Singapore
Empirical Group LLC, USA Southern Tea LLC, USA Tetley Clover Pvt. Ltd., Pakistan
207
Annual Report 2015-16
•
Connect with every sip
Notes to Consolidated Financial Statements
b) Disclosures in respect of transactions in excess of 10% of the total related party transactions of the same type : Rs. in Crores 1
Sale of Goods and Services
Southern Tea LLC. NourishCo Beverages Ltd. Tetley Clover Pvt. Ltd. Tata Starbucks Pvt. Ltd.
2
Other Operating Income
3
Purchase of Goods & Services
Kanan Devan Hills Plantations Co. Pvt. Ltd.
Rent Paid
2.65
10.18
9.81
-
8.60
3.58
-
-
1.09
0.15
0.16 180.29
Kanan Devan Hills Plantations Co. Pvt. Ltd.
91.54
93.68
Southern Tea LLC.
74.03
72.30
Amalgamated Plantations Pvt. Ltd.
-
0.32
Amalgamated Plantations Pvt. Ltd.
1.35
0.85
Kanan Devan Hills Plantations Co. Pvt. Ltd.
0.49
0.49
Tata Sons Ltd.
5
Fees paid for Product Development
NourishCo Beverages Ltd.
6
Other Expenses (Net)
Tata Sons Ltd. Amalgamated Plantations Pvt. Ltd.
208
2015
4.30
206.89
NourishCo Beverages Ltd.
4
2016
3.79
6.91
12.62
12.80
3.25
2.83
7
Dividend Paid
Tata Sons Ltd.
32.14
32.14
8
Sale of Investment
Tata Sons Ltd.
312.31
-
9
Reimbursement of Expenses/ (Income)
Amalgamated Plantations Pvt. Ltd.
3.95
1.14
NourishCo Beverages Ltd.
(0.72)
(0.61)
Tata Starbucks Pvt. Ltd.
(0.04)
(0.01)
Kanan Devan Hills Plantations Co. Pvt. Ltd.
(0.04)
0.03
Tata Sons Ltd.
0.41
(0.01)
10
Deposits Reedeemed
Tata Sons Ltd.
-
1.00
11
Dividend and Interest Received
Amalgamated Plantations Pvt. Ltd.
3.67
3.42
Estate Management Services Pvt. Ltd.
4.34
4.46
Kanan Devan Hills Plantations Co. Pvt. Ltd.
2.44
4.14
Tata Sons Ltd.
4.21
1.40
Corporate Overview 01-48
Financial Statements 125-220
Statutory Reports 49-124
Notes to Consolidated Financial Statements
45. Disclosure requirement for Derivatives Instruments A. The Group uses forward exchange contracts to hedge its exposures in foreign currency. All the derivative contracts entered by the Company were for hedging purposes and not for any speculative purpose.
a)
The outstanding forward exchange contracts of foreign currency are: 2016 Type of Contract
Currency Pair
No of Notional Contract Amount in FCY Mn
2015 No of Notional Contract Amount in FCY Mn
Equivalent Amount in Rs Crores *
Equivalent Amount in Rs Crores *
Forward Contracts Outstanding i) Exports
ii) Payables
GBP / EUR
1
0.74
5.58
2
1.10
7.39
GBP / CAD
16
25.27
129.45
-
-
-
USD / INR
188
28.95
191.79
184
32.30
201.86
AUD / INR
35
6.05
30.83
62
9.20
43.72
EUR / INR
1
0.10
0.64 223.11
GBP / USD
12
20.99
139.06
25
35.70
USD / RUB
34
5.30
35.11
23
4.55
28.44
iii)
Loans given
GBP / USD
7
80.93
536.15
8
93.83
586.37
iv)
Loan to subsidiary
GBP / USD
5
60.67
401.95
6
55.57
347.31
v)
Loan from subsidiary USD / RUB
1
4.35
28.82
vi) Receivables from Subsidiary
GBP / PLN
1
16.00
28.32
1
12.80
21.03
GBP / CZK
1
64.89
18.09
2
160.11
39.11
GBP / AUD
1
13.30
67.78
2
6.10
28.99
GBP / CAD
3
3.73
19.13
1
1.50
7.35
GBP / USD
1
9.63
63.83
1
9.40
58.75
GBP / RUB
1
94.42
9.34
-
-
* converted at the year exchange rates
b)
The foreign currency exposures not hedged as at the year end are as under : 2016 Currency Pair a)
Amounts receivable in foreign currency
Foreign Currency in Mn
2015
Equivalent Foreign Equivalent Amount in Currency Amount in in Mn Rs Crores * Rs Crores *
USD/INR
1.76
11.67
9.57
59.81
USD/RUB
0.07
0.48
2.21
13.80
EUR/INR
0.52
3.93
0.11
0.71
b)
Amounts payable in foreign currency
USD/INR
1.63
10.81
1.88
11.74
c)
Outstanding Loan in Foreign Currency ^
USD/INR
3.13
20.71
14.60
91.22
* converted at the year exchange rates ^ This includes Long Term Borrowing of USD 3.13 mn (PY - USD 5.63 mn)
209
Annual Report 2015-16
•
Connect with every sip
Notes to Consolidated Financial Statements B.
Details of Interest rate swap which the Group has entered into for hedging its interest rate exposure on borrowing: 2016 2015 Details of Borrowings Foreign Equivalent Foreign Equivalent Currency Currency Amount in Currency Amount in in Mn Rs Crores * in Mn Rs Crores * Senior Debts / External Commercial Borrowings ** USD 48.13 318.88 53.13 332.01 * converted at the year exchange rates ** to the extent of swap entered
C.
Outstanding position of various commodity derivatives financial instruments. Commodity
Coffee a) b) Coffee * converted at the year exchange rates
Futures & Options Futures Options
Notional Value in USD Mn 18.19 4.46
2016 2015 Equivalent Notional Equivalent Amount in Value in Amount in Rs Crores * USD Mn Rs Crores * 120.55 9.06 56.64 29.55 14.44 90.26
46. Consolidated Segment Reporting
a) By Business Segments: Rs. in Crores Particulars
Sales Revenue from External Customers Other Operating Revenue Total Segment Revenue Add : Other Income Total Income Segment result Add : Other Income Add : Unallocable (expenditure) net of income Less: Finance Cost
210
Tea
Coffee and Other Produce
Others
Unallocated
Total
7981.70
5870.79
2002.03
108.88
(5824.92)
(1909.78)
(97.97)
-
(7832.67)
60.64
66.22
1.95
-
128.81
(55.32)
(100.55)
(4.85)
-
(160.72)
5931.43
2068.25
110.83
-
8110.51
(5880.24)
(2010.33)
(102.82)
-
(7993.39)
-
-
-
70.60
70.60
(69.98)
(69.98)
5931.43
2068.25
110.83
70.60
8181.11
(5880.24)
(2010.33)
(102.82)
(69.98)
(8063.37)
580.05
214.40
(41.42)
-
753.03
(614.97)
(264.38)
((44.26))
-
(835.09)
-
-
-
70.60
70.60
-
-
-
(69.98)
(69.98)
-
-
-
(221.30)
(221.30)
-
-
-
((193.34))
((193.34))
-
-
-
(68.77)
(68.77)
((81.86))
((81.86))
Corporate Overview 01-48
Financial Statements 125-220
Statutory Reports 49-124
Notes to Consolidated Financial Statements
Rs. in Crores Particulars
Profit before Exceptional Items and Taxes Exceptional Income / (Expenditure) Profit before Tax Provision for Taxation Profit after Taxation before Share of Results of Associates and Minority Interest Share of Results of Associates Profit after Taxation before Minority Interest Segment Assets Investments Unallocated Assets Total Assets Segment Liabilities Unallocated liabilities Total Liabilities Capital Expenditure Depreciation & Amortisation Non Cash Expenditure other than depreciation and amortisation
Tea
Coffee and Other Produce
Others
Unallocated
Total
580.05
214.40
(41.42)
(219.47)
533.56
(614.97)
(264.38)
((44.26))
((205.22))
(629.87)
-
-
-
11.88
11.88
((129.99))
((129.99))
580.05
214.40
(41.42)
(207.59)
545.44
(614.97)
(264.38)
((44.26))
((335.21))
(499.88)
-
-
-
(210.40)
(210.40)
((215.52))
((215.52))
580.05
214.40
(41.42)
(417.99)
335.04
(614.97)
(264.38)
((44.26))
((550.73))
(284.36)
-
-
-
(1.41)
(1.41)
((10.88))
((10.88))
580.05
214.40
(41.42)
(419.40)
333.63
(614.97)
(264.38)
((44.26))
((561.61))
(273.48)
4864.74
2748.18
59.29
-
7672.21
(4766.75)
(2694.44)
(72.50)
-
(7533.69)
-
-
-
609.16
609.16
(622.02)
(622.02)
1336.37
1336.37
-
-
-
(1356.12)
(1356.12)
4864.74
2748.18
59.29
1945.53
9617.74
(4766.75)
(2694.44)
(72.50)
(1978.14)
(9511.83)
881.98
301.49
27.18
-
1210.65
(802.31)
(325.77)
(17.85)
-
(1145.93)
-
-
-
1807.48
1807.48
(1996.90)
(1996.90)
881.98
301.49
27.18
1807.48
3018.13
(802.31)
(325.77)
(17.85)
(1996.90)
(3142.83)
85.82
80.80
0.09
-
166.71
(111.03)
(170.74)
(4.81)
-
(286.58)
64.39
76.37
2.24
-
143.00
(66.74)
(64.77)
(1.60)
-
(133.11)
3.13
5.83
0.12
-
9.08
(0.65)
(1.04)
(0.00)
-
(1.69)
211
Annual Report 2015-16
•
Connect with every sip
Notes to Consolidated Financial Statements
b) By Geographical Segments: Rs in Crores India Sales Revenue Segment Assets Purchase of Fixed Assets
UK
USA & Canada
Rest of the World
Total
3137.12
1386.34
2035.14
1423.10
7981.70
(2959.66)
(1443.55)
(1929.84)
(1499.62)
(7832.67)
2193.28
2753.09
2381.97
343.87
7672.21
(1998.14)
(2858.13)
(2269.51)
(407.91)
(7533.69)
77.21
28.60
50.59
10.31
166.71
(104.09)
(95.59)
(51.37)
(35.52)
(286.58)
Notes: a. Business Segments: The internal business segmentation and the activities encomed therein are as follows: Tea : Cultivation, manufacture, blending and sale of tea in packet, bulk or value added forms Coffee and Other Produce : Cultivation of coffee and related plantation crops and sale of coffee in various value added forms Others : Sale of water products and other businesses b. Geographical segments : Sales Revenue is on the basis of the geographical location of the customers. Carrying value of segment assets is based on geographical location of assets c. The segment wise revenue, results, assets and liabilities figures relate to the respective amounts directly identifiable to each of the segments. Unallocable expenditures includes expenses incurred on common services at the corporate level and exceptional items. Unallocable Income includes income from investments and exceptional items. d. Pricing of inter segment transfers are based on benchmark market prices.
47. Additional information, as required under Schedule III of the Companies Act, 2013, of entities consolidated as Subsidiary/ Associates/t Ventures (Refer Note 2b(i)). Name of the Entity
Net Assets
Share in Profit or Loss
As a % of Consolidated Net Assets
Amount (Rs in Crores)
As a % of Consolidated Profit or Loss
Amount (Rs in Crores)
50.64%
2895.90
172.95%
563.67
13.25%
757.79
31.45%
102.50
0.00%
0.00
0.00%
(0.00)
10.14%
579.83
24.69%
80.46
Parent Tata Global Beverages Limited Subsidiaries Indian 1
Tata Coffee Ltd.
2
Tata Tea Holdings Pvt. Ltd.
1
Consolidated Coffee Inc. (Consolidated Financials)
2
Tata Tea Extractions Inc.
5.28%
301.99
4.55%
14.82
3
Zhejiang Tata Tea Extraction Company Ltd.
-0.42%
(24.16)
-7.54%
(24.58)
4
Tata Global Beverages Capital Ltd.
15.18%
868.30
4.24%
13.82
Foreign
212
Corporate Overview 01-48
Statutory Reports 49-124
Financial Statements 125-220
Notes to Consolidated Financial Statements
Name of the Entity
Net Assets
Share in Profit or Loss
As a % of Consolidated Net Assets
Amount (Rs in Crores)
As a % of Consolidated Profit or Loss
Amount (Rs in Crores)
10.98%
35.77
5
Tata Global Beverages Group Ltd.
38.87%
2223.23
6
Tata Global Beverages Holdings Ltd.
29.13%
1666.18
9.43%
30.74
7
Tata Global Beverages Services Ltd.
57.50%
3288.22
-8.61%
(28.06)
8
Tata Global Beverages GB Ltd.
35.01%
2002.28
25.81%
84.13
9
Tata Global Beverages Overseas Holdings Ltd.
-1.21%
(68.99)
-2.05%
(6.67)
10
Tata Global Beverages Overseas Ltd.
0.01%
0.57
-0.01%
(0.02)
11
Lyons Tetley Ltd.
-
-
-
-
12
Drassington Ltd.
-
-
0.00%
0.00
13
Teapigs Ltd.
1.35%
77.05
3.25%
10.59
14
Teapigs US LLC
-0.03%
(1.94)
-0.08%
(0.26)
15
Stansand Ltd.
-
-
-
-
16
Stansand (Brokers) Ltd.
-
-
-
-
17
Stansand (Africa) Ltd.
0.15%
8.72
1.10%
3.59
18
Stansand (Central Africa) Ltd.
0.03%
1.88
0.48%
1.58
19
Joekels Tea Packers (Proprietary) Ltd.
0.21%
12.12
0.94%
3.06
20
Tata Global Beverages Polska sp.zo.o
-0.59%
(33.65)
-4.33%
(14.11)
21
Tata Global Beverages Czech Republic a.s.
0.00%
0.22
-2.02%
(6.59)
22
Tata Global Beverages US Holdings Inc.
7.09%
405.25
-0.74%
(2.41)
23
Tetley USA Inc.
5.00%
286.15
0.66%
2.14
24
Good Earth Corporation.
-0.11%
(6.17)
-0.08%
(0.27)
25
Good Earth Teas Inc.
0.23%
13.18
-4.62%
(15.05)
26
Tata Global Beverages Canada Inc.
1.56%
89.09
2.96%
9.65
27
Tata Global Beverages Australia Pty Ltd.
0.29%
16.36
1.19%
3.89
28
Earth Rules Pty Ltd.
-0.49%
(28.20)
-8.35%
(27.22)
29
Tata Global Beverages Investments Ltd.
66.34%
3793.67
20.78%
67.71
30
Campestres Holdings Ltd.
0.66%
37.85
-29.68%
(96.73)
31
Kahutara Holdings Ltd.
0.66%
37.80
-44.97%
(146.55)
32
Suntyco Holding Ltd. (Consolidated Financials)
-0.25%
(14.04)
-9.58%
(31.21)
-15.40%
(880.69)
-2.37%
(7.72)
Minorities in all Subsidiaries Associates Indian 1
Amalgamated Plantations Pvt. Ltd.
1.21%
69.31
-1.94%
(6.34)
2
Kanan Devan Hills Plantations Co. Pvt. Ltd.
-0.03%
(1.62)
-1.62%
(5.27)
3
TRIL Constructions Ltd.
-0.01%
(0.62)
-0.02%
(0.06)
0.27%
15.69
3.15%
10.26
Foreign Estate Management Services Pvt. Ltd.
213
Annual Report 2015-16
•
Connect with every sip
Net Assets
Share in Profit or Loss
Notes to Consolidated Financial Statements
Name of the Entity
As a % of Consolidated Net Assets
Amount (Rs in Crores)
As a % of Consolidated Profit or Loss
Amount (Rs in Crores)
t Ventures Indian 1
NourishCo Beverages Ltd.
0.10%
5.62
-4.91%
(16.00)
2
Tata Starbucks Pvt. Ltd.
1.77%
101.19
-6.16%
(20.07)
Foreign 1
Empirical Group LLC
0.23%
12.96
6.78%
22.09
2
Southern Tea LLC
0.71%
40.89
1.15%
3.74
3
Tetley ACI (Bangladesh) Ltd.
-0.02%
(0.96)
-0.65%
(2.12)
4
Tetley Clover (Pvt.) Ltd. Consolidation Eliminations/adjustments
Total
0.01%
0.54
-1.01%
(3.30)
-224.34%
(12829.87)
-85.20%
(277.69)
5718.92
325.91
48. Post Retirement Employee Benefits :
a.
The Group operates defined contribution schemes like provident fund and defined contribution superannuation schemes. For these schemes, contributions are made by the Group, based on current salaries, to funds maintained by the Group and, for certain categories contributions are made to State Plans. For certain schemes, contributions are also made by the employees. An amount of Rs 38.89 Crores (Rs 37.10 Crores) has been charged to the statement of profit and loss on of defined contribution schemes.
b.
The Group also operates defined benefit schemes like retirement gratuity, superannuation benefits and post retirement medical benefits. The superannuation benefits and medical benefits are restricted to certain categories of employees/ Directors in the form of pension, medical and other benefits in of a specific policy related to the same (“Others”). The defined benefit schemes offer specified benefits to the employees on retirement. Annual actuarial valuations are carried out by independent actuaries. Wherever funds have been set up, annual contributions are also made by the Group. Employees are not required to make any contribution.
c.
The Group has substantial international operations with approximately 60% of its revenues coming from overseas operations. For the purposes of consolidated financial statements, actuarial gains and losses relating to defined benefit pension scheme of overseas subsidiaries has been ed for in the Reserves instead of the statement of profit and loss, applying the ing principles of consolidation under ing Standard 21 and the policy followed by the overseas subsidiaries and as recognised by the relevant overseas ing framework. Adoption of the above policy is required to reflect a consistent framework amenable for better inter-firm comparison and to reflect the underlying performance. Further, the current policy is consistent with IND-AS 19 – Employee Benefits (mandatorily applicable from April 1, 2016) wherein, the actuarial gains and losses on defined benefit plans are not required to be recognised in the Statement of Profit and Loss.
214
Corporate Overview 01-48
Financial Statements 125-220
Statutory Reports 49-124
Notes to Consolidated Financial Statements
Overseas actuarial gains/losses principally relate to a defined benefit retirement scheme of an overseas subsidiary which is closed for future accruals. These gains/ losses represent increase in the value of future long term payment obligations due to changes in interest rates and other actuarial assumptions based on the market position as at the year end. The actuarial assumptions are subject to significant fluctuations especially under volatile market conditions. Had the company followed the policy of ing overseas actuarial gain/(loss) in the statement of profit and loss, the profit before tax, profit after tax before shares of results of Associate & Minority Interest and profit after tax would have been lower by Rs. 53.15 Crores (Rs 58.67 Crores), Rs. 42.61 Crores (Rs 48.11 Crores ) and Rs. 37.77 Crores (Rs 42.65 Crores) respectively.
The following tables set out the details of funded and un-funded retirement benefit plans and amounts recognised in the financial statements :
d.
i.
Amounts recognised in the Statement of Profit and Loss and charged to Contribution to Provident Fund and Other Funds, Staff Welfare as follows: Rs in Crores Pension
ii.
Others
2015
2016
2015
2016
2015
2016
2015
-
-
5.56
4.55
1.52
1.85
3.01
2.17
44.36
50.67
6.79
6.62
3.29
3.66
3.51
3.43
(47.00)
(52.34)
(5.72)
(5.59)
-
-
-
-
Net actuarial loss/ (gain) recognised during the year
(0.25)
0.16
6.30
4.08
2.19
(4.21)
6.65
3.15
Effects of the limit in Para 59(b) of AS-15
(0.27)
(0.09)
-
(0.01)
0.90
-
-
-
Total recognised in statement of profit and loss
(3.16)
(1.60)
12.93
9.65
7.90
1.30
13.16
8.75
Expected Return on plan assets
Medical
2016 Current Service Cost Interest on obligation
Gratuity
Reconciliation of opening and closing balances of the present value of the obligations: Rs in Crores Pension
Gratuity
Medical
Others
2016
2015
2016
2015
2016
2015
2016
2015
Opening defined benefit obligation 1281.79
1178.84
86.88
77.67
40.27
40.22
56.70
51.27
-
-
5.58
4.55
1.52
1.85
3.01
2.17
Current Service Cost Interest Cost Actuarial loss/ (gain) Liabilities assumed on Acquisition / (settled on Divestiture) etc. Exchange Rate Variation Benefit Paid Closing Defined Benefit Obligation
44.36
50.67
6.79
6.62
3.29
3.66
3.51
3.43
(16.23)
188.15
5.72
4.32
2.19
(4.21)
6.65
3.15
-
-
-
(0.62)
0.90
-
-
-
43.44
(99.24)
-
-
-
-
-
-
(41.56)
(36.63)
(8.08)
(5.66)
(1.03)
(1.25)
(4.31)
(3.32)
1311.80 1281.79
96.91
86.88
47.14
40.27
65.56
56.70
215
Annual Report 2015-16
•
Connect with every sip
Notes to Consolidated Financial Statements
iii)
Reconciliation of opening and closing balances of the fair value of plan assets: Rs in Crores Pension 2016
2015
2016
2015
1111.31
1051.20
77.53
69.17
47.00
52.34
5.72
5.59
(69.13)
129.32
(0.58)
0.24
-
-
-
-
Contribution/ ( Withdrawal) by employer
34.40
-
8.74
8.89
Assets acquired on Acquisition / (settled on Divestiture)
(1.00)
-
-
(0.70)
Exchange Rate Variation
38.70
(85.34)
-
-
(41.17)
(36.21)
(7.84)
(5.66)
1120.11
1111.31
83.56
77.53
(22.12)
181.66
5.14
5.83
2016
2015
0.14%
0.18%
Equity
32.61%
35.07%
Bonds
50.12%
49.77%
7.46%
7.14%
Property
8.07%
7.29%
Others
1.60%
0.55%
100.00%
100.00%
Opening fair value of Plan Assets Expected Return on plan assets Actuarial gain/ (loss) Asset distributed on settlement
Benefits Paid Closing Fair value of Plan Assets Actual Return on Plan Assets
iv.
Gratuity
Major Categories of Plan Assets as a percentage of fair value of the total plan assets:
Govt of India Securities
Insurance managed Funds
Total
v.
Effect of increase/ decrease of one percentage point in the assumed medical inflation rates: Rs in Crores Increase
216
Decrease
2016
2015
2016
2015
Effect on aggregate of interest cost and current service cost
2.77
1.58
(2.19)
(1.98)
Effect on defined benefit obligation
5.85
4.47
(4.68)
(4.01)
Corporate Overview 01-48
Financial Statements 125-220
Statutory Reports 49-124
Notes to Consolidated Financial Statements
vi.
Principal Actuarial assumptions used:
Discount rates
2016
2015
8.05% / 7.90% / 7.80% / 7.60% / 3.40%
8.00% / 9.30% / 9.00% / 3.40%
7.50% / 8.00%
7.50% / 8.85%
8.00%
8.00%
Expected rate of return on plan assets Medical inflation rate
LIC 1994-96 mortality LIC 1994-96 mortality tables/ other tables/ other approved norms for approved norms for overseas schemes overseas schemes
Mortality rates
The estimates of future salary increases considered in the actuarial valuation takes into factors like inflation, future salary increases, supply and demand in the employment market etc. The expected return on plan assets is based on actuarial expectation of the average long term rate of return expected on investments of the Funds during the estimated term of the obligations.
The contribution expected to be made by the Group for the year ending March 31, 2017 is not readily ascertainable.
Amounts recognised in the Balance Sheet are as follows:
vii.
Rs in Crores Particulars
Pension 2016
2015
Gratuity
2014
2013
2012
2016
2015
2014
2013
2012
Present value of funded obligation
1307.91 1277.64 1174.42
957.88
846.28
96.91
86.88
77.67
68.34
56.18
Fair Value of Plan Assets
1120.11 1111.31 1051.20
810.42
694.65
83.56
77.52
69.17
56.37
46.46
187.80 166.33 123.22 147.46 151.63
8.50
11.97
9.72
0.03
-
13.35
9.36
Present Value of Unfunded Obligation
3.89
4.15
4.42
4.63
5.91
-
-
Amount not recognized as an asset (limit in Para 59 (b) of AS -15)
0.42
0.69
0.77
0.66
0.71
-
-
0.02
-
-
(0.99)
-
-
-
-
-
-
-
-
-
191.12 171.17 128.41 152.75 158.25
13.35
9.36
8.52
12.00
9.72
Contribution adjustment Net Liability
217
Annual Report 2015-16
•
Connect with every sip
Notes to Consolidated Financial Statements
Particulars
Medical 2016
2015
2014
Present value of funded obligation
-
-
-
Fair Value of Plan Assets
-
-
-
-
-
-
47.14
40.27
-
47.14
Present Value of Unfunded Obligation Amount not recognized as an asset (limit in Para 59 (b) of AS -15) Net Liability
Others 2013
2012
2016
2015
2014
2013
-
-
-
-
-
-
-
-
-
-
-
-
-
-
-
-
-
40.22
41.94
37.78
65.56
56.70
51.27
38.89
-
-
-
-
-
-
-
-
40.27
40.22
41.94
37.78
65.56
56.70
51.27
38.89
49. Unless otherwise stated, figures in brackets relate to the previous year and have been rearranged / regrouped, wherever necessary.
For Lovelock & Lewes Firm Registration No. 301056E Chartered ants Dibyendu Majumder Partner hip No. 057687 Mumbai 24th May, 2016
218
Cyrus P Mistry Chairman L Krishnakumar Executive Director V Leeladhar Director John Jacob Chief Financial Officer
Ajoy Misra Managing Director Harish Bhat Director Darius Pandole Director V Madan Company Secretary
Tata Global Beverages Group Ltd. Tata Global Beverages Holdings Ltd. Tata Global Beverages Services Ltd. Tata Global Beverages GB Ltd. Tata Global Beverages Overseas Holdings Ltd. Tata Global Beverages Overseas Ltd. Lyons Tetley Limted (Dormant) Drassington Ltd. Teapigs Ltd. Teapigs US LLC Stansand Ltd. (Dormant) Stansand Brokers Ltd. (Dormant) Stansand (Africa) Ltd. Stansand (Central Africa) Ltd. Joekels Tea Packers (Proprietary) Ltd. Tata Global Beverages Polska.sp.zo.o Tata Global Beverages Czech Republic a.s Tata Global Beverages US Holdings Inc Tetley USA Inc. Good Earth Corporation Good Earth Teas Inc. Tata Global Beverages Canada Inc Tata Global Beverages Australia Pty Ltd. Earth Rules Pty Ltd. Tata Global Beverages Investment Ltd. (Refer Note 3) Campestres Holdings Ltd. Kahutara Holdings Ltd. Suntyco Holdings Ltd. Onomento Co Ltd OOO Sunty LLC (Refer Note 1) OOO Teatrade LLC (Refer Note 1) Tata Global Beverages Capital Ltd Tata Coffee Ltd Consolidated Coffee Inc. Eight O Clock Holdings Inc. Eight O Clock Coffee Inc. Tata Tea Extractions Inc. Zhejiang Tata Tea Extraction Company Ltd. (Refer Note 1) Tata Tea Holdings Private Ltd.
1 2 3 4 5
8.37 (81.94) 51.11 14.09 (28.63) 2.17 12.68 739.11 (51.91) (0.47) 104.92 209.24 (100.46)
(17.42) (18.67) 31.88 (1.94) 8.74 0.89 12.06 (118.63) (4.67) (38.66) (618.17) (6.17) (106.66) 80.61 (42.83) (103.80) 1468.36 8.88 47.53 51.95 14.27 90.24 35.65 1588.52 1054.16 403.65 397.11 1612.55 333.77 70.13
63.97 0.19 95.00 5.23 0.05 0.30 35.26 2.24 33.71 23.69 27.24 602.48 319.34 0.11 29.26 155.97 118.62 58.44 3703.21
Rs in Crores 8039.09 1809.22 4962.44 2811.70 460.44
0.49 129.33 0.39 0.13 108.77 33.48 720.40 296.37 58.72 0.75 1110.80 31.79 114.54
81.39 53.58 7.17 26.48 1.35 21.65 64.69 31.36 197.24 33.18 6.27 16.08 67.68 101.32 86.63 3.35
Rs in Crores 5787.61 143.04 1663.74 1089.50 883.44
Total Liabilities
46.89 48.42 1524.11 215.99 396.84 396.84 288.68 -
0.00 598.05 18.73 14.99 25.09
Rs in Crores 7388.61 1702.10 9.55 326.14
Investments
2.58 282.88 15.41 718.18 839.90 94.24 3.08
99.24 8.17 166.39 48.46 95.70 55.95 53.99 130.85 38.27 361.63 141.12 85.25 -
Rs in Crores 197.25 1354.10 -
Turnover
(30.77) (125.35) (0.10) 2.46 (24.51) 0.18 8.30 141.97 46.84 48.72 114.40 20.68 (15.34)
0.33 20.02 (0.26) 5.30 1.80 3.33 (13.50) (6.45) (2.36) 2.39 (0.27) (14.94) 12.18 5.61 (26.95) 33.88
Rs in Crores 47.58 29.49 3.11 7.75 (373.22)
Profit before Taxation
0.00 0.20 (7.54) (0.13) 5.60 (39.47) 0.73 0.09 (36.26) (5.79) -
0.06 (4.01) (1.69) (0.57) (1.00) (0.05) (2.51) (1.68) (24.46)
Rs in Crores 12.38 (6.59) (16.24) 2.09
Provision for Taxation
0.39 16.01 (0.26) 3.61 1.24 2.33 (13.50) (6.45) (2.36) 2.35 (0.27) (14.94) 9.67 3.93 (26.95) 9.42
Rs in Crores 59.96 29.49 (3.48) (8.48) (371.13)
Profit after Taxation
-
-
Rs in Crores
-
65.32 65.32 65.32 65.32 1.08 1.08 98.28 65.32 65.32 65.32 65.32 10.22
98.28 98.28 98.28 98.28 65.32 98.28 98.28 0.65 0.12 4.82 17.01 2.64 65.32 65.32 65.32 65.32 49.87 47.92 47.92 97.88
Rs 98.28 98.28 98.28 98.28 98.28
Average yearly rates for P&L items translation
Statutory Reports 49-124
100.00
100.00 65.00 100.00 100.00 100.00 100.00 100.00 57.48 100.00 100.00 100.00 100.00 81.46
100.00 100.00 100.00 100.00 100.00 100.00 100.00 100.00 100.00 51.00 100.00 100.00 100.00 100.00 100.00 100.00 100.00 100.00 100.00 100.00
% 88.65 100.00 100.00 100.00 100.00
Proposed % of ShareDividend holding (Refer Note 2)
-
0.02 0.13 0.46 0.05 10.10 0.00 855.44 18.68 396.84 396.84 396.84 92.75 56.04
0.19 18.67 9.55 0.05 0.30 0.03 0.00 0.00 77.63 0.56 443.89 904.34 119.85 7.69 60.13 75.61 2231.50
Rs in Crores 7.31 1666.18 3297.17 1722.21 (423.00)
Rs in Crores 2244.17 0.00 1.53 -
Total Assets
39 INR 0.05 (0.05) 0.01 0.01 (0.00) (0.00) Note: 1. Reporting period for all subsidiaries are 31.03.2016 except for OOO Sunty LLC, OOO Teatrade LLC and Zhejiang Tata Tea Extraction Company Ltd. - 31.12.2015. 2. % of shareholding is based on voting power held by the immediate parent. 3 Financial year is of eighteen months as the entity has changed its financial year end from September to March during the year. 4 Balance sheet items have been translated at the exchange rate as on the last day of relevant financial year. 5 The numbers reported above are based on individual financial statements prepared under local GAAP. 6 Above list does not include RBC Hold Co LLC which was dissolved during the year 2015-16. The assets held by the said entity amounting to Rs 0.83 Crores is pending distribution subject to completion of regulatory formalities.
66.25 66.25 66.25 66.25 0.90 0.90 95.47 66.25 66.25 66.25 66.25 10.19
95.47 95.47 95.47 95.47 66.25 95.47 95.47 0.65 0.10 4.50 17.70 2.79 66.25 66.25 66.25 66.25 51.23 50.96 50.96 95.47
Reserves & Surplus
Share Capital
24.28 -
USD USD USD USD RUR RUR GBP INR USD USD USD USD CNH
GBP GBP GBP GBP USD GBP GBP KES MWK SAR PLN CZK USD USD USD USD CAD AUD AUD GBP
Reporting Exchange rate Currency as on last day of relevant financial year (Refer Note 4) Rs GBP 95.47 GBP 95.47 GBP 95.47 GBP 95.47 GBP 95.47
(30.77) (125.35) 0.10 2.46 (32.05) 0.05 13.90 102.50 47.56 48.81 78.14 14.89 (15.34)
26 27 28 29 30 31 32 33 34 35 36 37 38
6 7 8 9 10 11 12 13 14 15 16 17 18 19 20 21 22 23 24 25
Name of the Subsidiary
SL No
Part “A” : Subsidiaries
Statement pursuant to first proviso to sub-section (3) of section 129 of the Companies Act 2013, read with rule 5 of Companies (s) Rules, 2014 in the prescribed Form AOC-1 relating to subsidiaries/Associates companies / t ventures
Corporate Overview 01-48 Financial Statements 125-220
219
220
6 i ii
5
4
3
1 2
-
67000000@ 67.00
(9.61) -
128.20
Not Applicable
(5.58) -
21.90
Not Applicable
Shareholding
28.52%
41.03%
Shareholding
12.33
3976563
61024400 61.02
Associate 31.03.2016
Associate 31.03.2016
Amalgamated Kanan Devan Plantation Hill Plantations Private Limited Limited
(0.06) -
50.17
Not Applicable
Shareholding
66751852 66.75
32.50%
11.75
11748148
10.26 -
62.18
Not Applicable
Shareholding
-
31.85%
14.57
12078406
(3.30) -
1.92
t Venture Agreement Not Applicable
3000000 2.74
50%
32.57
43750000
TRIL Estate Tetley Clover Management (Private) Limited Construction Limited Services Private Limited Associate Associate t Venture 31.03.2016 31.03.2016 30.06.2015
Associate Companies and t Ventures have been determined based on the ing Standards * Profit/(Loss) based on individual Financial Statements drawn up as at 31.03.2016, for consolidation purposes. ** Represents Group's share of profit/(loss) @ redeemable preference shares.
Reason why the associate/t venture is not consolidated Networth attributable to Shareholding as per latest audited Balance Sheet (Rs in Crs) Profit / (Loss) for the year* Considered in Consolidated** (Rs in Crores) Not Considered in Consolidated (Rs in Crores)
ii) Amount of Investment in Associates/t Venture (Rs in Crores) iii) Extent of Holdings Preference Shares i) Number ii) Amount of Investment in Associates/t Venture (Rs in Crores) Description of how there is significant influence
Latest audited Balance Sheet Date Shares of Associate /t Ventures held by the company on the year -end Equity Shares i) Number
Part "B" : Associates and t Ventures Sl Name of Associates/ t Ventures No.
(2.12) -
(4.64)
t Venture Agreement Not Applicable
-
50%
22.16
2000000
t Venture 31.12.2015
Tetley ACI (Bangladesh) Limited
22.09 -
12.96
t Venture Agreement Not Applicable
-
56%
hip Interest-56% -
t Venture 31.03.2016
Empirical Group, LLC
3.74 -
39.99
t Venture Agreement Not Applicable
-
50%
hip Interest-50% 33.74
t Venture 31.12.2015
Southern Tea, LLC
(16.00) -
5.62
t Venture Agreement Not Applicable
-
50%
90.50
90500000
t Venture 31.03.2016
(20.08) -
101.20
t Venture Agreement Not Applicable
-
50%
178.00
178000000
t Venture 31.03.2016
NourishCo Tata Starbucks Beverages Private Limited Limited
Statement pursuant to first proviso to sub-section (3) of section 129 of the Companies Act 2013, read with rule 5 of Companies (s) Rules, 2014 in the prescribed Form AOC-1 relating to subsidiaries/Associates companies / t ventures
Annual Report 2015-16 • Connect with every sip
"
"
GLOBAL BEVERAGES LIMITED ed office: 1, Bishop Lefroy Road, Kolkata 700 020 Corporate Identity Number (CIN) - L15491WB1962PLC031425 E-mail id - [email protected] Website address – www.tataglobalbeverages.com PROXY FORM (Pursuant to Section 105(6) of the Companies Act, 2013 and Rule 19(3) of the Companies (Management and istration) Rules, 2014) Name of the Member(s) : _________________________________________________________________________________________ ed Address : ________________________________________________________________________________________ Email Id : ________________________________________________________________________________________ Folio No. / DP ID NO. / Client ID No. : ________________________________________________________________________________________ I/We, being the member(s) of -----------------shares of Tata Global Beverages Limited, hereby appoint 1. Name ________________________________________________________________________ E-mail id: ________________________ Address:__________________________________________________________________________________________________________ _____________________________________________________________________________ Signature: ________________________ Or failing him Name ________________________________________________________________________ E-mail id: ________________________ 2. Address:__________________________________________________________________________________________________________ _____________________________________________________________________________ Signature: ________________________ Or failing him 3. Name ________________________________________________________________________ E-mail id: ________________________ Address:__________________________________________________________________________________________________________ _____________________________________________________________________________ Signature: ________________________ As my/our proxy to attend and vote (on a poll) for me/us , and on my /our behalf at the fifty third Annual General Meeting of the Company to be held on Wednesday, 24th August 2016 at 10.30 a.m. at the Oberoi Grand, 15, Jawaharlal Nehru Road, Kolkata 700 013 and at any adjournment thereof in respect of such resolutions as are indicated below: 1.
2. 3. 4. 5. 6.
To receive, consider and adopt: (a) the audited financial statements for the financial year ended 31st March 2016, together with the reports of the Board of Directors and Auditors thereon; and (b) the audited consolidated financial statements of the Company for the financial year ended 31st March 2016 together with the report of the Auditors thereon. Declaration of dividend Re-appointment of Mr. Cyrus P. Mistry as Director. Affix Ratification of appointment of auditors Revenue Remuneration of cost auditors Stamp Issue of Non Convertible Debentures on private placement basis
Signed this _________________________day of _________________________2016 Signature of shareholder _______________________________________ Signature of proxyholder(s) __________________________________ Notes: 1.
This Form in order to be effective should be duly completed and deposited at the ed Office of the Company at 1, Bishop Lefroy Road, Kolkata 700 020, not less than 48 hours before the commencement of the Meeting. 2 . Those who have multiple folios may use copies of this Attendance slip/ Proxy.
To, TSR Darashaw Limited Unit: Tata Global Beverages Limited 6-10 Haji Moosa Patrawala Industrial Estate, 20 Dr. E. Moses Road, Mahalaxmi, Mumbai 400 011 Updation of Shareholder Information I / We request you to record the following information against my / our Folio No.: General Information: Folio No.: Name of the first named Shareholder: PAN: * CIN / Registration No.: * (applicable to Corporate Shareholders) Tel No. with STD Code: Mobile No.: Email Id: *Self attested copy of the document(s) enclosed Bank Details: IFSC: (11 digit) MICR: (9 digit) Bank A/c Type: Bank A/c No.: * Name of the Bank: Bank Branch Address: * A blank cancelled cheque is enclosed to enable verification of bank details I / We hereby declare that the particulars given above are correct and complete. If the transaction is delayed because of incomplete or incorrect information, I / we would not hold the Company / RTA responsible. I / We undertake to inform any subsequent changes in the above particulars as and when the changes take place. I / We understand that the above details shall be maintained till I / we hold the securities under the above mentioned Folio No. / beneficiary . Place: ____________________________ Date:
Signature of Sole / First holder
Corporate Information BOARD OF DIRECTORS Cyrus P. Mistry (Chairman) Mallika Srinivasan (Mrs.) Analjit Singh V. Leeladhar Ranjana Kumar (Mrs.) Darius Pandole S. Santhanakrishnan Ireena Vittal (Mrs.) Harish Bhat Ajoy Misra, Chief Executive Officer & Managing Director L. KrishnaKumar, Executive Director & Group Chief Financial Officer V. Madan, Vice President and Company Secretary
BOARD COMMITTEES
ED OFFICE
BANKERS
Audit Committee V. Leeladhar (Chairman) Ranjana Kumar (Mrs.) Darius Pandole S. Santhanakrishnan Ireena Vittal (Mrs.) Harish Bhat
1, Bishop Lefroy Road, Kolkata - 700 020 Telephone : 033-22813779/3891/4422/4747/66053400 Fax : 033-22811199 Website : www.tataglobalbeverages.com
Bank of America Citibank N.A Coöperatieve Centrale Raiffeisen Boerenleenbank B.A. ( RABO BANK) Deutsche Bank HDFC Bank Limited ICICI Bank Limited Standard Chartered Bank State Bank of India State Bank of Travancore The Hongkong and Shanghai Banking Corporation Limited The Royal Bank of Scotland N.V. YES Bank Limited
Nomination and Remuneration Committee Ranjana Kumar (Mrs.) (Chairperson) Cyrus P. Mistry V. Leeladhar Darius Pandole Harish Bhat
SOLICITORS AND LEGAL ADVISERS AZB Partners Cyril Amarchand Mangaldas Dua Associates Khaitan & Co. Orr Dignam & Co. Veritas Legal
AUDITORS Lovelock & Lewes
Stakeholder Relationship Committee V. Leeladhar (Chairman) S. Santhanakrishnan L. KrishnaKumar Executive Committee Cyrus P. Mistry (Chairman) Harish Bhat Ireena Vittal (Mrs.) Ajoy Misra L. KrishnaKumar Corporate Social Responsibility Committee Ranjana Kumar (Mrs.) (Chairperson) V. Leeladhar S. Santhanakrishnan Ajoy Misra Prof. S. Parasuraman (Expert Member) Ethics and Compliance Committee V. Leeladhar (Chairman) Ranjana Kumar (Mrs.) Ajoy Misra
REGISTRARS Equity Shares and Fixed Deposits TSR Darashaw Limited (Formerly Tata Share Registry Limited) (Unit : Tata Global Beverages Ltd.) 6-10, Haji Moosa Patrawala Ind. Estate, 20, Dr. E. Moses Road, Mahalaxmi, Mumbai - 400 011 Telephone : 022-66568484 Fax : 022-66568494 Website : www.tsrdarashaw.com Kolkata Office 1st Floor, Tata Centre, 43, Chowringhee Road, Kolkata - 700 071 Telephone : 033-22883037 Fax : 033-22883097
Tata Global Beverages Limited 1, Bishop Lefroy Road, Kolkata - 700 020 www.tataglobalbeverages.com
Connect with every sip
In this report Corporate Overview TGB at a Glance Vision, Purpose and Values Managing Director & CEO’s Message Performance Highlights (Consolidated) Strategic Priorities Consumer Insights
Develop Deliv Deligj develop deliver
delight
02 04 06 08 10 12
Develop Making the Perfect Cup of Chai A Brew to Drawing out Flavour and Fun
13 14 16 18
Deliver Building Sustainability into our Products Making Healthy Fun Brewing Connections over Coffee Super Teas to Supercharge your Day
20 21 24 26 28
Delight Reaching the Rural Indian Consumer Socially Responsible and Responsive In Keeping with Culture Coffee with F.R.I.E.N.D.S. Hello Mr. Barista! Consumer Relationship Service
30 31 35 36 38 41 42
Board of Directors Executive Office 10-Year Financial Highlights
44 46 48
Statutory Reports Notice
Directors’ Report Management Discussion and Analysis Report on Corporate Governance
49 58 97 104
Financial Statements STANDALONE Independent Auditors’ Report Annexure to Independent Auditors’ Report Balance Sheet Statement of Profit & Loss Cash Flow Statement Notes forming part of Financial Statements
125 127 132 133 134 136
CONSOLIDATED Independent Auditors’ Report Consolidated Balance Sheet Consolidated Statement of Profit & Loss Consolidated Cash Flow Statement Notes to Consolidated Financial Statements Subsidiary Companies’ Financial Highlights
169 174 175 176 178 219
connect every sip CORPORATE OVERVIEW 01-48
STATUTORY REPORTS 49-124
FINANCIAL STATEMENTS 125-220
WITH
Consumers are the centre of a business’ existence. They us, challenge us and inspire us to go the extra mile. Our beverage offerings and our business have consumer centricity embedded in them, we believe this is essential for business success. The theme of this year’s annual report ‘Connect with every sip’ is an exploration of how Tata Global Beverages (TGB) pursues consumer centricity in everything we do. Building a connect with consumers is a way of life for us. It is this connect that helps us build iconic brands, new routes to market and innovative beverage offerings. At TGB, we believe consumer centricity has to be part of the way the
organisation operates rather than being confined to just products or marketing campaigns. It starts right from the way we source our products to the way we craft our blends, respond to consumer queries, leverage Consumer Insights to innovate, decide on the best route to market and communicate our brand offerings. Within the pages of this report, you will find examples of our efforts in these areas. We take pride in the fact that over 300 million servings of our brands are consumed everyday across the globe. With the ability to touch the lives of many comes a sense of responsibility. TGB upholds the Tata Group’s promise on consumer centricity: - D EVELOP a deep understanding of the unique needs of our customers. - D ELIVER pioneering products and services of outstanding quality and value. - D ELIGHT our customers with great experiences at every touchpoint. The beverage landscape in tea, coffee and water is evolving faster than ever before. This has its roots in consumer trends such as isation, health
& wellness and convenience. Keeping pace with evolving consumer tastes across various geographies is both an opportunity and a challenge. It gives us the inspiration to constantly push our boundaries and reimagine the way we create and market our products. At TGB, we believe tea, coffee and water are beverages which can sprinkle subtle magic on your day. But they can do that only if our brands are in tune with consumer needs. Whether it is infusing tea with vitamins to meet consumers’ health & wellness needs, breaking barriers between consumers and farmers through our Farmers First Hand digital initiative, developing blends to deliver enhanced beverage experiences or delighting consumers with unique marketing campaigns - the common thread running through all these efforts is building a connect with the consumer. We hope you enjoy reading this report along with a cup of your favourite beverage. We aim to connect with every sip!
Annual Report 2015-16
•
Connect with every sip
TGB at a Glance Tata Global Beverages (TGB) is a natural beverages business with a heritage of innovation and development and an aim to be the most ired brand in the world. Our focus is to expand our global footprint by entering new markets and strengthening our brand portfolio in Tea, Coffee and Water.
Financial highlights 2015-16
Rs.
8111CR
Consolidated Revenue from Operations
Rs.
675 CR
Rs.
5.16
EBITDA
Earnings per Share
3000+
Employees worldwide
2nd
Largest player in branded tea in the world
60%+
of consolidated revenue from markets outside India
40+
Countries with significant brand presence
2
CORPORATE OVERVIEW 01-48
STATUTORY REPORTS 49-124
FINANCIAL STATEMENTS 125-220
Geographic Distribution
USA & Canada
Africa
Tetley Teapigs Tata Tea Good Earth
Tetley Joekels
Europe, Russia & The Middle East
Tetley Jemca Vitax Tata Tea Teapigs
South Asia
Australia
Tetley Tata Tea
Tetley Teapigs
Tata Coffee Grand
MAP
Eight O’ Clock Grand Coffee
Brand portfolio
Tata Gluco + Tata Water Plus Himalayan
Tata Tea brands National: Tata Tea , Tata Tea Gold, Tata Tea Life and Tata Tea Agni Regional: Tata Tea Chakra Gold, Tata Tea Kannan Devan and Tata Tea Gemini
3
Annual Report 2015-16
•
Connect with every sip
Vision, Purpose and Values
VISION
VALUES
To be the most ired natural beverages company in the world by making a big and lasting difference in Tea,
Coffee and Water.
PURPOSE We will focus on creating
magical beverage moments
for consumers and an eternity of sustainable goodness for our communities.
4
We recognise that agility is key to driving growth. We have a bias for action, seizing opportunities and responding to challenges proactively. We are committed to building an agile and responsive organisation, ed by equally nimble processes. With detailed action plans, timelines and measures we are focused on delivery.
Our goal is to evolve brilliant products and services that meet future consumer needs. We recognise that this requires a spirit of innovation and stretch, and a mindset that keeps consumers at the centre. We will continuously challenge status quo and seek alternative solutions, pursuing both global ‘new growth’ and strong ‘local’ innovations with equal zeal.
CORPORATE OVERVIEW 01-48
Our brands aren’t just products; they are promises we keep and experiences we deliver. With a structured approach we seek to develop valuable insights about what our consumers need – today, tomorrow and years later. For us, quality is foremost; we will not tolerate quality that falls short of promises and expectation. We are committed to building a strong ‘consumer first’ mindset, ed by rigorous consumer metrics. We will engage with our customers and build mutually beneficial business relationships.
STATUTORY REPORTS 49-124
We recognise that our ambitious goals can be realised only through cohesive teamwork. We encourage collaboration and gain commitment by involving the team in decisionmaking by creating excitement around common goals. With an open mind, we are willing to change our ideas or perceptions based on new information or contrary evidence.
FINANCIAL STATEMENTS 125-220
We do the right thing for the environment and community around us, while inspiring and empowering others to do the same. We are fair and ethical with all our stakeholders. It is important for us to provide an approachable and caring work environment and a physical workplace that is safe, healthy and clean.
5
Annual Report 2015-16
•
Connect with every sip
Managing Director & CEO’s Message
“We take pride in the fact that over 300 million servings of our brands are consumed everyday across the world.” Ajoy Misra Managing Director & CEO
Dear Shareholders, The year saw Tata Global Beverages initiating key product launches, strong marketing campaigns and category expansion, in a challenging market environment marked by macroeconomic volatility, high competitive intensity and sluggish category growth in some markets. Your Company is meeting these challenges through strengthening its core businesses, innovating for growth and tapping white spaces in the market. In order to ensure execution of our business plans, we will also focus on improving distribution reach and cost efficiency. Our profit after tax increased significantly, however profit from operations saw a decline due to commodity price increases, higher investment in brand building, promotional intensity and category decline in some developed markets. The fundamentals of the business remain strong with robust brands, extensive distribution networks, a healthy innovation pipeline and effective monitoring of cost efficiency. We see significant headroom for growth in many
6
of the markets we operate in and we are well positioned to leverage this with our strong brands and a heritage of expertise in natural beverages. Meeting challenges in the market, strengthening the business and ensuring long-term sustainable growth requires us to be keenly aware of our consumers’ needs and changing trends across the world which are impacting lifestyles and beverage consumption patterns. We do this through embedding this focus across our business and making sure we are consumer centric in whatever we do.
Connect with every sip
Our theme for this year’s annual report showcases the various ways through which your Company connects with consumers. We take pride in the fact that over 300 million servings of our brands are consumed everyday across the world. This means we have immense opportunity to build a connect with every sip. Consumer centricity is not new to Tata Global Beverages. In India, many years ago we launched tea in poly
packs at a time when no other brand did so, and created a revolution in the way tea was packaged and sold. Since then, your Company has evolved to become a branded beverages company, it has expanded its global presence, launched innovative products, expanded into the coffee and water business. But it has never lost sight of what lies at the core of it all - understanding the consumer. This, we believe is an intrinsic part of who we are and as we keep pace with fast moving trends and market developments, it will continue to be key to achieving our goals.
Leveraging the health & wellness trend
Over the last year, Tata Global Beverages has focused on leveraging the health & wellness trend across its markets. We see this trend manifest in different ways and at different stages in our markets, so our product offerings are customised accordingly. We continue to maintain a strong focus on our green tea portfolio. This is especially relevant given that we’re seeing the black tea category de-growing in some developed markets while green,
CORPORATE OVERVIEW 01-48
fruit & herbal and specialty teas are showing strong growth. Tetley Super Green Tea, launched in UK, has vitamins blended with the tea and is the UK’s first functional green tea. Encouraged by the excellent consumer response to Tetley Super Green Tea, we also launched a range of Tetley Super fruit teas. Intriguing flavour combinations and benefits relevant to the younger consumer were also made available. In the water segment, Tata Gluco Plus which is being marketed by NourishCo (a t Venture between Tata Global Beverages and PepsiCo) has performed very well during the year clocking a volume growth rate of 84%. The energy benefit the brand promises and its revamped communication has found favour with consumers and resulted in strong growth for the brand.
Innovating to stay ahead
Across markets, we’ve seen a clear emphasis on innovation based on strong Consumer Insights. In India, we entered the branded instant coffee segment with the launch of Tata Coffee Grand, which innovates both in of the blend as well as in its packaging and communication. We also launched a Tata Tea blend in India specifically customised for the Maharashtra market. This market was a white space for us and the launch enabled us to strengthen our presence there. Rural India is a challenge and an opportunity for beverage brands. With ‘Gaon Chalo,’ our rural distribution initiative we wanted to not just reach out to these markets, but do so in an innovative way that provided livelihood opportunities for people there. The Gaon Chalo model has proven very effective and currently covers over 74,000 villages across 19 states. Eight O’ Clock coffee in the US developed a specially crafted instant coffee blend for one of the largest retailers in that market. The brand has also adopted innovative ways of connecting with consumers such as inviting consumers to explore the flavours of Eight O’ Clock coffee through coffee thins - a tasty treat made of Eight O’ Clock coffee beans.
STATUTORY REPORTS 49-124
isation is a key trend we’re seeing in the beverages category with consumers seeking more indulgent beverage experiences. In response to this we’ve crafted a number of our offerings to cater to this need such as our super brand Teapigs in the UK. Teapigs offers innovative flavour combinations such as chilli chai and chocolate & mint tea.
Riding the digital wave
The digital medium is changing the way consumers interact with brands. Most of our brand launches during the year integrated digital communication into their marketing plans in order to create a stronger consumer connect. Whether it was Tata Coffee Grand using virtual reality to take consumers on a tour of the plantations, Himalayan mineral water inviting consumers to ‘Live Natural’, Tetley in Canada using a YouTube series to generate awareness and engagement around its specialty teas or the Tetley Farmers First Hand initiative which broke communication barriers between consumers and the farmers who grow their tea - innovative digital initiatives were a key focus area.
Connecting through sustainability
In all we do, sustainability continues to play a vital role. We focus on sustainability through our five pillars: Sustainable Sourcing, Climate Change, Water Management, Waste Management and Community Development. We live in a world where consumers are increasingly aware and interested in the way the products they buy are grown or made. So, integrating sustainability with our business also contributes to being consumer centric. Over the last year, we made good progress in Project S-PPF (Sustainable Plant Protection Formulation), an initiative to develop ecological solutions for plant protection in tea. We continue to stay actively involved with the trustea initiative in India and with the Ethical Tea Partnership and play a key role in these initiatives. We also commissioned a Climate Change report during the year on the
FINANCIAL STATEMENTS 125-220
74,000 villages across 19 states are currently covered by The Gaon Chalo model
impact of climate change in the tea growing regions of Assam. We believe this initiative will help us contribute to a sustainable and progressive future for the tea industry that also creates a positive societal impact. In conclusion, I would like to express my appreciation and gratitude for the we have always received from all our stakeholders. I trust that as you read through the pages of this Annual Report, you will obtain a clear view of the many ways in which we uphold consumer centricity to strengthen and grow our business. The consumer centricity principle is one of our core values and we believe in embedding it throughout our business. With warm wishes, Ajoy Misra Managing Director & CEO
7
Annual Report 2015-16
•
Connect with every sip
Performance Highlights (Consolidated) Revenues from Operations FY 2011-12
(Rs. cr)
6640
FY 2012-13
7351
FY 2013-14
7738
FY 2014-15
7993
FY 2015-16
8111
EBITDA
(Rs. cr)
FY 2011-12
623
FY 2012-13
768
FY 2013-14
752
FY 2014-15
775
FY 2015-16
675
Profit Before Tax
(Rs. cr)
FY 2011-12
574
FY 2012-13
637
FY 2013-14
707
FY 2014-15
500
FY 2015-16
545
Group Net Profit FY 2011-12
(Rs. cr) 356
FY 2012-13
373
FY 2013-14 FY 2014-15 FY 2015-16
8
481 248 326
CORPORATE OVERVIEW 01-48
Earnings per share (EPS) FY 2011-12
FINANCIAL STATEMENTS 125-220
STATUTORY REPORTS 49-124
(Rs.)
5.76
FY 2012-13
6.03
FY 2013-14
7.77
FY 2014-15
3.93
FY 2015-16
5.16
Segmental Revenue
(%) 1%
1%
25%
26% FY 2014-15
FY 2015-16
74%
Tea
73%
Coffee
Others
Brand Wise Sales
(%) 16%
16% 34% 14%
FY 2014-15
36%
33% 14%
FY 2015-16
37%
Tetley
Eight O’Clock
India Tea Brands
Others & Speciality brands
9
Annual Report 2015-16
•
Connect with every sip
Strategic Priorities TGB is the 2nd largest tea company in the world, and we aim to become the global leader in branded natural beverages. We aspire to grow our business by focusing on innovation that is enhancing the way consumers enjoy beverages, by growing our brands and investing in new and exciting opportunities to expand our business. We are building a global business, with 60% of the consolidated
Our strategy is built around 4 key pillars: Base Business Rejuvenation
Drive Innovation Agenda
Invest for Growth
Organisational Effectiveness
revenues coming from markets outside India. Our strategy focuses on product innovation, building global brands, strengthening our core markets and achieving success in new channels and markets, coupled with greater efficiency. We are focused on building unique competencies, differentiated offerings, appealing brands, and significant scale in the three natural beverage categories of tea, coffee and water.
Base Business Rejuvenation: TGB is home to iconic brands across the globe. As part of our strategy, we will continue to invest significantly to build our power brands in our 3 core categories - tea, coffee and water. We are committed to delivering profitable growth in our core businesses. A clear set of actions will drive this: • Focus on brand building, isation and enhancing distribution reach Our brands are what differentiate us in the marketplace. So, we will continuously engage with the end consumer through our brands. isation is one of the most prominent trends in the beverage category. We will leverage this trend by increasing the number of super and brands in our portfolio. Distribution reach remains critical to our business, we will focus on further enhancing reach through deepening existing channels and building new ones. • Grow non-black tea segments green, fruit & herbal The green, fruit and herbal tea segments are experiencing exponential growth. With multiple variants of green tea and fruit and herbal tea, in our portfolio, TGB is leveraging this trend. • Develop alternate channels Consumers are increasingly shopping for even their basic supplies online, and e-commerce has emerged as one of the most important trade channels across developed and emerging markets. At TGB, we recognise the importance of this changing consumption pattern. Therefore, across many markets we are working to build a strong presence in this channel.
10
CORPORATE OVERVIEW 01-48
Invest for Growth • Continue to invest in JVs At TGB, we have partnered with some of the biggest players in the beverages category to deliver products and innovations that delight our consumers. Our strong alliances and partnerships complement our vision of making a lasting difference in tea, coffee and water. We will continue to drive growth momentum through our JVs in India - Tata Starbucks (a JV between TGB and Starbucks Coffee Company) and NourishCo (a JV between TGB and PepsiCo) • Accelerate expansion of our super brand Teapigs into new markets Teapigs, our much loved super brand of tea from the UK, now retails in Australia, USA and Canada. We will focus on expanding Teapigs’ presence across more markets. • Scale up businesses in evolving markets We are committed to pursuing growth opportunities in new and evolving markets with potential. From exploring the vast tea-drinking markets in the Middle East, to building our strength in different categories across markets, we are continuously evaluating new and exciting options for growth.
STATUTORY REPORTS 49-124
Drive Innovation Agenda • Bolster R&D pipeline and launch new product lines with a focus on isation, health & wellness and convenience (new formats) We are challenging and changing the way consumers think about our beverages and how they enjoy them. Our growth will be driven by new products crafted to deliver on consumer needs. isation, health and convenience are key trends for our industry. Consumers want quality products that resonate with their goal to ‘live better’ in keeping with their preferred lifestyle choices. From single estate teas and coffees, to fruit flavoured and infused teas, flavoured coffees, functional water, and new formats of delivery we are committed to delivering enhanced beverage experiences to delight our consumers. • Strengthen innovation and new product development processes Sharp, well defined processes are required for us to innovate quickly, continuously and efficiently. We are continuously reviewing, improving and streamlining our innovation and NPD processes to help deliver and our strategy.
FINANCIAL STATEMENTS 125-220
Organisational Effectiveness • Reinforce organisational capabilities At TGB, our success is driven by ionate people. We are committed to creating a high-performance culture with high levels of engagement. Our goal is an organisation that is diverse, inclusive and global like the communities we serve. With ambitious goals, a unique culture and focused ‘talent’ strategy, we are making TGB ‘the place to be’. • Actively manage commodity costs - strategic buying and blending optimisation A well-thought strategy needs the of robust internal processes to succeed. We continuously refine our supply chain to ensure that we are connected, agile, cost conscious and sustainable. Best-in-class commercial processes and buying strategies are critical for us to be competitive in the market and are therefore an important part of our strategic focus. • Cost management Our global ambitions need to be underlined by a cost conscious mindset. We continue to look for opportunities to optimise costs while maintaining the quality of our products and services.
Our strategy is designed to deliver long-term financial performance and sustained shareholder value. We are committed to growing our revenues while improving profitability and optimising return on investment.
11
Annual Report 2015-16
•
Connect with every sip
Consumer Insights What does it mean to be consumer centric?
The first step to being truly consumer centric is a deep and insightful understanding of consumer needs. At TGB, the Consumer Insights team leads this mandate, interacting with thousands of consumers across the globe annually and helping functions across TGB leverage the power of Consumer Insights. How do you attract the consumers of tomorrow with new products? Will your new advertising campaign convince consumers to buy your products? How will you set your product apart in the cluttered retail environment? Will consumers notice your packaging on the shelves? These are questions the business faces daily and can only be answered by our consumers. How do we ensure that the consumer is represented at the table? At TGB, we do this by bringing the focus back to consumer centricity. At TGB the value of consumer centricity is based on two pillars: 1. The Tata Group’s Consumer Promise - the 3 D’s which help us answer relevant questions and deliver the right products 2. Cultivating and embedding a consumer first mindset, across the business.
The 3D’s
We use the 3D’s – Develop, Deliver and Delight – to generate insights and answer business questions: • We start by developing a deep understanding of the unique needs of our consumer. Annually, the Consumer Insights and marketing teams, speak to over 100,000 customers through multiple media such as digital, telephone, face-to-face etc. The team
12
uses cutting edge technology like Neuro-focus (that measures brain activity) and eye tracking to glean insights. This enables them to get a keen understanding of the consumer’s needs. For example, to attract the consumers of tomorrow, the Eight O’Clock coffee brand realised that consumers had an affinity towards the popular US sitcom F.R.I.E.N.D.S. Building on this insight, we crafted a consumer experience that brought together fans of this star studded sitcom over Eight O’ Clock coffee. Over a million consumers were exposed to this initiative through social media, PR and a pop-up store. • The Consumer Insights team works with teams across the organisation to help deliver pioneering products of outstanding value and quality. For example, our successful super tea project is built on two facts (1) over 50% of consumers in the UK take some form of vitamins and (2) tea is perceived as a healthy beverage. Marrying these two facts together enabled the team to build a powerful insight that subsequently led to the very successful super tea range. These teas have been launched in the UK and won the prestigious ‘Product of the Year’ award. • In today’s ultra-competitive world, our goal as an organisation is to go beyond delivering excellent beverages to delighting consumers at every touchpoint. While developing the new packaging for Tetley, the team discovered that consumers across the world perceived tea to be subtly magical. A cup of tea on a busy day can help one feel refreshed and relaxed. Add friends and conversations to the equation and you are connecting over a freshly brewed cup of tea. We used this insight to design the new Tetley packaging. The new
Tetley logo unit has been re-cast in the form of a smile, conveying just what the brand hopes to achieve - deliver smiles and moments of warmth. We hope this will delight consumers from the time they grab the product off the shelf to that magical moment when they have their first sip.
Embedding a consumer first mindset
The next step in our journey is ensuring that everyone within the organisation wears the consumer’s hat. That we adopt a consumer first mindset, not just within the marketing team, but across the organisation. To enable this, we are doing some things differently: • Partnering with senior leadership to ensure that consumer centricity is one of the five core values at TGB. Core values are the soul of the business, the guiding principles through which we operate. • Leveraging our Business Excellence Model (TBEM) to embed and evaluate our consumer centricity initiatives within TGB. • Creating a Global Insights function that manages research across all key markets. These global champions help functions across TGB collect, analyse and interpret consumer data across multiple touchpoints. “Truly understanding our consumers, their wants and aspirations, their challenges and needs, will define our action plan as a business and our trajectory of success. Consumer centricity is critical to TGB’s growth ambitions and embedding this across the organisation is essential.” says Mr. Garth Viegas, Director, Consumer Insights, TGB.
CORPORATE OVERVIEW 01-48
STATUTORY REPORTS 49-124
FINANCIAL STATEMENTS 125-220
Develop As we set out to achieve our ambitious plans of being the most ired natural beverages company, one thing is quite clear – our consumers will determine how successfully we undertake that journey. Developing a deep understanding of the unique needs of the consumer is really the first step towards serving them well. At TGB, consumer centricity means looking at a need or want through the lens of the consumer rather than the producer. It’s about understanding what problems consumers face in their lives and then providing mutually advantageous solutions. Take for instance Tata Coffee Grand, our foray into the branded instant coffee
segment. With Tata Coffee Grand we developed the country’s first blend of freeze dried and agglomerated coffee, for a ‘best-in-class’ taste experience for the Indian consumer. While in Canada, we introduced the string and tag/ drawstring tea bag with Tetley Signature Collection. This allowed consumers to squeeze out the last drop of flavour, without creating a mess – a key need expressed by consumers.
With the Tata Tea Chakra Gold Hot Tea Shop pack, we invited customers into the process of creating a blend which would best suit their needs. Developing a clear understanding of the diverse needs of our many consumers across the globe ensures that we are focused on giving them what they want.
13
Annual Report 2015-16
•
Connect with every sip
Making the Perfect Cup of Chai Small chai shops with regular consumers crowding around, for their cup of hot tea, is a common sight in most Indian towns, cities and even villages. Spiced with ginger and cardamom, this strong cup of tea is an integral part of the daily routine for many in India’s tea-drinking culture. It is not surprising then that out-of-home tea consumption s for almost 30% volume of the tea category.
For the country’s leading tea brand, Tata Tea, servicing the Hot Tea Shops (HTS) segment is important and Tata Tea Chakra Gold caters to many HTS consumers, with this segment ing for 30% of Chakra Gold’s total sales.
Mastering the art
The HTS customer is the most discerning of tea drinkers. HTS prepare multiple batches of tea per day as compared to household consumers.
30%
HTS segment s for 30% of Chakra Gold’s total sales
Brewing tea here is an art. Unlike the regular boiling method where all constituents are boiled together, in an HTS the water is first boiled and a decoction prepared with it. Then milk is poured in the glass with added decoction and sugar to release the required colour, aroma and aftertaste i.e. bite and strength.
The glass is then topped off with a swirl of decoction, along the rim of the glass that will flow down the sides giving it an almost two-layered look. A typical HTS outlet prepares 700 cups per day with an average of 8-15 cups per batch. Hence, it is imperative for the blend to deliver on its promise of consistent blend quality.
Putting the consumer first
Understanding the exact needs of this consumer segment is therefore critical. To better gauge this segment, multiple consumer connects were made by cross-functional teams consisting of the brand manager, sales manager, quality manager and the blender to understand the key requirements, drivers of preference and reasons for brand loyalty. Invaluable Consumer Insights were gained in these interactions and the blender translated the consumer speak to product quality using our internal tea tasting language ‘Uhuru’ to capture all deliverables of the blend, in detail. Our learnings revealed that key consumer needs of the HTS outlets were consistency, colour of the brew, strength,
14
CORPORATE OVERVIEW 01-48
aftertaste and running colour. Using the above insights, our blending team crafted multiple blends using the best Assam teas. These blends were tested across markets to identify the preferred blend. No blend is perfect till your consumer says so! In a break from tradition, we invited HTS Masters / customers to our tea tasting room in Bengaluru to
STATUTORY REPORTS 49-124
prepare tea on their own in a controlled environment and provide on these blends. The preferred blend was further optimised, using our tea blending expertise based on cues received to create a “wow” experience and achieve consumer delight. The blend was tested extensively across major outlets / markets and validated by the consumer, before we finalised and formulated the fixed recipe.
FINANCIAL STATEMENTS 125-220
A brew with a difference
Tea leaf quality and taste change across seasons due to variations in weather. To deliver a consistent blend across the year, our master blenders usually optimise the recipe by varying composition. For the first time, we arrived at a fixed recipe for the HTS consumer - year round even if it meant increased investment. Happy consumers are good for business. The results speak for themselves. The Q1 2016 volume of the Chakra Gold HTS packs have grown by 8%. A six-month loyalty programme has been kicked-off to on-board 1000 new outlets. In less than two months we were able to recruit 245 outlets, helping us fulfil our quest of keeping the consumer happy!
Consumer Speak “For us what matters is the number of cups I can make with your tea. Even a small variation in the quality of tea leaf impacts this. This new blend is able to meet our expectation and we are confident Tata Tea will give us consistent quality.” Arumugam S, HTS owner, Madurai.
15
Annual Report 2015-16
•
Connect with every sip
A Brew to Say instant coffee in a tea-drinking nation like India and only a couple of well-established brands pop into your mind. This year, one of the big initiatives for us was to disrupt the instant coffee market with a new and product that brings both experience and expertise to the table. TGB collaborated with Tata Coffee and made its foray into the branded instant coffee segment with the launch of Tata Coffee Grand in November 2015. Tata Coffee Grand has been crafted specially keeping in mind the evolving tastes of a growing breed of coffee consumers who seek the café culture coffee experience at home.
The product has been crafted, keeping the Indian coffee consumer in mind. Tata Coffee Grand offers an innovative and differentiated blend of the finest coffee powder and decoction crystals i.e. agglomerated and freeze dried coffee, for a ‘best-in-class’ taste experience.
Breaking new ground
Timing it right
The phenomenal growth of coffee cafés across India was indication that the time was just right to launch a product in the instant coffee category. With Tata Coffee Grand, TGB has set the ball rolling to drive coffee consumption in Indian households. Tata Coffee Grand’s distinct feature of ‘sourced primarily from the plantation’ is a concept which is unique and critical to the coffee segment in India. With this, we promise our consumers a delightful concoction of freshness and quality - a big differentiation in the current market scenario.
16
A gradual shift in consumption from traditional roast and ground (R&G) coffee to the instant version, led us to develop an instant coffee blend. Even in the South Indian markets, where the slow drip of R&G coffee through a steel filter is considered to be the only ‘real’ coffee, instant coffee is breaking new ground. The trend now leans towards the convenience and modernity offered by instant coffee and is sustained by an increase in household incomes. The instant coffee market s for Rs.1300 cr of the total packaged coffee market worth Rs. 2500 cr. With double digit* annual growth, there is enough room for new players to enter the instant coffee landscape.
*Source: Instant Coffee, value growth MAT March ‘16 as per AC Nielsen.
In India, TGB is a market leader in tea, in of volume and value, since 2008 and want to replicate this success in our coffee portfolio too. Our expertise and partnership with Tata Coffee, the provider of blends to some of the leading brands globally - Tata Starbucks stores in India, Eight O’ Clock in the US and Grand Coffee in Russia - we believe will help us reach this goal very soon. The instant coffee market is a competitive and challenging one which requires a strong focus on the overall brand experience presented to the consumer, in addition to a blend which perfectly balances all the product attributes.
So how did we stand out in this competitive market?
Our approach to this challenge is succinctly put by Mr. Sushant Dash, Regional President, India, at TGB - “We need to stand out and do things differently. We need to use lesser resources to get better results.” This thought translates into Tata Coffee Grand’s marketing mix which is both different and disruptive. “Besides the unique experience that we offer through Tata Coffee Grand taste, the packaging of our product breaks all category codes,”
CORPORATE OVERVIEW 01-48
DOUBLE DIGIT GROWTH
says Mr. Dash. Instead of brown, green and red, Grand’s blue packaging is clutter breaking and has images which clearly convey that the produce is fresh from the plantation. This approach has been extended to the advertising and brand communication too. The ad has at its centre a hip, South Indian granny dressed in rapper style hip-hop gear, rapping a song that tells consumers what it takes to make truly good coffee. The protagonist granny is anything but traditional. She has swag, an opinion on the latest happenings and is a tad mischievous. An active member of the Twitteratti she raps a viewpoint on everything; from the Oscars to the budget and any other topical issues. The granny’s rap is wooing consumers with her wisdom and new-age style.
Hitting the mark
Tata Coffee Grand is targeted at the young and young at heart, who are always curious about the latest in the food and beverages category. While this group of consumers want something and different, it wouldn’t be an easy shift for them to break-away from what they were originally consuming until there is enough incentive i.e. the new offering has to be superior. “You have to find the need gap which can be used to your unique advantage to build the product. Hence, TGB aims
FINANCIAL STATEMENTS 125-220
STATUTORY REPORTS 49-124
With double digit* annual growth, there is enough room for new players to enter the coffee landscape
1,300 CR
Rs.
The Instant Coffee market s for Rs. 1300 cr of the total packet coffee market worth Rs. 2500 cr
Creating a unique blend at Tata Coffee
Challenge
“For any company, one of the biggest challenges is to discover the need gap in consumer demand and fill it with a disruptive product. For us, an impending challenge was to provide customised blends to our prospective consumers. For instance, in South India, people prefer their coffee with chicory. In the North, however, people don’t want their coffee to be bitter. In order to overcome such challenges, we try to find gaps in taste through research and analysis.
Solution
An established market research firm, helped us to assess the potential of such a product. Identifying the right blend for the target consumer took a lot of effort and time. Our experts created 29 different blends for testing and selected one unique blend after doing a systematic study on consumer behaviour. The challenge that followed was to manufacture the product with consistent quality and to control operational efficiencies while manufacturing and blending the constituents.” - Mr. T Radhakrishnan, Executive Operations, Tata Coffee.
to offer consumers what they haven’t experienced yet.” adds Mr. Dash. Another interesting launch initiative was to sell the product on Amazon India as an exclusive offer for two weeks before it hit retail shelves. The result - Tata Coffee Grand entered the best sellers list. Consumer was very positive and gave us the confidence to journey on. Where to launch a product is as critical as when to launch it. South India is a mature market for coffee, and TGB expects that 70-80% of volume sales will originate here.
Way forward
Our future plans include building a complete coffee portfolio after evaluating and adding other offerings. We also plan to commence a series of ground-level activities in sampling and experiential marketing to promote Tata Coffee Grand. Growing within a traditional market, combating established competitors, winning loyal consumers with new offerings - these challenges and more lie before us. But in daring and doing things differently while meeting unique consumer needs, we are ready to face these challenges.
17
Annual Report 2015-16
•
Connect with every sip
Drawing out Flavour and Fun Tea drinking is straightforward: steep and sip. But for an avid tea lover, a richly infused sip brings a smile to their day and the flavour of tea becomes key to the tea-drinking experience.
2
70%
The brand received over 2 million impressions from promotional ads that ran for this campaign from October to December 2015
Contributed to 70% of Tetley specialty baseline growth
The need to squeeze more flavour from every tea bag, minus the mess was expressed by 52% of Canadian consumers who were interested in a tea bag with a string and tag. Consumers were also looking for more variety and taste. With ‘isation’ seeing an upward trend, Tetley leveraged the opportunity to grow share of its specialty tea, increase penetration, and ise the brand with the all new Tetley Signature Collection.
18
MN
Shaking up the specialty space
This contemporary range of teas was created to reinforce Tetley’s leadership position in specialty teas in Canada and to provide consumers with a string & tag/drawstring tea bag, which is what more than half of specialty tea consumers indicated was important. The new drawstring tea bag takes the mess out of steeping with its innovative design and 3 simple steps which allows
consumers to squeeze out all the flavour, drip-free. It also helps to maximise the flavours from your tea bag with flavours being squeezed into your tea cup and not left behind in your tea bag. We recognised that the new tea bag innovation would require education on how to use it, as it is not intuitive. So, we created a tactical ‘how to’ video and placed it on our Tetley.ca homepage. A TV commercial as well demonstrated
CORPORATE OVERVIEW 01-48
STATUTORY REPORTS 49-124
FINANCIAL STATEMENTS 125-220
Spotted on social media “Love these new teas!! Received a sample of ‘Mint to Be’ and loved it, bought all 4 flavours.” “The newly designed tea bags are a perfect solution to the problem and I just thought to let you know that I'm thankful. Also kudos to the design engineers who thought of this and came up with the idea.”
the tea bag usage very clearly. In all of our consumer communication a strong visual of how to use the tea bag is consistently evident.
These results are ed by very encouraging consumer testimonials and a positive contribution to the growth of Tetley’s baseline sales.
At TGB, listening to our consumers and developing products based on their needs is what drives us. Research showed that specialty tea drinkers enjoyed purchasing a variety of different flavours and the current offering in the Canadian market needed a boost. So, our Master Tea Taster, Mr. Mark Donovan developed 4 fun and flavourful signature blends to give consumers an eclectic mix of flavours with intriguing names to boot - ‘Keep Calm and Sip On’ (Camomile, Spearmint & Orange), ‘Mint to Be’ (Peppermint, Spearmint & Apple Mint), ‘High Tea’ (Black Tea with Vanilla) and ‘Citrus Kiss’ (Green Tea with Lemon & Grapefruit).
An exciting line of teas called for an exciting launch to garner visibility amongst consumers. But how do you increase awareness of a new technology in a category that hasn’t changed in the last 100 years? And, how do you reach an audience that is using technology to block traditional messaging? Research found that millennial audiences want a brand to entertain them; and Tetley wanted to be seen as an innovative brand, not just for its new product innovation, but also in the way they engage with their audience.
These popular flavours with a twist that infuse fun in every sip, have received great consumer response! • Innovative drawstring tea bag (78% of consumers agree). • Has exciting flavours (73% of consumers agree). • Personality/fun flavours (74% of consumers agree). (Source: Nielsen Bases Research, April 2014)
Diving into digital
Enter, Ms Labelled, Season 2 - a scripted series on YouTube and on a popular female-focused website Slice.ca. The series is set in the fast-paced world of a fashion magazine and select episodes were woven around the Signature Collection. The drawstring tea bags were cleverly integrated into the story line via a Drawstring Designer Challenge that required designers to create a piece of fashion using drawstrings. Also, for the first time in broadcast history, the web series was integrated into television and played between ‘Pitch
Perfect,’ a prime time movie and TV show featured on the Slice network. The series also travelled onto social platforms and TGB Canada was able to leverage this content and drive awareness with great consumer receptivity. • The brand received over 2 million impressions from promotional ads that ran for this campaign from October to December 2015. • 25,000 unique posts were created leading to 40,000 interactions. • In just 3 months, the show boasted almost 450,000 views on YouTube and reached over half a million people through television!
The outcome
The numbers and consumer speak for themselves: • Contributed to 70% of Tetley specialty baseline growth. • Achieved 1.2% Household Penetration (HHPEN), highest gain out of all specialty tea brands. • Gained loyalty in the Tetley Herbal segment (from 24.6% - 27.0%). • 90% of consumers liked the product after trying a sample. • 84% would recommend the product to a friend.
19
Deliver
Annual Report 2015-16
•
Connect with every sip
Delivering pioneering products of outstanding quality and value is the second step to being truly consumer centric. Having developed a good understanding of consumers’ needs, our next task is to deliver to consumers exactly what they need. For our consumers to truly cherish our products, we have to offer outstanding quality and value. Quality is non-negotiable and value always on top of the consumer’s mind. At TGB, our understanding of developing exactly what the consumer needs is wide-ranging and comprehensive. Across the world our consumers want the products they use to be sustainably sourced and produced. They want to ensure that the communities that produce
their daily cup of tea and coffee are fairly and justly treated. We understand this need, and it wholeheartedly by partnering with established organisations like Ethical Tea Partnership, Rainforest Alliance, amongst others that are committed to conserving biodiversity and ensuring sustainable livelihoods.
We are also devoted to delivering products that meet growing consumer needs. Health and wellness has been a growing trend amongst our consumers. In response, we launched Tetley Super Teas, the first functional range of teas in the UK with approved health benefits. The teas are fortified with different vitamins and minerals to benefit heart health, immune system, energy levels and hair and skin. Our endeavour to develop products of enduring quality and value also echo in our efforts with our JVs – NourishCo and Tata Starbucks.
20
CORPORATE OVERVIEW 01-48
STATUTORY REPORTS 49-124
FINANCIAL STATEMENTS 125-220
Building Sustainability into our Products Sustainable products are good for people, good for the planet and also good for business. Consumers today are increasingly aware and interested in the sustainability of the products they purchase. Has it been sourced, manufactured and packaged responsibly, is it a healthy product, is it eco-friendly? These are some of the questions that today’s consumers ask. At TGB, we believe that integrating sustainability into our products and in the way we do business is the right thing to do.
600+
50%+
FACTORIES
Currently, more than 50% of Tetley tea worldwide is Rainforest Alliance Certified™
The Trustea programme in India is targeting 500 million kg of tea from 600+ factories
As a recent World Bank Report revealed, the world today is showing improvement on many developmental indicators, but a lot of work remains which is encapsulated in the global Sustainable Development Goals (SDGs) launched by the UN in 2015. TGB’s sustainability initiatives align with many of the SDGs - sustainable production and consumption, providing productive employment, ensuring healthy lives, managing climate change and achieving gender equality. The global market no longer operates in silos, it is a networked structure, which means the way products are produced and consumed has implications across the world.
Sourcing it right
It starts from the source. Sustainable sourcing forms a key part of TGB’s strategy. In India, the Trustea initiative is a good example of this. TGB is one of the founding of the Trustea initiative in India, a multi-stakeholder initiative led by the Tea Board of India, to sustainably transform the Indian tea industry. The 5-year programme targets 500 million kg of tea from 600+ factories, and hopes to have a positive impact on the livelihoods of 5,00,000 tea plantation workers and 40,000 smallholders.
The Trustea initiative aims to protect the ecosystem while improving the quality of life for small tea growers and workers. This means that a Trustea certification for an estate certifies that production and manufacturing is being done according to sustainable principles. Globally, TGB is a founding member of the Ethical Tea Partnership (ETP), a noncommercial partnership of tea companies committed to improving the lives of tea workers and their environment, to create a thriving tea industry that is socially just and environmentally sustainable.
21
Annual Report 2015-16
•
Connect with every sip
TGB’s collaboration with Rainforest Alliance is another big effort in sustainable sourcing. Rainforest Alliance is an international non-profit organisation that works to conserve biodiversity and ensure sustainable livelihoods. It enables us to tackle specific sustainability issues within the tea sector. We are committed to sourcing 100% of our black teas from Rainforest Alliance Certified™ farms for all our Tetley-branded teas in Today, we monitor our EMEA (Europe, the Middle East carbon footprint in more and Africa) and CAA (Canada, than 70 different sites Australia and America) regions. in Asia, Africa, Europe, Currently, more than 50% of North America and Australia Tetley tea worldwide is Rainforest Alliance Certified™.
70+
Another TGB funded project focuses on training small tea growers in Assam, with the of ETP and Tea Research Association. As small growers produce around 40% of the total green leaves in India, sound training is required for better production of quality tea. The programme aims to improve yield and quality with better crop management practices. Around 2000 small growers are being trained initially in a special ‘cluster training programme’ which will continue till later this year.
Protecting the environment
Climate change is a reality and the categories we are present in – tea, coffee and water are all heavily influenced by climate change patterns. Our climate change strategy focuses on four key areas - sustainable agriculture, sustainable forestry, renewable energy and energy efficiency. TGB featured again on the Climate Disclosure Leadership Index (CDLI) in India. We have earned our position on the index by disclosing high quality carbon emissions and energy data through Carbon Disclosure Project’s (CDP’s) climate change programme with a score of 99 out of 100. Today, we monitor our carbon footprint in more than 70 different sites in Asia, Africa, Europe, North America and Australia.
22
The CDLI was developed by CDP, a global sustainability organisation that reports on behalf of 722 investors representing $87 trillion in assets. TGB is also listed on the S&P BSE Carbonex in India. It is a first-of-its-kind index that takes a strategic view of organisational commitment to climate change mitigation. Recently, TGB commissioned a study on the impact of climate change in the tea growing regions of Assam. The report aims at identifying those areas that will continue to remain suitable for tea cultivation, those areas that will require adaptation and those that may become unsuitable and hence, may need to switch from tea to other crops. TGB is also making good progress on Project S-PPF (Sustainable Plant Protection Formulations). This is an initiative between Tata Chemicals, Rallis, TGB and associate plantation companies KDHP in Munnar and APPL in Assam, to develop ecological solutions
for plant protection in tea. In a unique and fast-track collaborative effort, 20 multidisciplinary scientists from the Tata group have studied the biology and ecology of tea pests, identified alternative practices for their management, and conducted over 20 field trials on Non-Pesticidal Management (NPM) of significant tea pests such as Tea Mosquito Bug (Helopeltis Theivora), Red Spider Mites, Thrips, Blister blight, Tea Looper Caterpillar and Termites. The Indian tea industry loses 15-30% of its crops due to pests, diseases and weeds. The multi-locational field trials of plant extracts developed have shown initial success in different agro-climatic zones, especially towards controlling pest incidents of Red Spider Mites.
CORPORATE OVERVIEW 01-48
STATUTORY REPORTS 49-124
FINANCIAL STATEMENTS 125-220
Improving lives
Over 3 million workers are employed in tea estates across India alone. So, the industry s a very large number of people and livelihoods. Consumers increasingly want to be assured that the people growing their tea are well cared for and live a life of dignity. Improving the quality of life in the communities that we serve is a key part of TGB’s purpose. We are committed to the communities where we operate, and are proud to be a part of them. TGB is one of the funders of an ambitious project run by UNICEF and ETP, to improve opportunities for tens of thousands of children in the tea growing communities in Assam and reduce their vulnerability to trafficking and abuse. The project works with stakeholders ranging from community , panchayats, police force, health officers, district and state level governments. It aims to equip more than 25,000 girls with knowledge and life skills that will help them secure a better future and reduce their vulnerability to exploitation. It will give more than 10,000 community the knowledge and training to protect children from all forms of violence, abuse and exploitation as well as make families aware of children’s rights and the they can call on. We believe that the right to health is a fundamental part of human rights and of a life led with dignity. So, we have invested in hospitals in Munnar and Chubwa that provide inclusive and affordable healthcare facilities to about 100,000 people annually from local communities.
Breaking barriers
consumers can talk directly with the people who grow, harvest and produce their favourite cuppa. The thought behind FFH was to enable connection through conversation, and it does just that. With over 700,000 consumers connected on a single platform, this
digital campaign has taken on a life of its own and become a favourite - from more than a page to a platform to catch up on life. Conversations on the FFH page range from providing valuable insights into tea production and certification to sharing experiences on the farm and family life.
700,000+ CONSUMERS
With over 700,000 consumers connected on a single platform, this FFH digital campaign has taken on a life of its own and become a favourite
Consumers are increasingly interested in how products they buy are being produced or grown. Perhaps as a result of the fast paced lifestyle most of us lead, there is a yearning to connect back with nature, the ecosystem, growing practices and the very source of our daily food and beverages. TGB’s innovative digital initiative - Farmers First Hand (FFH) aims to provide that connect. FFH is an innovative social media initiative using Facebook, where
23
Annual Report 2015-16
•
Connect with every sip
Making Healthy Fun
The ‘Gas Minus Energy Plus’ drink, Tata Gluco Plus, has carved a niche for itself in the nutrient water segment. To revitalise the brand and ensure that its inherent purpose reaches the consumer, we revamped the brand’s identity last year. Real instant energy
Tata Gluco Plus, a non-carbonated energy drink from the house of NourishCo (a t venture between Tata Global Beverages Limited and PepsiCo India) was repositioned in the hydration market with a new look and a new voice. The
24
new visual design and communication proposition have lent a fun and energetic vibe to the drink. Playful imagery aided by colourful illustrations has been built into the communication to enhance the overall look and feel of the drink.
This restage was effective in reinforcing the energy credentials of Tata Gluco Plus and its ability to deliver on the need for a tasty energy alternative to carbonated soft drinks.
CORPORATE OVERVIEW 01-48
STATUTORY REPORTS 49-124
FINANCIAL STATEMENTS 125-220
Consumer Speak on Social Media
200 MN SERVINGS
Tata Gluco Plus is a young, four-year-old brand which has energised customers with more than 200 million servings
“I drink it at least once a day for instant energy! Thanks to Tata Gluco Plus, my life is energetic every day!” RAUNAK KUMAR
A significant part of the Indian population is anaemic due to Iron deficiency. Tata Gluco Plus provides instant energy through glucose, salt replenishment and iron fortification
“Really this is the best for summer. This drink is energetic, good for health and not only taste. The lime flavour is very nice.” ARUN ARUMUNGAM
“Much better than any cold drink. A healthy drink with no side effects, gives energy and keeps the body cool.” ADITHYA DHANRAJ
The genesis of this product began with identifying a need gap in the hot tropical Indian market. With a large number of people working outdoors, there was a latent need for a water-based drink that goes beyond being a mere thirstquencher. Until 2012, this was a huge unmet need in the mass segment which was looking for something delightfully refreshing coupled with convenience and affordability.
Big benefits, small package
An on-the-go, non-carbonated, re-hydration beverage, Tata Gluco Plus packs a punch in a convenient, easyto-use 200 ml plastic cup. It contains instantly energising glucose and minerals such as electrolytes and iron that recharge. A first of its kind, innovative cup format ensures product quality at a convenient price point, without any compromise on taste or flavour.
Outcome
The brand has doubled its volume following the restage in 2015. With more than 200 million servings to customers the current overall volume growth is 84%. (Source: Volume Market Share of LRB Ex. Water as per AC Nielsen March ‘16)
With Tata Gluco Plus, our main focus was to deliver a quality product in the health and wellness segment, offering a healthy drink at an affordable price. Based on consumer we delivered well on that front.
25
Brewing Connections over Coffee
Starbucks prides itself in creating a consistent, welcoming environment so customers, both new and regular, all over the world can enjoy their cup of coffee, exactly as they want it. Three primary components which Starbucks defines as the foundation of the Starbucks Experience are ‘our products, our places and our people’. Customers come for coffee, stay for the inviting warmth and return for the human connection. It is this commitment and connection that Starbucks is known for globally.
In October 2012, the Starbucks Experience entered India through Tata Starbucks Private Limited, a 50/50 t venture between Starbucks Coffee Company and Tata Global Beverages Limited. Since then, this partnership has grown to over 80 Starbucks stores across six cities. Consumers in India
26
have embraced the elevated coffee house experience for its highest quality Arabica coffee, delicious handcrafted Starbucks beverages and locally-relevant food in an unparalleled store environment driven by ionate and knowledgeable partners - our employees.
A fitting tribute
To mark the one year anniversary of Tata Starbucks Private Limited in India, the Company launched a special India sourced coffee, aptly named India Estates Blend - a unique whole bean offering to Starbucks consumers across India.
CORPORATE OVERVIEW 01-48
India Estates Blend captures the essence and rich heritage of the Indian coffee history and draws inspiration from the finest Arabica beans carefully selected from Tata Coffee’s estates spread across Coorg and Chikkamagaluru, the birth place of coffee in India. It is the perfect example of the strong synergy between Starbucks and Tata Coffee, and their commitment to develop and improve the profile of Indian-grown Arabica coffees. The country-specific blend has been named to represent the origin of the coffee and the packaging has been aptly designed to reflect the nuances of traditional Indian design. This debut of Indian coffee in the Starbucks world is a balanced and medium-bodied roast with layers of chocolate and herbal flavour notes. The product has since been extended across various markets in China and Asia Pacific in 2015 and in the USA through online sales. This launch is a testimony to our pursuit of the finest coffee with a rich heritage to enhance the consumer experience which is core to who we are.
Innovating for the Indian palate
At Tata Starbucks, beverage innovation is centred round the consumer’s need with the objective of creating a seasonally relevant, emotionally evocative beverage which has a story and cultural relevance. Alphonso Mango Frappuccino is inspired by mangoes - the king of fruits, loved by Indian consumers. This coffee-free, fruit based Frappuccino is made using pure Alphonso Mango puree blended with milk, ice and unique Starbucks Frappuccino ingredients to deliver the authentic taste of rich Alphonso Mangoes in a cup. Launched in the summer of 2015, this blended beverage is a seasonal offering crafted especially for the Indian palate. The success of this summer favourite ensured a return in 2016 as well. This offering alone contributed to 10%+ beverage volume and became the second
STATUTORY REPORTS 49-124
FINANCIAL STATEMENTS 125-220
Raghu Ram & Rajiv Lakshman
10%+
Alphonso Mango alone contributed to 10%+ beverage volume and became the second highest selling Frappuccino during the launch
Sonakshi Sinha
highest selling Frappuccino during the launch. The product was so successful that some of the China Asia Pacific markets have adapted the same concept for their respective markets this financial year.
Creating the ‘Fourth Place’
The new age millennial is a huge part of Tata Starbucks’ customer base. To engage this segment, Tata Starbucks required a campaign which would appeal to the consumer who is always on the move. So, Tata Starbucks went beyond stores to extend the Starbucks Experience to the digital space as well. Digital, for the Company, is the ‘fourth place’ after home, work and our coffee house. We build online communities through storytelling and two-way dialogue using Facebook, Twitter, e-mailers, SMS and microsites for specific campaigns with interactive content. The Company has been recognised for its recent digital campaigns to create meaningful connections that delight our consumers. Tata Starbucks also launched the innovative Sip Face Challenge last summer with social influencers and bloggers, to encourage the digital audience to indulge in the ‘Frappuccino spirit’. World No. 1 Bton player, Saina Nehwal changed her profile picture
on Facebook, posing with a bton racket and the Mango Frappuccino. This post received over 200,000 ‘likes’. Other youth influencers on Indian television like Raghu Ram and Rajiv Lakshman, actress Sonakshi Sinha and fashion & lifestyle influencer Miss Malini also created Sip Face videos, which garnered great engagement on social channels.
The results
The campaign generated an overwhelming response. Some of the key metrics include the 2015 Summer Best Digital Experiential Marketing Award in Starbucks Asia Pacific and over 100,000 incremental Facebook fans, 5300+ incremental Twitter followers, 59 online media releases and 57 million social media impressions. As on June 2016, Starbucks India Facebook page had 933,711 number of fans and 61,631 followers of Twitter. The campaign also witnessed a great partner-customer connect in-stores. It gave consumers the chance to rediscover the thrill of summer and adventure while creating personal moments of connection.
27
Annual Report 2015-16
•
Connect with every sip
Super Teas to Supercharge your Day The world is abuzz with the ‘healthy’ trend coupled with the need for ‘convenience’. The prominent insight underpinning this is accessibility to ways of maintaining health and fitness in the midst of a stressful modern lifestyle. This has led to the health and wellness segment clocking substantial growth in the food and beverages category, with the rise of products promising convenient access to good health and communicating clear and specific benefits.
28% Y-O-Y
The momentum behind Super Green Tea has enabled Tetley in UK to grow value share by 28% year-on-year
25%
OF TOTAL TETLEY GREEN TEA SALES In the last 12 months, Super Green Tea equates to 25% of our total Tetley Green value sales
28
The vitamin market in UK is growing rapidly with 1 in 3 consumers taking vitamin supplements every day, a practice that many find expensive and inconvenient. Consumers want to enjoy their healthy food and beverages without compromising on taste while achieving their health goals. Tea has benefited from its positive health association, especially green teas and fruitbased and herbal teas; and as a significant player in the tea industry, we responded to this growing trend. We sharply focused on the overall well-being that our products provided by launching a ground-breaking, innovative line - Tetley Super Teas.
CORPORATE OVERVIEW 01-48
STATUTORY REPORTS 49-124
The right mix
have been turning away from tea. To further drive penetration, more intriguing flavour combinations and relevant benefits to the younger consumer were made available this year, relating to heart health, mind, detox and beauty.
Tetley Super Teas is the first functional range of teas in the UK with approved health benefits. The teas are fortified with different vitamins and minerals to benefit heart health, immune system, energy levels and hair and skin. The main challenge was to ensure that the vitamins could withstand the hot brewed process and were evenly distributed in the product without affecting the taste. We formulated the products with care and redefined the manufacturing process to ensure that every single tea bag had the right amount of vitamins based on recommended serving. The range was first introduced with four Super Green Tea variations. Super Green Tea Immune containing Vitamin C to boost the immune system was launched in two delicious flavours - Tropical and Lemon & Honey. To reduce tiredness, Super Green Tea Boost with added Vitamin B6 was brought into the market with Berry Burst and Lime flavours. In addition to the vitamin enhancement, the new range delivered on taste too.
The wide range of benefits offered by this range now gives consumers an added reason to drink green tea. The functional benefits have appealed to shoppers and repeat rates of purchase have been high. Nearly 28% of buyers are completely new to tea, thereby growing the category and reinvigorating the tea market as a whole. 25% of our total Tetley Green value sales and the line-up has propelled Tetley Green tea to the No. 2 spot making Tetley the fastest growing green tea brand in the UK.
Capturing the market
Building on the huge success of Super Green Tea, the team followed it up with another exciting launch - Tetley Super Fruits. These fruity infusions in Immune and Boost variants, met with good market response. Lemon & Ginger and Peach & Orange flavours constitute Tetley Super Fruits Immune with added Vitamin C while Tetley Super Fruits Boost with added Vitamin B6 come in Cranberry & Elderberry and Blueberry & Raspberry flavours. With more than a quarter of fruit and herbal drinks bought for health reasons there is a strong market opportunity for these new products. Unlike many fruit and herbal drinks, Tetley Super Fruits are made from natural flavours delivering a superior taste which scored highly in taste tests.
Tetley Super Green Tea soon became a hit! The taste, combined with functional benefits, has been drawing in consumers making Super Green the No. 1 NPD (New Product Developed) in the UK. In the last 12 months, Super Green Tea equates to
FINANCIAL STATEMENTS 125-220
The focus on healthier lifestyles has created a very positive market for this range. The momentum behind Super Green Tea has enabled Tetley in UK to grow value share by 28% year-on-year. With the Boost and Immune variants doing exceptionally well, it was important to extend the range to include other popular health benefits which are appealing to younger consumers who
The ‘super’ concept is being rolled out in other geographies and as a company we are pushing boundaries in the area of health with exciting innovations in the pipeline.
The outcome
The superior taste of the natural flavours used has been rewarded with a 2015 Great Taste Award for the Lime variant of Tetley Super Green Tea Boost. The Great Taste Awards is one of the world’s largest and most trusted food and drink awards where products are assessed on taste alone, by a large of food experts, top chefs, buyers, retailers and food writers. The recognition reaffirmed that Tetley has yet again delivered on the ability to provide a good quality cuppa, suited to a variety of tastes. Tetley Super Green Tea range also won the coveted 2016 Product of The Year, the largest award for product innovation voted for by consumers. Only 40 products win per year, with over 11,500 households participating in the vote. Super Green has now achieved 3.6% value share of the total green market in UK and is bigger than main competitors. We have sold over 1.7 million packs of Super Teas since the launch in early 2015, achieving £2 million retail value and securing strong distribution through this unique proposition. Being healthy never tasted so good!
29
Delight
Annual Report 2015-16
Delight, the third D of our consumer promise, is all about putting a big smile on the consumer’s face. Every brand we market has many touchpoints with consumers – the packaging and advertising of our products, the on-ground activations and promotions, our people who interact with consumers, and our website and mobile applications. We have the opportunity to delight the consumer at each of these touchpoints.
For instance Gaon Chalo, our effort in last mile distribution in rural Indian villages, is all about ensuring that we create the networks that allow us to serve consumers in far-flung geographies. While Eight O’ Clock coffee’s partnership with Warner Bros, in the US, to commemorate the 20th anniversary of the star-studded sitcom F.R.I.E.N.D.S. was all about creating an on-ground experience around coffee with a strong cultural and emotional tone. In the Middle East we are attempting to delight consumers by weaving our brand story into the local culture. And in Canada we invited consumers to select a Tetley ‘pink pack’ to Canadian Breast Cancer Foundation. Serving up consumer delight is about ensuring that at every touchpoint we produce experiences that reiterate our brand values, create an emotional resonance with consumers and ultimately lead to brand loyalty.
30
•
Connect with every sip
CORPORATE OVERVIEW 01-48
STATUTORY REPORTS 49-124
FINANCIAL STATEMENTS 125-220
Reaching the Rural Indian Consumer Close to 70% of India’s population resides in villages. This large rural market presents great opportunity for growth. And while everyone talks about the sizeable opportunity lying at the bottom of the pyramid, very few have gone down that path and succeeded.
26% OF THE POPULATION Serving the rural consumer with our brands and products presented many challenges. There existed no effective last mile distribution network that would ensure our products reach the deepest and farthest corners of this large subcontinent. Building awareness of our offerings was another concern. A huge number of villages in India are ‘media dark’ (very little media reach). There is no reliable electricity source and therefore
limited access to TV. Literacy levels are low, ruling out the print medium. Responding to the challenge for an effective distribution network, the ‘Gaon Chalo’ model, was born. The programme is our effort in last mile rural distribution. While tapping unreached rural markets, the programme also provides a means of sustainable livelihood to women, youth and small entrepreneurs, who us as
TV barely reaches 26% of the population in UP, the lowest in the country. This statistic is further endangered by the frequent power cuts which last for 12-16 hours a day
channel partners. This programme, run through NGOs, is present in more than 19 Indian states and benefits a number of women and youth.
31
Annual Report 2015-16
•
Connect with every sip
The strength of Gaon Chalo lies in understanding rural as it exists - identifying unique rural channel partners, leveraging their strengths to design a non-traditional, yet effective business model, while helping create a culture of entrepreneurship and self-sufficiency.
19%
Our next challenge was creating awareness around our offerings. We needed to craft a customised marketing strategy for the rural consumer, leveraging the media they use most. Uttar Pradesh (UP) was the market chosen for this initiative. The first step in solving this challenge was identifying the medium with the most reach. With higher reach than TV, the mobile phone emerged as the most cost-effective medium in rural UP. TV barely reaches 26% of the population in UP, the lowest in the country. This statistic is further endangered by frequent power cuts which last for 12-16 hours a day. Consequently, the mobile phone emerged as a medium of empowerment providing a window to the outside world, especially for women.
Campaign with a cause
Consumers in rural UP were hungry for entertainment. This presented an opportunity to entertain and empower
IN RURAL INDIA, PEOPLE ADOPT A SMART MONEYSAVING PRACTICE: INSTEAD OF SPENDING PHONE CREDIT ON ACTUAL CALLS,THEY GIVE A MISSED CALL PROMPTING THE OTHER PERSON TO CALL BACK.
32
Sales shot up by 19% in the campaign markets versus a mere 2% in the whole state of UP
all at once. The Gaon Chalo Mobile Activation campaign was thus devised. In rural India, people adopt a smart money-saving practice - instead of spending phone credit on actual calls, they give a missed call prompting the other person to call back. The Gaon Chalo Mobile Activation platform leveraged this very insight. The idea was simple, effective and customised to the rural audience. Consumers would give a missed call to an d toll-free number, and then receive a free call back. The return call would offer Bollywood songs interspersed with brand messaging, thus raising awareness of our products. This mobile offer was publicised through ments painted on walls. At TGB, we went a step ahead. We also used this opportunity to raise awareness on relevant social issues. The social content dispersed through the platform covered women’s issues like female foeticide, dowry and eve-teasing in a manner that was relatable. The aim with this approach was to inform and thereby empower women to make a difference in their own lives.
Some of our earlier initiatives and campaigns assisted in driving the objectives of the Gaon Chalo Mobile Activation campaign. We used the vast repository of over 8 lakh issues amassed during the “Power of 49” campaign to zero in on the issues and concerns of people at the district level in rural UP.
CORPORATE OVERVIEW 01-48
An inference made from the results was that locals were closely impacted by the issues at a micro-level as opposed to people in the urban areas who were mostly affected by macro issues. A good example of this is corruption versus black marketing. People in villages are adversely affected on a daily basis by black marketing, a micro-level issue. Thus, the social evils of black marketing along with other such pertinent concerns formed an important part of the free mobile content. Our leading social awareness platform Tata Tea ‘Jaago Re’, was also re-crafted to
STATUTORY REPORTS 49-124
better suit the rural audience. We shifted the focus from ‘National interest’ to ‘Neighbourhood upliftment’ by weaving micro issues into campaign content. The introduction and discussion of social content in this manner helped sensitise rural audiences in a subtle and engaging way. The campaign positioned itself as a good mix of social education and entertainment - it was social edutainment at its best.
FINANCIAL STATEMENTS 125-220
Our leading brand Tata Tea Agni was enlisted for the role. We personified the brand through the character of Agni, the torchbearer in solving issues. The ‘Jaago Re’ campaign was used as a launch-pad to position Tata Tea Agni as a catalyst who had the answers to drive social change. Agni was inspirational in her delivery of powerful and effective solutions for issues, in true ‘Jaago Re’ style. All of this helped awaken people’s conscience in small but important ways.
It was also important for the campaign to have a character, a voice, to effectively connect and convey the content.
Consumer Speak:
Outcome
“The entire content is heart touching. When companies , we expect them to promote their products. What I liked here, was the part where they talked about people wanting to know the gender of the baby during pregnancy. This is something which should be abolished from our system. This tradition has been there for too long a time. ”
The campaign achieved all that it set out to do and then some more: • Sales shot up by 19% in the campaign markets versus a mere 2% in the whole state of UP
-Mohan, Allahabad.
• Brand consideration for Tata Tea Agni went up by 16% and brand imagery by 19% in just 3 months (Source: Millward Brown) • Unique Reach by the media was 6 times the set target (Source: Own mobile data backend) • Consumers spent 9 minutes engaging with the campaign content versus the benchmark of 90 seconds (Source: Own mobile data backend)
This year, Gaon Chalo Mobile Activation campaign was recognised and awarded for its impact and reach with the EMVIE Gold for Best Media Strategy Consumer Goods, Ad Club Big Bang Awards and the Tata Innovista (Global & Regional) Awards
• Social benefits accrued to the Gaon Chalo campaign by way of increased sales was translated into increased income for the last mile sales representatives and also helped generate additional employment in villages through NGOs
What led to the success of this campaign?
“Keen insight into the lives of rural consumers was the defining factor for success.” says Ms. Sonia Serrao, Deputy General Manager, Media & Marketing Procurement, TGB. “The campaign was crafted by keeping the rural consumer at the very centre. The content they like, the media they subscribe to and the issues that concern them formed the building blocks for the campaign. We delivered something that not just built brand awareness and boosted sales but went a step ahead and started a conversation on social issues close to their heart. We delighted our consumer by providing a novel experience, through an unexpected touchpoint.”
33
Annual Report 2015-16
Bringing consumer centricity to the heartlands of India
Our sales force is essential in delivering our promise of consumer centricity to the heartlands of India, challenged by limited media access and poor connectivity in these areas. From understanding consumer needs to servicing rural stockists and encouraging
•
Connect with every sip
consumer trials, our sales force is critical in making the last mile connect truly effective. Gaon Chalo was conceived as a rural penetration channel as well as an opportunity for inclusive growth. Rural entrepreneurs in our Gaon Chalo initiative, serve as our de-facto sales force.
Neeraj Verma, a rural distributor from the Barabanki district of UP has been associated with Gaon Chalo for a decade now. During this time, he has grown significantly within the Gaon Chalo hierarchy and currently manages the Barabanki district (UP). A critical link between TGB and the rural stockists, Neeraj describes how we are slowly but surely building an effective network to serve rural India.
What work does your job entail on a day-to-day basis? I am responsible for two District Co-ordinators (DC), who manage the Barabanki district. My job is to supervise and fulfil requests that come in from the rural areas through my team. My team is responsible for ensuring that TGB products are transported to remote areas in good condition and in a timely manner. On a day-to-day basis I monitor the stock in my district, process requests and manage the chain of money/credit. Every day, I try and visit a market with a team member to ensure that rural stockists, who receive our stock at their doorstep for sales to micro interior village shops and houses, are being serviced appropriately. I try and understand what our consumers want. What do you like about your job? What excites you? I experience great pride in working for the Tata group, and ensuring that consumers in the heartlands of India get to experience natural products that are good for them. The Gaon Chalo programme provides employment to
34
rural youth. These small entrepreneurs earn enough to take care of their families without having to leave their homes for employment opportunities in big towns. In a small way, we are able to strengthen the rural economy and that adds meaning to my job. How do you serve your customers and resolve their queries? Both I and my team are committed to living the Tata values. I believe we do this by providing rural consumers with products of great quality that they can trust. The needs of rural consumers are not all the same - there are some who want good value for their money and others who want the best quality. We match our products to their demands. Depending on their need we sell the many variants of Tata Tea - Agni, , Gold. We also try and build awareness about the quality of our teas by organising small activations in the village hot tea shops. We brew our Tata Teas and other local teas, side-by-side. When left aside for a
short while, the local chai loses its golden colour, whereas Agni tea remains just the same. We invite consumers to taste our tea. We have found that these activations showcase the quality of our products to consumers, who are then keen to buy them. Everyone in the Gaon Chalo chain is geared to serve the consumer. Tell us more about yourself My entire family was dependent on agriculture – my two brothers and I had no other choice but to plow the fields. We come from a low-income family. With Gaon Chalo I got the opportunity to fulfil my family obligations without leaving my native town. After ten years with this initiative, I have progressed quite a bit. I have been able to construct a small house for my family, and my son and daughter attend government school. It is my hope and wish that the next generation continues to be associated with the Tata group and we together are able to build a better future for the rural economy.
CORPORATE OVERVIEW 01-48
STATUTORY REPORTS 49-124
FINANCIAL STATEMENTS 125-220
Socially Responsible and Responsive As a brand that aims to delight our consumers, we at TGB go beyond providing quality and innovation in our products. We also stand in of the social concerns that affect the lives of the communities we serve. One such grave concern is breast cancer. Breast Cancer is the second leading cause of cancer deaths in Canadian women, after lung cancer - 1 in 4 (26.1%) cancer diagnoses are breast cancer. Tetley in Canada has been a staunch er of the Canadian Breast Cancer Foundation (CBCF) since 2001. In our continued of CBCF, an organisation that assures the best in breast cancer research and breast health education and advocacy initiatives, we have donated over $550,000 ($50,000 annually) till date.
Pick the pink
Consumers are the reason for our existence; they are our final and most important stakeholder so we wanted to engage with them meaningfully on a cause that we have ed and promoted for a decade and a half. To highlight our for the CBCF and to deepen our engagement with our loyal Tetley consumers, we decided to provide them with an opportunity to pick the final pack design for our limited edition Tetley ‘pink pack’, where 15 cents from the sale of every pack would be contributed to CBCF. Tetley guaranteed a contribution of $50,000. We chose 4 potential designs and leveraging the growing power of social media, we invited our loyal community of Facebook fans to vote for the pack they liked the most. The one with the most votes would be converted into an actual Tetley pack.
Consumers were delighted with this opportunity to pick a pack design. We received instant and comments from consumers. The initiative reached over 140,000 people and received over 10,000 engagements. The campaign posts on Facebook achieved both the highest organic reach and a record-setting engagement rate of nearly 10%, which is well above industry norms. In October 2015, we released 350,000 limited edition, consumer-selected ‘Pink Packs’. The comments on our Facebook page were truly heart-warming and the love that consumers felt for the Tetley brand shone through, along with their and encouragement in the form of purchases of the limited edition packs.
“At Tetley Canada, we have been longstanding ers of CBCF. With the ‘pink pack’ initiative we wanted to not just showcase our to this great cause, but also take our consumers along on that journey. We wanted to engage in conversations, outside of the banal, that showcase our solidarity for the big issues and challenges our consumers face” stated Ms. Kathy Grant-Munoz, Senior VP, Marketing and Sales, Canada, for TGB when talking of the objective for the campaign. “The campaign not just helped promote awareness for breast cancer, but also provided an opportunity for our Facebook community to share their own experiences and the cause.” she concludes.
Consumer speak – Facebook campaign
“Hard to choose - so make all four and we can make our choices at the store or buy all four - which is what I would do. Thank you for your of this very worthy cause.” “Fabulous designs! Amazing cause! Love them all, but A is my fave! Great job Tetley!” “Two time breast cancer survivor chooses A!!”
35
Annual Report 2015-16
In Keeping with Culture TGB has been selling branded tea in the Middle East for several years and the region represents an integral part of our global expansion plan.
TGB has been selling branded tea in the Middle East for several years and the region represents an integral part of our global expansion plan. Confirming this fact is TGB’s Managing Director for the Middle East region, Mr. Danny Finney. “Our growth strategy is to capture a sizeable brand share for Tetley in the Gulf Cooperation Council (GCC) countries and to then use that as a springboard for expansion into wider Arabia. Our goal is to reach the No. 2 position in five years. In order to achieve that, we need to deliver products that suit the local palate, brand communication that cuts through and brand experiences that create delight for local consumers.” The six GCC countries which are the current focus of TGB’s efforts are Saudi Arabia, United Arab Emirates, Kuwait, Oman, Qatar and Bahrain. In these traditional tea-drinking markets, Tetley is positioned as a international brand with innovation, differentiation and local relevance at its core. For example, the brand was launched in this market with the innovative drawstring tea bag format, which allows consumers to squeeze every last drop of flavour from bag to cup. Also, our brand campaign is locally relevant. The campaign thought ‘Squeeze more out of life’, ties the benefit of the drawstring bag to the attitude of the new generation of Arabs.
36
35%
Tetley was the fastest growing brand in the GCC in 2015 with 35% growth over prior year
The next step was to make the brand more relevant in everyday life, by crafting new opportunities to experience the brand. We therefore implemented several brand building activities to delight consumers and generate product trials for Tetley Drawstring tea bags.
•
Connect with every sip
CORPORATE OVERVIEW 01-48
STATUTORY REPORTS 49-124
FINANCIAL STATEMENTS 125-220
A long drive through traffic-filled city roads can be tiring. A beverage has the potential to make this ride refreshing. Building on this very insight, we gave Tetley tea samples to consumers at petrol stations / service stations. Every motorist waiting to fuel up their vehicle was treated to a refreshing cup of Tetley Strong or Golden black tea. A team of promoters worked tirelessly every day during the peak hours of 5 pm to 10 pm. The 14 service stations were specifically selected based on high traffic volumes to optimise impact. More than 220,000 consumers across varied demographics sampled and enjoyed a cup of warm Tetley tea. Consumer sentiment was very positive with an average sample acceptance rate of 45%. Thanks to a specifically designed tray which held 4 cups together with a storage chamber, each promoter was ‘hands free’ thereby enabling him to demonstrate the unique Drawstring function to consumers.
Fitness is an emerging trend across the world, and it is no different in the Gulf. Tea has always been viewed as a refreshing, healthy and natural beverage. In Kuwait, we brought the natural goodness of a cup of tea to fitness seekers in a gym. The of Fitness First, the largest privately-owned health club group in the world were treated to samples of Tetley Drawstring black and green tea, following their gym session. Branded counter-top units holding drawstring envelopes, branded cups and water boilers were placed in their member lounges. Following the success of this campaign Tetley has signed a bigger contract with Fitness First in which Tetley will be served in all the 58 ’ lounges across the GCC gym network. Projected servings are 50,000 cups per month. As part of the tie-up, Fitness First and Tetley will also carry out t marketing activities using social media, email alerts, in-gym branding and t consumer promotions thus leading to a wider reach with consumers.
Ramadan is an important month in the GCC countries. Tetley shared the Ramadan spirit by offering free Tetley samples in mosques during “Iftar” – the evening period when Muslims break their fast after prayers. This promotional activity held in Kuwait and UAE was carried out through the presence of both stationary branded booths and mobile promoters with backpacks. The drive received a phenomenal response with Tetley being sampled by 105,000 worshippers at 80 mosques across the two countries during the holy month.
An innovative way in which these sampling drives were carried out was the use of branded backpacks used by promoters to serve consumers on the move, quickly and efficiently. A first for the region was mobile sampling conducted in a large gathering at a live televised football match in Kuwait. The Tetley brand was also featured on the perimeter LED advertising hoarding with the line ‘Squeeze more flavour from your tea’ along with pack shots of the core variants - Strong and Golden.
220,000+ More than 220,000 consumers across varied demographics sampled and enjoyed a cup of warm Tetley tea “Being locally relevant is key. In all our sampling and promotion efforts in the Middle East, we have attempted to find a space for Tetley in daily life and in local culture. Consumer delight begins with understanding consumer needs in relation to local culture. That is what we have attempted to do to drive growth in the GCC market.” Mr. Finney signs off. All of these efforts were rewarded with great revenue results. Tetley was the fastest growing brand in the GCC in 2015 with 35% growth over prior year.
45%
Consumer sentiment was very positive with an average sample acceptance rate of 45%
37
Annual Report 2015-16
•
Connect with every sip
Coffee with F.R.I.E.N.D.S. Many marketers today will argue that ‘the experience is the brand’. Achieving consumer delight is no longer just about a quality product on the shelf, or even about great engagement in-store. It is much more than that – it is about taking ownership of the entire consumer experience and steering the interface between the Company and the consumer.
beans from the world’s most popular coffee regions and expertly blends and roasts them to achieve consistent, great tasting cup profiles which have stood the test of time. It is the 3rd largest bagged coffee brand in the USA, in of volume.
Brewing a brand experience
Going beyond the product benefit and message to reimagine the whole consumer journey to deliver new signature moments, is what creating consumer delight is all about. TGB’s coffee brand in the US – Eight O’Clock (EOC) Coffee, did just that. Drawing from iconic pop-culture on the silver screen, EOC created a unique experience for coffee lovers, with a little help from F.R.I.E.N.D.S. at Warner Bros.
Coffee with a legacy
EOC, America’s Original Gourmet Coffee, has a rich legacy of 150 years and brings to consumers high quality 100% Arabica coffee at great value. EOC carefully selects coffee
38
However, the growing popularity of K-Cups was crowding out EOC bagged coffee on retail shelves and declining bag sales were impacting the business. Connecting with a younger demographic was also proving to be a challenge. EOC Coffee needed a jolt to stand out. We needed to create an experience that would excite retailers and consumers, pampered by an array of sale priced options.
Coffee with F.R.I E.N.D.S.
The star-studded iconic sitcom F.R.I.E.N.D.S. was celebrating its 20th anniversary - the perfect time to create ‘Coffee with F.R.I.E.N.D.S.’ To celebrate this milestone, EOC Coffee ed hands with Warner Bros. to open a replica Central Perk coffee shop, identical to the one frequented by the characters of the hit, Emmy®-winning comedy. The pop-up replica promised to provide a variety of unique
experiences - including complimentary coffee and F.R.I.E.N.D.S. themed fun - for fans and coffee lovers alike. This was a big idea that brought two iconic coffeecentric brands together to form one captivating campaign. The Central Perk coffee shop served as the heart of all things F.R.I.E.N.D.S. To commemorate the occasion we crafted a limited edition bag coffee product ‘Eight O’Clock Central Perk’ coffee. The fully functioning pop-up Central Perk coffee bar located at 199 Lafayette Street in Manhattan’s SoHo neighbourhood opened its doors to the public in September 2014. Fans of the long-running hit series could check out signature props from the show in the decorated storefront, relax on Central Perk’s iconic orange couch, order coffee off the famous Central Perk chalkboard or win prizes through fun and exciting in-store promotions. F.R.I.E.N.D.S. - themed merchandise and EOC Coffee’s Central Perk roast and other bagged varieties were also available for purchase in-store at Central Perk. A F.R.I.E.N.D.S. mecca was born and 60,000 fans lined up to enjoy an immersive experience. Fans waiting to get into Central Perk weren’t just local New
CORPORATE OVERVIEW 01-48
STATUTORY REPORTS 49-124
FINANCIAL STATEMENTS 125-220
Yorkers - just as F.R.I.E.N.D.S.’ popularity crossed international borders, so did the fans stopping by the pop-up – they were from diverse and faraway locales such as Australia, Brazil, China, Israel, UK and more. Special guests like Gunther, America’s best known barista from the show, and F.R.I.E.N.D.S.’ theme song artist The Rembrandts ed in the celebrations.
60,000 FANS
A F.R.I.E.N.D.S. mecca was born and 60,000 fans lined up to enjoy an immersive experience
39
Annual Report 2015-16
•
Connect with every sip
Celebrating success
This 360 degree integrated marketing promotion was a breakthrough. The Central Perk pop-up brought EOC unprecedented publicity - on the air and all over the press. Overall, there were 1.6 billion earned media impressions. And that wasn’t all! Some fun facts on this successful consumer promotion: • There were close to 2,000 consumers at Central Perk’s opening day. • Consumers waited in line up to 3 hours to enter the Central Perk shop. • Over 11,500 cups of EOC Coffee were handed out on September 29th, 2014, National Coffee Day. Visitors to Central Perk enjoyed varieties of the brand including the limitededition Central Perk Roast, Caramel Macchiato, Dark Italian Espresso and The Original Decaf. • Plus, 27,189 photos were taken on the iconic orange couch. The retail element of the programme demonstrated a contemporary brand image which appealed to a younger demographic. During the 12-week promotional period EOC achieved the following: • EOC’s Bag Coffee grew 21% versus the previous period.
What was our success mantra?
• EOC’s share of the bag category increased +0.9 points versus the prior period. • EOC’s household penetration increased by +12% which represents over 1 million new households. (Source: Nielsen)
The partnership met our dual goals - it helped engage with the younger consumer group and drive sales. In this age of viral videos and trending hash tags, an on-ground event and promotion with a strong cultural resonance drew in the right consumers.
“Engaging with the consumer today is all about creating meaningful experiences. Brands are increasingly built by the takeaway experience of the brand. To turn consumers into advocates, marketers need to produce experiences that create an emotional resonance with consumers, ultimately creating brand loyalty. The objective of the campaign was to create something exciting for our consumers, a promotion with a strong cultural and emotional tone,” says Mr. David Allen, Senior VP, Sales and Marketing, EOC. “The promotion was based on the insight
40
Media and industry peers recognised this as a brilliant promotion and the campaign bagged multiple US Industry Awards: • GOLD Reggie award in the Partnership category. • BRONZE Reggie award in the Sponsorship and Licensed Property category. • BRONZE Pro Award in the category of Best Entertainment Sponsorship or Tie in.
that coffee is a catalyst for connections with F.R.I.E.N.D.S. The t campaign was a true blockbuster, drawing thousands of devoted F.R.I.E.N.D.S. fans and coffee lovers. The overall promotion sured expectations, delivering a 21% bump in bagged ground coffee sales. The mantra here is clear – create brand experiences that are relevant for your consumer, and they will reward you with their loyalty.”
CORPORATE OVERVIEW 01-48
STATUTORY REPORTS 49-124
FINANCIAL STATEMENTS 125-220
Hello Mr. Barista! Talk of coffee and everyone has an opinion on it - from the right way to brew it to the flavours that need to go in. There is so much you can do with coffee and who better than a Barista to share the secret of a perfect brew? TGB’s MAP coffee business in Australia introduced the Mr. Barista brand in the coffee pods segment. This brand was created exclusively for Coles - Australia’s second largest grocery retailer. We partnered with Coles to their growing share within the second biggest capsule coffee system – Caffitaly. The objective was to create a coffee pod brand that would appeal to the mass market. MAP did this by creating the lovable character of Mr. Barista.
He celebrates the coffee maker by making the consumer a connoisseur who can enjoy café quality coffee at home with the Mr. Barista brand. Adding the brand to the existing MAP coffee family has added over 57% incremental capsule sales to our portfolio in Coles. Since launching Mr. Barista, sales in Coles have taken TGB’s share of the total capsules market from 9.7% to 11.9% in a capsule segment that is growing at 20%. (Source: Aztec Grocery Scan Data, June 2016)
57% Adding the brand to the existing MAP coffee family has added over 57% incremental capsule sales to our portfolio in Coles
Creating a strong brand which delights the consumer starts with a great name and a memorable pack design. Extensive brainstorming resulted in the name and visual for Mr. Barista being chosen. The brand personality was that of an everyday guy who loves a chat, is friendly and approachable and happy-go-lucky. He is the perfect guide to the perfect blend for you.
Mild Let me take you on a smooth, subtly sweet flavour journey. Made only from quality South American and Ethiopian Arabica beans, Mild Mr. Barista offers a fruity-citrus profile with an intense but smooth taste with hints of almond and hazelnut cream. Ideal as an espresso or café latte, this lightly roasted blend is delicious, perfect for a little pick-me-up.
Strong Let me introduce you to my strong and rich coffee. This superb blend is full in body thanks to its perfectly blended Arabica and Robusta beans offering hints of cocoa and cereal along with a delicious crema. Excellent as a milk-based beverage or as a strong espresso, this is one of Mr. Barista’s favourite blends as its smooth-richness is delicious. You’ll never need another coffee!
Super Strong Let me show you an intense coffee! Full in body offering hints of cocoa, dark chocolate, mild wood, this blend is crafted using quality Arabica and Robusta beans to create an extra strong profile for that punchy pick-me-up. Excellent as a milk-based beverage or as a robust espresso, this powerful dark roast is for the true coffee lovers, not for the faint-hearted.
41
Annual Report 2015-16
•
Connect with every sip
Consumer Relationship Service Our vision at TGB is ‘To be the most ired natural beverages company in the world by making a big and lasting difference in Tea, Coffee and Water.’ To ensure that we move closer to this goal each day we need to listen to our consumers. We need an in-depth understanding on how they view us, what they think of our practices and our products in order to be able to effectively cater to their needs and expectations. At TGB we value consumer centricity, and the Consumer Relationship Service (CRS) is one way to make sure we understand the pulse of our consumers.
The CRS team is the touchpoint for the consumer to share their views and queries about TGB’s products. The teams use the CRS tool to facilitate the collation, escalation and response cycle of the received. It has been designed
to manage consumer s across the business globally and we make effective use of this information in marketing and business activities. The downstream flow of consumer has been depicted below:
Consumer Telephone, Email, Website, Letter
+ve (Praise)
CRS Tool can be configured to show ‘matches’ for particular issues or products to alert the respective teams on emerging issues. Data is logged / categorised in the CRS Tool by the TGB Team
& Queries
Taste
Via Email
-ve (Complaint) Commercial
Operations Commercial Team
Product Data collected is looked into by the Complaint Investigating Teams
42
Via dashboard displays
Marketing Team
CORPORATE OVERVIEW 01-48
Consumer response volumes, country wise, annual figures: Country
Australia Canada Czech Republic India Russia UK USA Total
Consumer Response Volumes (Annual) 41,200* 3,000 60 600 424 60 15,000 10,800* 71,144
*These volumes are projected figures based on current reporting and soon to be reported through CRS.
Objective of CRS
With the deployment of CRS, the aim is to convert each direct with our consumers into an opportunity, with perfect execution of the management process and related actions in order to: • Ensure consumers receive answers that demonstrate our commitment to their satisfaction.
This flow represents the life cycle of consumer input that finds its way to the CRS team. Behind the scenes each month a Centralised Global Reporting process takes place across locations where the CRS tool is currently in
STATUTORY REPORTS 49-124
FINANCIAL STATEMENTS 125-220
• Reassure that actions are being taken to avoid problems and improve product quality. • Improve brand image.
• Allows consumer-facing teams in different regions to interact with each other to on consumer s, solve queries and share best practices.
Benefits of the CRS tool
In the pipeline
• Allows for easy management of data. • Reduces complexity e.g. many systems to one. • Improves process management with all the actions being monitored by a central team. • References single repository for all s (consumer, internal). • s the business excellence aims of process management and business results. • Breaks down information barriers to improve data visibility. • Reduces scope for istrative and human errors due to data visibility. • Generates real-time reports quickly. • Creates all correspondence to consumers, printed and electronic, through pre-planned templates for consistency and efficiency.
• A Global Consumer Service Report will reflect sales data from the SAP system to be integrated with the CRS tool. This enhancement will cater to the global reporting requirements with figures for the number of s versus total products sold in each market being readily available. • Automated Data Protection to be incorporated in compliance with regional legislation. • Integration with forms on websites across locations. • Functionality which enables consumers to the CRS team through social media. The CRS tool is the ideal culmination of TGB’s promise to every consumer – Develop, Deliver, Delight.
use. These include UK, , Russia, Czech Republic, Canada, India, USA and Australia. As part of this process, a Global Consumer Service Report is produced to give visibility to complaints in commercial, manufacturing and
taste categories segregated on the basis of region, market and complaint categories. This report forms the basis for identifying and taking action on complaints in order to protect TGB’s brands and improve consumer service.
Response to a query and acknowledgement of received is communicated to the consumer
Consumer
Agrees to opt in
CRS Team in TGB Consumer is added to a database and related data can be extracted for marketing purposes 43
Annual Report 2015-16
•
Connect with every sip
Board of Directors
Cyrus P. Mistry
Mr. V. Leeladhar
CHAIRMAN
INDEPENDENT DIRECTOR
INDEPENDENT DIRECTOR
Mr. Cyrus P. Mistry is the sixth Chairman of Tata Sons Limited. He was appointed as Chairman of the Board of Tata Global Beverages Limited in December 2012. Mr. Mistry was earlier Managing Director of the Shapoorji Pallonji Group. He graduated with a degree in Civil Engineering from Imperial College, UK in 1990. In 1997, he received an M.Sc. in Management from the London Business School. He is a recipient of the ‘Alumni Achievement Award’ from the London Business School. He is a Fellow of the Institution of Civil Engineers, London. He is a Member of the Presidential CEO Advisory Board of the Massachusetts Institute of Technology. Mr. Mistry serves as the co-Chair of the India-US CEO Forum as well as India-UK CEO Forum.
Mr. V. Leeladhar has long experience in the banking industry having served as the Executive Director of the Bank of Maharashtra, Chairman and Managing Director of Vijaya Bank and Chairman and Managing Director of Union Bank of India. He also served as the Deputy Governor of the Reserve Bank of India for over four years. Mr. Leeladhar is an expert on banking and in financial matters. He was also a member of the Securities & Exchange Board of India for about three years. His expertise is in the area of banking and finance. He is also on the Board of Tata Cleantech Capital Limited and Axis Mutual Fund Trustee Limited.
Mrs. Mallika Srinivasan is the Chairman & Chief Executive Officer of Tractors and Farm Equipment Limited, a flagship company of the Amalgamations Group. A thought leader and strategist, recognised for her commitment to excellence and contribution to Indian Industry, she has been at the helm of affairs of industry bodies and trade associations such as Tractor Manufacturers Association, Madras Management Association, Madras Chamber of Commerce & Industry and the Southern Regional Council of CII. She is the Director of five other Indian companies. She is a recipient of several business awards and has been recognised by Business Today for 7 consecutive years as one of the 25 most powerful women in Indian business. She was awarded the Pa Shri for her contributions to trade and Industry by the President of India in 2014.
Mr. S. Santhanakrishnan
Mrs. Ireena Vittal
Mr. Harish Bhat
DIRECTOR
INDEPENDENT DIRECTOR
DIRECTOR
Mr. S. Santhanakrishnan, FCA is a partner of PKF Sridhar & Santhanam, Chartered ants. He has more than 30 years of experience in Finance, s including IFRS, Strategy & Planning, Global Assurance, Corporate Laws and Consulting. He was a member of the Central Council of the Institute of Chartered ants of India (ICAI). He is actively involved in numerous industry oriented initiatives of the Reserve Bank of India and the Ministry of Corporate Affairs. He is on the Board of other Tata companies and IDBI Federal Life Insurance Co. Ltd., ICICI Home Finance Co. Ltd. and is the Non-Executive Chairman of Catholic Syrian Bank Limited.
Mrs. Ireena Vittal, a former partner with McKinsey & Co., is a recognised thought partner to consumer-facing companies looking to build large-scale, profitable businesses in emerging markets. Ms. Vittal was a founding member of the economic-development practice and the global emerging-markets practice at McKinsey & Co. She is an Independent Director on the board of select Indian companies such as Titan Company, Indian Hotels, Godrej Consumer, Tata Industries, Wipro, and on the global advisory board of IDEO.org, a non-profit organisation dedicated to applying human-centered design to alleviate poverty. She graduated in electronics and has an MBA Degree from the Indian Institute of Management, Calcutta.
Mr. Harish Bhat holds a Post Graduate Diploma in Management (PGDM) from IIM, Ahmedabad. He ed the Tata Group as a TAS probationer in 1987 and has completed 29 years of service with the Group. Mr. Harish Bhat was the CEO and Managing Director of Tata Global Beverages Limited from 1st July 2012 to 31st March 2014. He continues to serve on the Board of TGB as a Non-Executive Director from 1st April 2014. He was also previously with Tata Tea Limited from 1988 to 2000 holding various positions in the Company. He is on the Board of Directors of many Tata Group Companies including Tata Coffee Limited, Tata Starbucks Private Limited, Infiniti Retail Limited, Titan Company Limited, Tata Unistore Limited and Trent Limited.
44
Mrs. Mallika Srinivasan
CORPORATE OVERVIEW 01-48
STATUTORY REPORTS 49-124
FINANCIAL STATEMENTS 125-220
Mr. Analjit Singh
Mrs. Ranjana Kumar
INDEPENDENT DIRECTOR
INDEPENDENT DIRECTOR
INDEPENDENT DIRECTOR
Mr. Analjit Singh is the Founder & Chairman Emeritus of The Max Group. He is the nonexecutive Chairman of Vodafone India and a Director on the boards of TGB, Sofina NV/SA, Belgium and advisor to some leading international companies. Mr. Analjit Singh has been honoured with Pa Bhushan, India’s third highest civilian award by the President of India. He has been honoured with the Ernst and Young Entrepreneur of the Year Award (Service Category) and the Golden Peacock Award for Leadership and Service Excellence. He also serves as the Honorary Consul General of the Republic of San Marino in India.
Mrs. Ranjana Kumar retired as Vigilance Commissioner in Central Vigilance Commission, Government of India. She was also a Member, Governing Council, National Innovation Foundation, Ahmedabad. She had held very significant positions in her career including that as the Chairperson & Managing Director of Indian Bank, Chairperson of National Bank for Agriculture and Rural Development (NABARD), Executive Director, holding concurrent charge as Chairman and Managing Director of Canara Bank and CEO of the US operations of the Bank of India based in New York. She has also been appointed as Chairperson of the Advisory Board on Bank Commercial and Financial Frauds.
Mr. Darius Pandole holds a BA (Economics) Degree from Harvard and an MBA from the University of Chicago. He is a Partner and Executive Director at New Silk Route Advisors Pvt. Ltd., a private equity advisory firm focused on investing in India and other Asian economies. Mr. Pandole had earlier worked with Kraft General Foods in the US and returned to India in 1993. He served as Managing Director of IndAsia Fund Advisors Private Limited, the Indian advisor to the AMP-IndAsia India Fund – a private equity fund established in partnership with AMP of Australia. He ed IDFC PE Ltd. in February 2003, and was the Executive Director, and later Chief Operating Officer. He is on the Board of several companies including Tata Global Beverages Group UK and NourishCo Beverages Limited.
Mr. Ajoy Misra
Mr. L. KrishnaKumar
MANAGING DIRECTOR & CEO
EXECUTIVE DIRECTOR & GROUP CHIEF FINANCIAL OFFICER
Mr. Ajoy Misra is the Managing Director and CEO of the Company with effect from 1st April 2014. In a career spanning 35 years, 30 of which were with the Taj Group of Hotels, Ajoy Misra has led various departments of Taj Hotels from Sales and Marketing to Operations. He was the General Manager of Taj President Hotel in Mumbai and was the Area Director for Sri Lanka and Maldives and General Manager of the Taj Samudra Hotel in Colombo. He has a Bachelors Degree in Civil Engineering from BITS, Pilani and a MBA from the Faculty of Management Studies, Delhi University. He has also done the Advanced Management Program (AMP-174) at Harvard Business School, Boston.
Mr. Darius Pandole
Mr. L. KrishnaKumar graduated from Loyola Collage in Madras and subsequently obtained professional qualifications in Chartered ancy, Cost ancy and Company Secretarial. He is the Executive Director and Group Chief Financial Officer of Tata Global Beverages Limited. He supervises the Finance, Governance and IT functions. He also oversees the Global Buying and Blending and Supply Chain functions. He is also a director on the board of NourishCo Beverages Limited and several of the Company’s overseas subsidiaries. He ed the Tata Group in 2000 in the hotels business as its Vice President, Finance. He took over the head of finance function of Tata Tea in India in the year 2004 and has been part of its growth story since then.
45
Annual Report 2015-16
•
Connect with every sip
Executive Office
Mr. Ajoy Misra
Mr. L. KrishnaKumar
MANAGING DIRECTOR & CEO
EXECUTIVE DIRECTOR & GROUP CHIEF FINANCIAL OFFICER
Mr. Misra has been with Tata Group for over 30 years. Before becoming a part of Tata Global Beverages Limited, he held with distinction several leadership roles at the Taj Group of Hotels, including that of Head of Global Marketing & Sales, Area Director in the Sri Lanka and Maldives regions, and General Manager of various regions and properties of Taj. Mr. Misra is a Civil Engineering graduate from BITS Pilani and holds an MBA from the Faculty of Management Studies, Delhi University. He has also completed the Advanced Management Program from Harvard Business School.
Mr. L. KrishnaKumar ed Tata Group in 2000 as Vice President, Finance, in the Hotels business, and was then promoted as Head of Finance of Tata Tea in India in 2004. He is currently the Executive Director & Group Chief Financial Officer, and supervises the finance, governance and IT functions. He has worked with Larsen and Toubro Limited (L&T), a diversified conglomerate company, in a variety of areas. His last role with L&T, before ing Tata Group, was as General Manager, Finance, in their corporate office.
Mr. K. S. Srinivasan
Mr. Adil Ahmad
GLOBAL CHIEF HUMAN RESOURCES OFFICER
GLOBAL CHIEF MARKETING OFFICER
Mr. K. S. Srinivasan ed Tata Global Beverages Limited as Chief Human Resources Officer in 2013, and has been with the Tata Group for 24 years. He has more than 30 years of global experience in the human resources function. Prior to ing TGB, Mr. Srinivasan headed the Human Resources function, including Learning & Development, for the Americas and Europe for the Taj Group of Hotels based out of New York. His core expertise is in the areas of managing and integrating organisation culture, performance management, organisational change initiatives, reward and compensation management, industrial relations, and employee engagement.
Mr. Adil Ahmad ed Tata Global Beverages in 2015 as Chief Marketing Officer. In this role, Adil aligns our efforts and drives synergies across geographies and markets to develop a strong portfolio of global brands. As brand custodian, he focuses on overall health, profitability and isation of brands across various markets. He is also responsible for innovation and developing new growth opportunities for the global brands and businesses across regions and markets focusing on Tea, Coffee and enhanced Water. Prior to this, Adil has had a twenty year career with Reckitt Benckiser, holding leadership positions across UK, India, Mideast and East Asia, in both strategic and operational roles. Adil graduated from St. Stephen’s College, Delhi and holds an MBA from Case Western University, Cleveland, Ohio, USA.
Mr. Sushant Dash REGIONAL PRESIDENT, INDIA
Mr. Dash ed Tata Global Beverages in 2000, and has successfully handled various strategic and operational roles for the organisation. Some of his previous roles include Marketing Head for India, Team Leader of a Venture Team based in UK, and Senior Director – Marketing and Business Development – for Tata Starbucks. In his most recent role, he was the Global Brand Director of TGB. Prior to ing the Company, he worked at ORG Marg in various capacities in Consumer and Market Research. Mr. Dash holds a post graduate degree from Mudra Institute of Communication, Ahmedabad (MICA) and is a graduate in Economics from Ravenshaw University, Cuttack.
46
CORPORATE OVERVIEW 01-48
Mr. Stephen Rice
STATUTORY REPORTS 49-124
FINANCIAL STATEMENTS 125-220
Mr. Vikram Grover
REGIONAL PRESIDENT, CANADA, AMERICA AND AUSTRALIA (CAA)
PRESIDENT, WATER VERTICAL
Mr. Stephen Rice is the Regional President for the Canada, America and Australia (CAA) region of Tetley. Prior to ing Tetley, he worked for Coca-Cola, first as Financial Analyst and then as Product Manager. He then ed Cadbury Beverages, Canada, as Product Manager, moving up as Business Manager for a number of brands within Cadbury, including allied brands - Welch’s and Motts - and was then appointed as District Sales Manager. He ed Tetley in 1999 as Marketing Manager and grew to become Vice President, Marketing, in 2004. He became Regional President for the CAA region in 2010. Mr. Rice holds an Honours BComm degree, majoring in Marketing.
Mr. Vikram Grover is Head of Tata Global Beverages’ water business, responsible for product and market development of functional waters and building a global footprint for the water business. He is based in Mumbai, India and also has overall responsibility for the Company’s tea business in Bangladesh. Vikram ed TGB as Marketing Head for South Asia in 2010, and has played a key role in achieving several milestones for the Company’s branded tea business in India. Prior to ing TGB, he worked with Unilever holding significant roles such as Global Strategy and Archetypes Director for Beverages and Country Head for Beverages in India. Vikram has an MBA in Marketing from the Indian Institute of Management, Kolkata, and is an engineering graduate from the Punjab Engineering College, Chandigarh.
Mr. Sanjiv Sarin
Mr. Nigel Holland
MANAGING DIRECTOR & CEO, TATA COFFEE LIMITED
REGIONAL PRESIDENT, EUROPE, MIDDLE EAST AND AFRICA (EMEA)
Mr. Sanjiv Sarin is Chief Executive Officer and Managing Director of Tata Coffee Limited. Mr. Sarin has held the position of Regional President, South Asia, of TGB since 2010. During his tenure, he has significantly strengthened TGB’s position in the Indian branded tea market. Mr. Sarin has over 38 years of experience in a variety of significant roles. Prior to his stint at TGB, he held the position of Executive Director – Business Development, at Tata Coffee Limited. He has global experience with leading international organisations, including 16 years at Cadbury Schweppes in the Philippines, Egypt, India and the UK, his last assignment being Country Director of Cadbury Philippines. Mr. Sarin graduated from Asian Institute of Management, Manila, Philippines, with a distinction, and has a Masters in Economics from Bombay University, where he graduated with a gold medal.
Mr. Nigel Holland ed the Management team in 2011 and is responsible for the regions of Europe, the Middle East and Africa (EMEA). He is also the Executive Director and Chairman of Joekels Tea Packers Limited, South Africa, as well as the President of the UK Tea & Infusions Association (UKTIA). With a degree and MBA in Economics, Mr. Holland ed the Tetley Group in 1998 as Marketing Controller, having previously worked in various consumer marketing positions for a number of leading FMCG brands, including Scottish & Newcastle Breweries, Kraft Jacobs Suchard, and Boots Healthcare International. A year later, he became the Marketing Director. In 2002, he was appointed as the Commercial Director for the UK business, which later extended to the regions of Western Europe and Australia. In 2008, with the formation of Tata Global Beverages Limited, Mr. Holland was appointed as Regional President for UK and Africa, which was subsequently expanded to cover the Europe-Middle East-Africa region.
47
Annual Report 2015-16
•
Connect with every sip
10-Year Financial Highlights Rs. in cr 2015-16 # 2014-15 # 2013-14 # 2012-13 # 2011-12 # 2010-11 # 2009-10 2008-09 2007-08
2006-07
3190
3040
2868
2439
2129
1924
1837
1525
1263
1146
EBITDA
342
317
284
239
232
147
191
153
176
198
Operating Profits
319
297
268
222
220
135
179
142
166
179
Profit before Tax
661
349
585
321
370
230
495
229
386
350
Total Revenue
97
60
139
62
67
50
104
70
73
43
Profit after Tax
564
289
447
259
303
181
391
159
313
307
Dividend payout @
164
162
147
154
154
142
143
125
253
109
63
62
62
62
62
62
62
62
62
59
-
1
-
-
-
-
-
-
-
22
Reserves & Surplus
2833
2439
2511
2256
2148
1995
2016
1737
1742
1485
Shareholders' Funds
2896
2502
2573
2318
2210
2056
2078
1799
1804
1566
Tax
Equity Capital Share Warrants / Share Suspense
378
477
457
509
367
505
500
755
758
797
3274
2979
3030
2827
2577
2561
2578
2554
2562
2363
Net Block
209
205
162
150
143
126
111
104
98
247
Contribution to Exchequer
172
118
141
96
87
72
120
80
83
54
Payments relating to Employees
187
162
136
120
101
95
95
92
72
179
No. of Employees
2552
2549
2466
2489
2218
2373
2419
2422
2510
34506
Book value per Share (Rs.)*
45.54 +
39.29 +
41.26 +
37.13 +
35.39 +
32.90 +
332.47
287.43
288.19
261.51
Earnings per Share (Rs.)
8.93 +
4.58 +
7.23 +
4.18 +
4.89 +
2.92 +
63.30
25.72
50.79 **
53.56
Dividend per Share (Rs.)
2.25 +
2.25 +
2.25 +
2.15 +
2.15 +
2.00 +
20.00
17.50
35.00 &
15.00
Total Debt to Equity*
0.13
0.19
0.18
0.22
0.17
0.25
0.24
0.42
0.43
0.52
8181
8063
7819
7437
6735
6100
5855
4907
4376
4103
EBITDA
675
775
752
768
623
608
722
646
709
704
Operating Profits
532
642
623
663
527
509
619
547
617
608
Profit before Tax
545
500
707
637
574
494
641
1256
2059
566
Net Profit
326
248
481
373
356
254
390
701
1,543
443 359.96
Borrowings ^ Capital Employed
CONSOLIDATED FINANCIAL HIGHLIGHTS Total Revenue
89.96 +
86.38 +
93.90 +
77.08 +
73.15 +
63.37 +
596.35
580.94
557.34
Basic Earnings per Share (Rs.)
5.16 +
3.93 +
7.77 +
6.03 +
5.76 +
4.11 +
63.11
113.28
250.41 **
Total Debt to Equity *
0.18
0.21
0.21
0.25
0.16
0.21
0.38
0.53
Book value per Share (Rs.)*
# Figures as per Schedule III. @ Includes Tax On Dividend. ^ Includes current maturities of long term debts. * Computation excludes Revaluation Reserves. + Computation based on revised face value of shares. ** On the average Share capital for the year/period. & Includes one time special dividend of Rs. 20 per share.
48
0.59
77.46 ** 1.67
Corporate Overview 01-48
Statutory Reports 49-124
Financial Statements 125-220
Notice
Special Business 5.
Remuneration of Cost Auditors
Notice is hereby given that the Fifty Third Annual General Meeting of the of Tata Global Beverages Limited will be held at The Oberoi Grand, 15 Jawaharlal Nehru Road, Kolkata – 700 013 on Wednesday, 24th August 2016 at 10.30 a.m. to transact the following businesses:
To consider and if thought fit, to with or without modification(s), the following resolution as an Ordinary Resolution:
“RESOLVED THAT pursuant to the provisions of Section 148 and other applicable provisions, if any, of the Companies Act, 2013, read with the Companies (Audit and Auditors) Rules, 2014 (including any statutory modification(s) or re-enactment(s) thereof, for the time being in force), Shome & Banarjee, Cost ants, (Firm Registration Number 000001), appointed by the Board of Directors of the Company to conduct the audit of the cost records of the Company, for the financial year ending March 31, 2017, be paid a remuneration of Rs. 3,25,000 plus service tax as applicable and reimbursement of out of pocket expenses incurred by them in connection with the aforesaid audit.
RESOLVED FURTHER THAT the Board of Directors of the Company be and is hereby authorised to do all acts and take all such steps as may be necessary, proper or expedient to give effect to this resolution.”
Ordinary Business 1.
To receive, consider and adopt:
(a)
the audited financial statements of the Company for the financial year ended March 31, 2016, together with the reports of the Board of Directors and Auditors thereon; and
(b)
the audited consolidated financial statements of the Company for the financial year ended March 31, 2016 together with the report of the Auditors thereon.
2.
To declare a dividend.
3.
To appoint a Director in place of Mr. Cyrus P Mistry (DIN 00010178), who retires by rotation and, being eligible, offers himself for reappointment.
6.
Issue of Non Convertible Debentures on private placement basis
4.
Ratification of Appointment of Auditors
To consider and if thought fit, to with or without modification(s), the following resolution as an Ordinary Resolution:
To consider and if thought fit, to with or without modification(s), the following resolution as a Special Resolution:
“RESOLVED THAT pursuant to the provisions of Sections 23, 42, 71 and other applicable provisions, if any, of the Companies Act, 2013 (“the Act”) read with the Companies (Prospectus and Allotment of Securities) Rules, 2014 and Companies (Share Capital and Debentures) Rules, 2014, including any statutory modification, amendment, substitution or re-enactment thereof, for the time being in force and pursuant to SEBI (Issue and Listing of Debt Securities) Regulations, 2008 and other applicable Regulations / Guidelines and subject to the relevant provisions of the Memorandum and Articles of Association of the Company, approval of the of the Company is hereby accorded to the Board of Directors of the Company, (hereinafter referred to as “the Board” which term shall be deemed to include any Committee of the Board) to issue / offer / invite for subscription / to allot
“RESOLVED that pursuant to the provisions of Section 139, 142 and other applicable provisions, if any, of the Companies Act, 2013, and the Rules framed thereunder, as amended from time to time, the Company hereby ratifies the appointment of Lovelock & Lewes (Firm Registration No. 301056E), as Auditors of the Company to hold office from the conclusion of this Annual General Meeting (AGM) till the conclusion of the fifty-fourth AGM of the Company to be held in the year 2017 at such remuneration plus service tax, out-of-pocket, travelling and living expenses, etc. for the financial year ending March 31, 2017, as may be mutually agreed between the Board of Directors of the Company and the Auditors.”
49
Annual Report 2015-16
Secured / Unsecured Redeemable Non-Convertible Debentures (“NCDs”) including but not limited to bonds and / or other debt securities (hereinafter collectively referred as “Securities”), on private placement basis, listed or unlisted, in one or more tranches, during the period of one year from the date of ing of this special resolution, to eligible person(s), upto a limit of Rs. 350 Crores (Rupees Three Hundred and Fifty Crores), within the overall borrowing limits of the Company as approved by the of the Company from time to time.
RESOLVED FURTHER THAT the Board is hereby authorised to determine the of the issue including providing security over any of the Company’s assets, the class of investors to whom such Securities are to be issued, timing of the issue, total amount to be raised by issuance of Securities, the number of Securities, tranches, issue price, tenor, interest rate, / discount, redemption , appointment of trustee(s), security, listing etc., and to do all such acts, deeds, filings, matters and execute all such deeds, documents, instruments and writings as may be required, with powers on behalf of the Company to settle all questions, difficulties or doubts that may arise in this regard, as the Board may, in its sole and absolute discretion deem fit and to delegate all or any of its powers herein conferred to any director(s) and / or officer(s) of the Company, as it may in its absolute discretion deem necessary.”
Notes: 1. The relative Explanatory Statement pursuant to Section 102 of the Companies Act, 2013 in respect of Item Nos. 4, 5 and 6 are annexed hereto. Information under Regulation 36 (3) of the Securities and Exchange Board of India (Listing Obligations and Disclosure Requirements) Regulations, 2015 relating to the Director proposed to be reappointed is provided in Annexure to this Notice. 2.
A member of the Company entitled to attend and vote at the Annual General Meeting (AGM) is entitled to appoint a proxy to attend and vote instead of himself/ herself and the proxy need not be a member of the Company. The instrument appointing the proxy, in order to be effective, must be deposited at the Company’s ed Office, duly completed and signed, not less than forty eight hours before the commencement of the AGM. Proxies submitted on behalf of limited companies, societies etc., must be ed by appropriate resolutions / authority, as applicable. A person can act as proxy on behalf
50
•
Connect with every sip
of not exceeding fifty (50) and holding in the aggregate not more than 10% of the total share capital of the Company. In case a proxy is proposed to be appointed by a Member holding more than 10% of the total share capital of the Company carrying voting rights, then such proxy shall not act as a proxy for any other person or shareholder. 3.
The of and Transfer Books of the Company will be closed from Wednesday, 10th August, 2016 to Wednesday, 24th August 2016, both days inclusive.
4.
, Proxies and Authorised Representatives are requested to bring to the meeting, the Attendance Slip enclosed herewith, duly completed and signed, mentioning therein details of their DP ID and Client ID / Folio Number.
5.
If the Final Dividend, as recommended by the Board of Directors, is approved at the AGM, payment of such dividend will be made on or after Friday, 26th August, 2016 as under:
i)
To all the beneficial owners in respect of shares held in dematerialised form as per the data as may be made available by the National Securities Depository Limited (NSDL) and the Central Depository Services (India) Limited (CDSL) as of the beginning of the business hours on Wednesday, 10th August 2016.
ii)
To all the in respect of shares held in physical form after giving effect to all valid transfers in respect of transfer requests lodged with the Company on or before the close of business hours on Tuesday, 9th August 2016.
6.
Shareholders holding shares in physical form are requested to advise any change of address, email address, bank details immediately to Company’s Registrar and Share Transfer Agents, TSR Darashaw Limited(TSRDL). Shareholders holding shares in electronic form must advise their respective depository participants about any change in address, email address and bank details and not to the Company or the Registrars.
The Securities and Exchange Board of India (“SEBI”) has mandated the submission of Permanent Number (PAN) by every participant in securities market. holding shares in electronic form are, therefore, requested
Corporate Overview 01-48
holding shares in physical form are requested to consider converting their holdings to dematerialised form to eliminate all risks associated with physical shares and for ease of portfolio management. can the Company or TSRDL for assistance in this regard.
8.
holding shares in physical form in identical order of names in more than one folio are requested to send to the Company or TSRDL, the details of such folios together with the share certificates and self attested copies of the PAN card of the holders for consolidating their holdings in one folio. A consolidated share certificate will be returned to such after making requisite changes thereon.
9.
Shareholders holding shares in electronic form are hereby informed that bank particulars ed against their respective depository s will be used by the Company for payment of dividend. For the safety and interest of the shareholders, it is important that bank details are correctly provided to the depository participants.
10.
In case of t holders attending the meeting, the member whose name appears as the first holder in the order of names as per of of the Company will be entitled to vote.
11.
12.
Shareholders are requested to immediately notify their bank particulars giving the name of the bank and the branch, 9 digit MICR number, 11 digit IFS Code, the nature of and their Core Banking Solutions number (CBS A/c No.) to the Company’s Registrar and Share Transfer Agent, TSR Darashaw Limited (TSRDL), in respect of shares held in physical form and to their Depository Participants in case of shares held in electronic form. As per the provisions of Section 72 of the Act, the facility for making nomination is available for the in respect of the shares held by them. who have not yet ed their nomination are requested to the same by submitting Form No. SH-13. The said form can be ed from the Company’s website www.tataglobalbeverages.com (under ‘Investors’ section).
Financial Statements 125-220
holding shares in physical form may submit the same to TSRDL. holding shares in electronic form may submit the same to their respective depository participants.
to submit the PAN to their depository participants with whom they are maintaining their demat s. holding shares in physical form can submit their PAN details to TSRDL. 7.
Statutory Reports 49-124
13.
Transfer of Unclaimed / Unpaid amounts to the Investor Education and Protection Fund (IEPF):
Pursuant to Sections 205A and 205C and other applicable provisions, if any, of the Companies Act, 1956, all unclaimed / unpaid dividend, application money, debenture interest and interest on deposits as well as the principal amount of debentures and deposits, as applicable, remaining unclaimed / unpaid for a period of 7 years from the date they became due for payment, have been transferred to the IEPF established by the Central Government. No claim shall be entertained against the IEPF or the Company for the amounts so transferred prior to 31st March, 2016. Shareholders who have not yet encashed their dividend warrant(s) pertaining to the dividend for the financial year 2008-09 and /or any subsequent years are requested to make their claims without any delay to the Registrars. It may be noted that the unclaimed dividend for the financial year 2008-09 declared by the Company on 1st September, 2009 can be claimed by the shareholders by 10th September, 2016. Attention of the shareholders is also drawn to the “Corporate Governance” section of the Annual Report in respect of unclaimed dividend.
14.
In accordance with the Companies Act, 2013 read with the relevant Rules, the Notice of the AGM along with the Annual Report for 2015-16 are sent by electronic mode to those whose e-mail addresses are ed with the Company / Depositories, unless any member has requested for a physical copy of the same. For who have not ed their e-mail addresses, physical copies are being sent by the permitted mode.
15.
We request shareholders to update their email address with their Depository Participants to enable the Company to send communications electronically.
16.
Shareholders may note that the bank details ed against their in physical form will not be applicable to their electronic and vice versa. The Company or its Registrars cannot act on any request received directly from the shareholders holding shares in electronic form for any change of bank particulars or bank mandate. Such changes are to be advised only to the depository participant of the shareholders. 51
Annual Report 2015-16
17.
18.
It is in interest of the shareholders to their bank details against their and avail of facility being extended by the Company of receiving the credit of dividend directly to their bank through electronic means. The facility is available at all bank branches that have ed themselves as participating banks with National Payment Corporation of India and have ed the Core Banking System. The shareholders may please note that under instructions from the Securities and Exchange Board of India, furnishing of bank particulars by the shareholders has become mandatory.
19.
Updation of Member’s Details:
The format of of prescribed by the Ministry of Corporate Affairs under the Companies Act, 2013 requires the Company/ Share Registrar & Transfer Agents to record additional details of the , including their PAN details, email address, Bank details for payment of dividend etc. A form capturing the additional details is appended at the end of this Annual Report. holdings shares in physical form are requested to submit the filled in form to the Company or its Share Registrars and Transfer Agents, M/s TSR Darashaw Limited, 6-10 Haji Moosa Patrawala Industrial Estate, 20 Dr. E. Moses Road, Mahalaxmi, Mumbai – 400 011. holding shares in electronic form are requested to submit the details to their respective Depository Participants.
20.
Voting through electronic means:
I.
52
In compliance with the provisions of Section 108 of the Companies Act, 2013 and the Rules framed thereunder, as amended from time to time and Regulation 44 of the Securities and Exchange Board of India (Listing Obligations and Disclosure Requirements) Regulations, 2015, the Company is pleased to provide holding shares either in physical form or in dematerialised form, the facility to exercise their right to vote electronically through the e-voting services provided by National Securities Depository Limited (NSDL) on all resolutions set forth in the Notice. In this regard, your Demat / Folio Number has been enrolled by the Company for your participation in e-voting on the resolutions placed by the Company on the e-Voting
•
Connect with every sip
system. Shareholders may exercise their right to vote through remote e-voting through e-voting services provided by NSDL or vote at the 53rd Annual General Meeting (AGM) by electronic means or poll paper. The instructions for e-voting are as under:
A.
In case a member receives an email from NSDL [for whose email Ids are ed with the Company/Depository Participants]:
i.
Open email and open PDF file viz, “TGBL e-Voting.pdf” with your Client ID or Folio No. as . The said PDF file contains your ID and /PIN for e-voting. Please note that the is an initial .
ii.
Launch internet browser by typing the following URL: https://www.evoting. nsdl.com/
iii.
Click on Shareholder –
iv.
If you are logging in for the first time, please enter the ID and provided in the PDF file attached with the e-mail as initial .
v.
The change menu will appear on your screen. Change to a new of your choice, making sure that it contains a minimum of 8 digits or characters or a combination of both. On first , the system will prompt you to change your and update your details like mobile number, email id etc. in the profile of the folio, which may be used for sending future communications. You will also need to enter a secret question and answer of your choice to retrieve your in case you forget it. Note the new . It is strongly recommended not to share your with any other person and take utmost care to keep your confidential.
Corporate Overview 01-48
vi.
You need to again with the new credentials. Home page of e-voting will open.
vii.
If you are already ed with NSDL for e-voting, then you can use your existing ID and and cast your vote.
viii.
Once the e-voting Home page opens, Click on e-Voting > Active Voting Cycles.
ix.
x.
xi.
xii.
xiii.
Select “EVEN” (E-Voting event number) of Tata Global Beverages Limited which is 104330. Now you are ready for e-voting as Cast Vote page opens. Cast your vote by selecting appropriate option “For” or “Against” and click on “Submit”. A confirmation box will be displayed. Click “OK” to confirm or “CANCEL” to modify. Once you confirm, you will not be allowed to modify your vote. Upon confirmation, the message “Vote cast successfully” will be displayed. You may similarly vote in respect of all other resolutions forming part of the Notice of the Annual General Meeting. During the voting period, can any number of times till they have voted on all the Resolutions. If you wish to log out after voting on a few resolutions and continue voting for the balance resolutions later, you may click on “RESET” for those resolutions for which you have not yet cast the vote. Institutional shareholders (i.e. other than individuals, HUF, NRI etc.) are required to send scanned copy (PDF/ JPG Format) of the relevant Board Resolution/Authority letter, etc. together with attested specimen signature of the duly authorised signatory(ies) who are authorised to
Statutory Reports 49-124
Financial Statements 125-220
vote, to the Scrutinizer through e-mail to [email protected].
B.
In case a member receives physical copy of the Notice of AGM [for whose email IDs are not ed with the Company/ Depository Participants or requesting physical copy]:
i.
Initial is provided in the enclosed attendance slip along with EVEN (E Voting Event Number), ID and /PIN
ii.
Please follow all steps from Sl. No. (ii) to Sl. No. (xi) in A. above, to cast vote.
C.
who are already ed with NSDL for e-voting can use their existing Id and for casting their votes.
II.
In case of any queries, you may refer the Frequently Asked Questions (FAQs) for Shareholders and e-voting manual for Shareholders available at the s section of www.evoting.nsdl.com.
III.
The e-voting period commences on Saturday 20th August 2016 at 9.00 am and ends on Tuesday 23rd August 2016 at 5.00 pm. During this period, shareholders of the Company, holding shares either in physical form or in dematerialised form, as on the cut-off date, namely 17th August 2016, may cast their vote electronically. The e-voting module shall be disabled by NSDL for voting thereafter. Once the vote on a resolution is cast by the shareholder, the shareholder shall not be allowed to change it subsequently or cast vote again.
IV.
The voting rights of shareholders shall be in proportion to their shares in the paid up equity share capital of the Company as on the cut-off date, which is 17th August 2016 . A person whose name is recorded in the of or in the of Beneficial Owners maintained by the Depositories as on the cut-off date only shall be entitled to avail the facility of remote e-voting as well as voting at the AGM.
53
Annual Report 2015-16
V.
The facility to vote at the AGM will be provided by any electronic means or Poll paper to the shareholders who will be attending the AGM and have not cast their vote through remote e-voting.
VI.
Dr. Asim Kumar Chattopadhyay, Practicing Company Secretary (hip No. FCS 2303 & No. 880) has been appointed as the Scrutinizer to scrutinize the remote e-voting process as well as voting through Poll at the AGM in a fair and transparent manner.
VII.
The Scrutinizer shall immediately after the conclusion of voting at the Annual General Meeting, will first count the votes cast at the Meeting and thereafter will unblock the votes cast through remote e-voting in the presence of at least two witnesses not in the employment of the Company.
VIII.
54
The Scrutinizer will collate the votes cast at the Meeting, votes ed from the e-voting system and make a Consolidated Scrutinizer’s Report of total votes cast in favour or against, if any, forthwith to the Chairman of the Company or a person authorised by him in writing who shall countersign the same. Any person, who acquires shares of the Company and becomes a member of the Company after dispatch of the Notice and holding shares as of the cut-off date, may obtain the id and by sending a request at [email protected]. However, if you are already ed with NSDL for remote e-voting then you can use your existing ID and for casting your vote. If you forget
Connect with every sip
your , you can reset your by using “forget details/” option available on www.evoting.nsdl.com.
•
IX.
The results declared along with the Scrutinizer’s Report shall be placed on the Company’s website www.tataglobalbeverages.com and on the website of NSDL www.evoting.nsdl.com immediately after the results are declared. The Company shall simultaneously forward the results to BSE Limited (“BSE”) National Stock Exchange of India Limited (“NSE”) and Calcutta Stock Exchange (“CSE”), where the shares of the Company are listed. The route map showing directions to reach the venue of the fifty third AGM is annexed. By Order of the Board
V. Madan Vice President & Company Secretary
ed Office: 1, Bishop Lefroy Road, Kolkata – 700 020 CIN - L15491WB1962PLC031425 E-mail id: [email protected] Website address: www.tataglobalbeverages.com Mumbai 24th May 2016
Corporate Overview 01-48
Statutory Reports 49-124
Financial Statements 125-220
Explanatory Statement Pursuant to Section 102 of the Companies Act, 2013 (“the Act”) As required by Section 102 of the Companies Act, 2013 (“the Act”), the following explanatory statement sets out all material facts relating to the businesses mentioned under Item Nos. 4, 5 and 6 Item No. 4 Ratification of Appointment of Auditors This explanatory statement is provided though strictly not required as per Section 102 of the Companies Act, 2013. Lovelock & Lewes (Firm Registration No. 301056E), Chartered ants, were appointed as the statutory auditors of the Company for a period of three years to hold office from the conclusion of the fifty first AGM till the conclusion of the fiftyfourth AGM of the Company to be held in the year 2017 (subject to ratification of their appointment at every AGM). In pursuance of the same, their ratification for appointment from the conclusion of the fifty third AGM till the conclusion of the fifty fourth AGM is being put up to the shareholders for their ratification. The Board commends the Ordinary Resolution at Item No. 4 for approval by the . None of the Directors / Key Managerial Personnel of the Company / their relatives are, in any way, concerned or interested, financially or otherwise, in the Ordinary Resolution set out at Item No. 4 of the Notice.
Item No. 5 Remuneration of Cost Auditors The Board, on the recommendation of the Audit Committee, has approved the appointment and remuneration of M/s Shome & Banarjee as the Cost Auditors to conduct the audit of the cost records of the Company, for the financial year ending March 31, 2017. In accordance with the provisions of Section 148 of the Companies Act, 2013 read with the Companies (Audit and Auditors) Rules, 2014, the remuneration payable to the Cost Auditors as recommended by the Audit Committee and approved by the Board of Directors, has to be ratified by the of the Company. Accordingly, consent of the is sought for ing an Ordinary Resolution as set out at Item No. 5 of the Notice for ratification of the remuneration payable to the Cost Auditors for the financial year ending March 31, 2017.
from time to time, a company offering or making an invitation to subscribe to Non Convertible Debentures (“NCD”) on a private placement basis, is required to obtain the prior approval of the Shareholders by way of a Special Resolution, which can be obtained once a year for all the offers and invitations for such NCDs during the year. The Company is considering to issue NCDs/other debt securities to augment the long term resources of the Company for its business as the current NCDs are falling due for repayment. The approval of the is being sought by way of a Special Resolution under Section 42 and other applicable provisions, if any, of the Act read with the Rules made there under, to enable the Company to offer or invite subscriptions for NCDs on a private placement basis, in one or more tranches, during the period of one year from the date of the special resolution, upto an amount not exceeding Rs. 350 Crores, within the overall borrowing limits of the Company, as approved by the from time to time, with authority to the Board to determine the and conditions, including the issue price, listing, redemption , security etc. of the NCDs / other debt securities. The proposed borrowings, along with the existing borrowings of the Company, would not exceed the aggregate outstanding borrowings of the Company approved by the , from time to time. The Directors commend the Special Resolution at Item No. 6 of the accompanying Notice for the approval of the of the Company. None of the Directors / Key Managerial Personnel of the Company / their relatives are, in any way, concerned or interested, financially or otherwise, in the Special Resolution set out at Item No. 6 of the Notice. By Order of the Board
The Board commends the Ordinary Resolution set out at Item No. 5 of the Notice for approval by the . None of the Directors / Key Managerial Personnel of the Company / their relatives are, in any way, concerned or interested, financially or otherwise, in the Ordinary Resolution set out at Item No. 5 of the Notice.
Item No. 6 Issue of Non Convertible Debentures on private placement basis As per the provisions of Section 42 of the Companies Act, 2013 (“Act”), including any statutory modifications or re-enactments thereof for the time being in force, read with the Companies (Prospectus and Allotment of Securities) Rules, 2014, as amended
V. Madan Vice President & Company Secretary ed Office: 1, Bishop Lefroy Road, Kolkata – 700 020 CIN - L15491WB1962PLC031425 E-mail id: [email protected] Website address: www.tataglobalbeverages.com Mumbai 24th May 2016 55
Annual Report 2015-16
•
Connect with every sip
Annexure to Notice Particulars of Director seeking reappointment Particulars
Mr. Cyrus P Mistry
Date of Birth
July 4, 1968
Date of Appointment
June 22, 2012
Qualifications
Graduate Degree in Civil Engineering, UK; M. Sc. In Management, London Business School
Expertise in specific functional areas
Wide business experience in variety of industries
Directorships held in other public companies (excluding foreign companies and companies ed under Section 25 of the Companies Act, 1956)
Tata Sons Limited#
Tata Industries Limited *
The Tata Power Company Limited *
Tata Teleservices Limited *
Tata Consultancy Services Limited*
Tata Steel Limited*
Tata Motors Limited*
Tata Chemicals Limited *
The Indian Hotels Company Limited*
hips/Chairmanships of Committees of other companies (includes only Audit Committee and Stakeholder Relationship Committee)
Nil
Number of shares held in the Company
33,000
Inter-se relationship with other Directors and Key Managerial Personnel
Nil
#Executive Chairman *Chairman of the Board For other details such as number of meetings of the board attended and amount of sitting fees drawn during 2015-16, in respect of Mr. Cyrus P. Mistry, please refer to the Corporate Governance Report.
56
Corporate Overview 01-48
Statutory Reports 49-124
Financial Statements 125-220
Route Map to the AGM Venue Venue: The Oberoi Grand, 15 Jawaharlal Nehru Road, Kolkata – 700 013
Land Mark: Near Esplanade Metro Station
57
Annual Report 2015-16
•
Connect with every sip
DIRECTORS’ REPORT TO THE Your Directors are pleased to submit their fifty third report together with the audited financial statements of the Company for the year ended 31st March 2016.
Financial Results
Rs. in Crores Consolidated
Standalone
2015-16
2014-15
2015-16
2014-15
8,111
7,993
3,084
2,885
675
775
342
317
(143)
(133)
(23)
(20)
532
642
319
297
71
70
107
155
Less : Finance Costs
(69)
(82)
(30)
(34)
Profit before exceptional items and taxes
534
630
396
418
11
(130)
265
(69)
Profit before tax
545
500
661
349
Provision for tax
(210)
(216)
(97)
(60)
Revenue from Operations Profit from Operations before Other Income, Finance Costs, Depreciation and Exceptional Items Less : Depreciation Profit from Operations before Other Income, Finance Costs and Exceptional Items Add: Other Income (Standalone results include intra-group dividends eliminated on consolidation)
Exceptional items (net)
335
284
564
289
Share of Net loss in Associates
(1)
(11)
-
-
Minority Interest
(8)
(25)
-
-
Profit after tax
326
248
564
289
3,331
3,276
920
820
Add: Adjustment on Amalgamation
-
20
-
2
Amount available for appropriation
3,657
3,544
1,484
1,111
Proposed dividend
(142)
(142)
(142)
(142)
Dividend distribution tax
(23)
(21)
(23)
(19)
Transfer to general reserve
(68)
(49)
(56)
(29)
Adjustment on evaluation of useful life of Fixed Asset
-
(1)
-
(1)
(233)
(213)
(221)
(191)
3,424
3,331
1,263
920
Profit for the year Add: Surplus brought forward from previous year
Retained in profit and loss statement
State of Company’s Affairs Consolidated Performance
non branded portfolio, improvements were mainly recorded in Coffee plantation and Coffee extraction businesses.
Consolidated Income from operations for 2015-16 was Rs. 8,111 Crores, against Rs. 7,993 Crores in the previous year, reflecting a 2% growth aided by improved performance both in the branded and unbranded businesses. At prior year exchange rates, the increase would be 3%. Within the branded business, India tea business performed well with good value and volume growth and our incubatory businesses, such as MAP in Australia, Tata Starbucks and NourishCo also increased their revenues. Within the
Profit from operations declined against the prior year mainly in the branded business due to underperformances in some developed markets. This decline is largely attributable to commodity price increases in coffee and tea in the international markets, higher spends behind brands and new launches, category decline in some developed markets and increased competitor and retailer activities. The Indian branded and non-branded businesses
58
Corporate Overview 01-48
performed well offsetting the lower performance in developed markets. Profit after tax was however significantly higher than prior year mainly due to the impact of exceptional items. During the year, your Company sold some non-core investments realising a profit of Rs. 328 Crores. The Company also recognised non cash impairment losses amounting to Rs. 270 Crores mainly relating to its businesses in Eastern Europe and US. While the Company is actively pursuing various growth opportunities, the ing impairment has been recognised due to underperformances as compared to plans mainly arising out of factors like macroeconomic instability in Russia and category decline in every day black tea in certain markets and higher competitive intensity in some markets. We continued our focus on green and specialty teas across markets during the year under review. There was renewed focus of increasing the distribution for our super segment whilst focus on new innovative products continued. The “Super Green tea” which is the first fortified green tea with proven health benefits which was launched in UK saw significant growth and was ahead of category growth on a full year basis. There was also significant growth in the green tea segment in India, and US. Fruit and herbal teas were launched in UK and US where customer response has been very positive. Teapigs, our super tea brand, saw significant growth in UK, US and Canada and other international markets with improved distribution. In India, our new coffee brand, Tata Coffee Grand had a high impact launch which created the desired buzz and visibility. In addition, Tata Tea Gold with a region specific blend was launched in the state of Maharashtra which received favourable customer response. Various new products like the Signature Collection and London Blend have been launched in select developed markets. The year also reflected good execution of the launch plans in Middle-East which resulted in market share increases. The performance of the businesses under our strategic partnership with Starbucks and PepsiCo also saw good growth. In Tata Starbucks, growth has been achieved as a result of good in-store performance and expansion in the number of stores. NourishCo reflected good growth based on significant increase in the sales of Tata Gluco Plus and a moderate growth in Himalayan sales. Your Company’s consolidated performance has to be viewed in the context of difficult macro economic conditions and the emerging category trends in some of the developed markets that the Company operates in and that investments are being made for future growth.
Statutory Reports 49-124
Financial Statements 125-220
Your Company’s focus in 2016-17 would be to invest in innovations and capability building in line with the Group’s medium term strategy plan and balancing the same with pressures on EBIT margins by prioritising our strategic objectives. The key focus themes across all regions will be to drive innovation and build momentum on the recent launches. Our focus will also be on improving distribution and driving cost efficiencies. We will meet these objectives through strengthening and leveraging people capabilities and robust execution of plans with continued commitment to our sustainability initiatives.
Standalone Performance Your Company’s Income from operations for the year ended 31st March 2016 was Rs. 3,084 Crores, ing an improvement against the prior year, driven by increase in volumes and average realisation reflecting the increase in both national and regional brands. Profit from operations at Rs. 319 Crores was higher than the previous year mainly driven by increased sales and lower commodity and input cost trends despite higher spends behind brands and new launches. Profit before and after tax was significantly higher aided by exceptional income, derived through sale of non-core investments partially offset by provisions relating mainly to the China extraction business arising out of delays in startup and stabilisation of technology for an enhanced product range. Your Company recorded 7% income growth over the prior year with increases in the flagship Tata Tea Brands and also in the Regional brands. Your Company is pleased to report that it continues to maintain both volume and value leadership in the overall branded tea category and leadership in the green tea category, in a challenging and competitive environment. During the year, your Company renewed its focus on green tea and launched innovative products. The Company launched Tata Tea Gold with a region specific blend to strengthen its foothold in Maharashtra for which consumer response has been positive. In addition, to expand the product category, your Company launched Tata Coffee Grand with a unique blend that is gaining consumer acceptance.
Share Capital The Amalgamation of Mount Everest Mineral Water Limited (MEMW) with the Company was completed during the year under review. Pursuant to and in consideration of the Scheme of Amalgamation of MEMW with your Company, which was effective 18th May 2015, your Company issued and allotted 1.27 Crore equity shares of Re. 1 to the eligible shareholders of MEMW, post which, the paid up capital of the Company increased to Rs. 63.11 Crores.
59
Annual Report 2015-16
Dividend Your Directors are pleased to recommend for the approval of the shareholders, a dividend of Rs. 2.25 per share on the equity share capital of the Company with respect to the financial year 2015-16. The total outgo on of dividend, inclusive of taxes, for 2015-16 is Rs. 165 Crores which represents a pay-out of 29% of the Company’s stand alone profits.
Transfer to Reserves An amount of Rs. 56 Crores is proposed to be transferred to General Reserves out of the amount available for appropriation and an amount of Rs. 1,263 Crores is proposed to be retained in the profit and loss statement.
Review of Subsidiaries, Associates and t Venture Companies Pursuant to Section 129(3) of the Companies Act, 2013, the consolidated financial statements of the Company and its subsidiaries, t ventures and associates, prepared in accordance with the relevant ing Standards specified under Section 133 of the Companies Act, 2013, read with Rule 7 of the Companies (s) Rules, 2014, form part of this Annual Report. Pursuant to the provisions of the said section, a statement containing the salient features of the financial statements of the Company’s subsidiaries, associates and t ventures in Form AOC-1 is given in this Annual Report. Further, pursuant to the provisions of Section 136 of the Companies Act, 2013, the financial statements of the Company, consolidated financial statements along with relevant documents and separate s in respect of subsidiaries are available on the website of the Company. There have been no material changes in the nature of the business of the subsidiaries (including associates and t ventures) during the financial year 2015-16. Acquisitions/ divestments, as applicable, have been adequately disclosed in the financial statements. Your Company has adopted a policy for determining material subsidiaries in of Regulation 16(1)(c ) of Securities and Exchange Board of India (Listing Obligations and Disclosure Requirements) Regulations, 2015 (Listing Regulations). The Policy as approved may be accessed on the Company’s website at the link: http://www.tataglobalbeverages.com/docs/default-source/ Investor-Governance-Policy-/policy-on-subsidiary.pdf?sfvrsn=0
60
•
Connect with every sip
Performance highlights of key operating subsidiaries / associates / t ventures Indian Operations Tata Coffee Limited Tata Coffee recorded a turnover of Rs. 718 Crores reflecting a growth of 5% over the prior year. The improvement is mainly attributable to higher instant coffee sales. The turnover of the plantation business also showed improvement driven by higher sales of Robusta and Pepper offset by lower Arabica volumes due to off year trends. The Instant Coffee business reported a strong growth in Africa and a favourable portfolio mix of volumes contributed to the Instant Coffee’s turnover and profitability. The overall profitability of the plantation business was flat impacted by seasonal nature of the business, soft tea prices and higher costs. The depreciation policy for Tata Coffee was changed to align to a single basis of depreciation for similar type of assets as opposed to different basis of depreciation being followed earlier. A write-back was taken to exceptional items to reflect the impact of the change. Post the impact of exceptional items, Profits before and after tax are at prior year levels. The Directors of Tata Coffee Limited have recommended a dividend of Rs.1.30 per equity share of Re. 1 each for the year 2015-16 which is the same as last year. The instant coffee operations continues to focus on operational discipline, cost reduction and sustainability in operations. With a specific focus on cost reduction, various alternatives have been used to reduce the power and fuel costs in the instant coffee factories. In addition, the Theni Unit won the CII Sustainability award and Toopran unit won the National level Energy conservation award. Tata Coffee also won two awards at the 12th Golden Leaf India Awards 2016 in recognition of the high quality teas produced at their factory located in the Anamalai hills in South India. Additionally, Plantation Trails, Tata Coffee’s hospitality brand, was awarded the ‘Certificate of Excellence’ from Trip Advisor, the world’s largest travel website, for the third consecutive year. The award is based purely on customer and ratings.
NourishCo Beverages Limited NourishCo Beverages Limited, a t venture with PepsiCo, is driving our water agenda in India. It distributes the Himalayan brand whilst it manufactures and sells the Tata Water Plus and Tata Gluco Plus brands. The Company ed a turnover of Rs. 125 Crores for 2015-16, reflecting a growth of 44%. Tata Gluco Plus has been performing extremely well and high double digit growth in volume and value were recorded during the year 2015-16.
Corporate Overview 01-48
The new proposition of “Gas minus Energy Plus” and the visual changes on the packaging to communicate “Energy” for the brand were received very well by the consumers and have accelerated the brand’s growth rate. We strengthened our distribution with presence in Maharashtra, Karnataka, Gujarat and Kerala. In addition, Himalayan sales declared a double digit growth in volume and value by focusing on channel mix and selective price increases. During the year, a television commercial was run with the objective of establishing Himalayan’s source credentials.
Tata Starbucks Private Limited Tata Starbucks recorded a turnover of Rs. 235 Crores during 2015-16 ing a growth of 39% over the prior year. Tata Starbucks’ store count stands at 82 at the end of the financial year. The business continues to perform well with revenue growth driven by improved store performance and increase in the number of stores. In-store performance has been robust helped by various initiatives such as localisation of supply chain and other similar initiatives contributing to improving profitability.
Amalgamated Plantations Private Limited (APPL) For the financial year 2015-16, turnover at Rs. 570 Crores was in line with prior year. However, profits were impacted mainly due to wage revisions which were negotiated on a tripartite basis. The business ed record production in February/ March 2016 due to good rains during end season. During the year, whilst regular tea prices were soft, teas reflected a hardening trend. In addition APPL is also involved with the tea extension planting advisory services initiative which ensures that the small tea growers are trained in Good Tea Cultivation practices to increase yield and improve compliance and quality of green leaf. This will help them get a fair price for sustainable livelihood and become a stable supply base to APPL factories. This initiative has led to identification and linkage of 5,252 small tea growers to APPL Estates for green leaf supply in 2016-17. Further, certain gardens achieved RA certifications and Trust Tea certification, in addition to ISO 22000 and SA 8000.
Kanan Devan Hills Plantation Company Private Limited (KDHP) For the financial year 2015-16, KDHP recorded a turnover of Rs. 259 Crores. The profitability and operations were impacted by labour unrest in its estates and factories for a week in September and for a fortnight in October, resulting in heavy loss of production. The unrest was across most plantations in Kerala due to demands for wage revision and higher bonus. Additionally, loss of production during this period of unrest and its aftermath, left the tea fields in overgrown condition necessitating substantial costs for ensuing restoration work on the affected fields, which
Statutory Reports 49-124
Financial Statements 125-220
further impacted both production and income. The Company also incurred substantial increase in costs due to a significant increase in labour wages as decided by the Plantation Labour Committee, constituted by the Government of Kerala, and this plantation industry wide wage revision, done once in three years, was due in 2015. Despite the labour unrest, the productivity for the season was higher than the previous year and total crop production performance was better than that of other companies in Munnar. The average price of tea achieved for the year was also higher than previous year, due to the increased production of high value teas and firming up of tea prices during the second half. In the Great Places to Work Survey (2015) conducted by the Economic Times and Great Place to Work® Institute, KDHP was ranked 97 in the Top 100 of India’s Best Companies to Work for in 2015. On the quality front, KDHP won two awards at the 2016 Golden Leaf India Awards competition held at Dubai, a testimony to the stringent quality standards adopted by the Company. Additionally, two tea factories were awarded the Appreciation Award under the Small Industry Category of the Kerala State Pollution Control Award, 2016. This is a testimony to the strict safety standards maintained by all KDHP establishments. On the certifications front, KDHP continues to maintain all certifications of international repute, including Rainforest Alliance, Fairtrade, Organic, ISO 22000, ETP, GMP and Trustea. It was a moment of great joy and pride when the Company ed the Rainforest Alliance annual audit, with an astounding score of 98.9%.
International Operations Eight O Clock Coffee Company (EOC) EOC’s total income, under IGAAP, during 2015-16 at Rs. 1,046 Crores was higher than the previous year’s income of Rs. 1,008 Crores. The increase in top line is mainly due to favourable currency movement. The business grew its non-promoted volumes over prior year but a significant increase in competitor intensity through additional promotional events and deeper discounting adversely affected the overall sales. Profits were impacted because of lower sales coupled with increase in coffee commodity costs. During the year, Eight O Clock Coffee was the recipient of two Reggie awards for their earlier partnership with Warner Brothers celebrating the 20th anniversary of the hit comedy TV show “Friends”. The award recognises the best marketing campaigns activated by brands with a focus on strategy, creativity, originality, integration and results. The campaign resulted in introducing the brand to a younger consumer base which ultimately contributed to brand sales growth. 61
Annual Report 2015-16
Tata Global Beverages Group Limited, UK The consolidated income from Tata Global Beverages Group Limited, UK, under IGAAP, which substantially reflects the financial performance of the Tetley business and other international brands, at Rs. 3,313 Crores, was lower than prior year mainly due to adverse translation impact. At constant exchange rates, there was a marginal underlying topline growth. The improvement in underlying sales is mainly due to improvements in the Teapigs brand, Russia, Middle East, South Africa, and coffee business in Australia partially offset by lower performance in other key markets. The operating profit was behind prior year mainly due to category de-growth and high competitive intensity in some major markets, higher commodity prices, impact of the macroeconomic condition prevailing in countries like Russia and higher spends on new launches and market entries. The underlying performance of the main brands was strong with many successes. Teapigs, our super brand has done exceedingly well by growing distribution in UK, US and in other international markets. Green tea has exceeded expectations and our growth is significantly higher than the category growth in UK. Super greens is the star performer in UK and the green tea portfolio, though small, has significantly increased in the last couple of years. In addition to UK, green tea has also done well in US, Canada and . During the year, fruit and herbal categories were launched in UK and US and the initial response is positive. A new variant, the Signature Collection which was launched in Canada is gaining distribution and a new blend – “British Brands” was launched in US. Various ment campaigns were deployed in markets to the Tetley brand and new launches. Whilst in the UK there was a focus on Tetley ment using the iconic “teafolk” and implementation of a new pack, Canada concentrated on Signature Collections and new packaging changes. We continue to be market leaders in Canada and have gained volume share in the UK. The Company is happy to inform you that for the second year running, Tetley has been recognised in the 2015 Great Taste Awards, winning coveted gold stars for its Kenyan Gold (Blend Collection), Pure Green, Redbush Vanilla, Super Green Tea, Boost, Lime and Serenity, and Mood Infusions. The Great Taste Awards is one of the world’s largest and most trusted food and drink awards, organised by the Guild of Fine Food. This respected seal of approval is a sign of quality, which consumers can trust whilst buying food and drink from their local retailer. Non Cash Goodwill impairments were recorded during the year under review mainly relating to its businesses in Eastern Europe and US. While the Company is actively pursuing various growth opportunities, the ing impairment has been recognised
62
•
Connect with every sip
due to underperformances as compared to plans mainly arising out of factors like macro-economic instability in Russia and category decline in every day black tea / competitive intensity in other markets.
Tata Tea Extractions Inc. Tata Tea Extractions Inc., a wholly owned subsidiary in the USA supplies customer specific tea ingredients to Iced Tea Beverage companies. During the year, the income from sales in underlying currency increased by 1%, while the Profit from Operations grew by over 5%, when compared to the previous year. This was mainly on of improved realisation from customers despite challenging market conditions, favourable blend mix and a marginal reduction in the cost of goods sold. In addition to the existing products, Tata Tea Extractions has developed a new formulation during the year to cater to the requirements of new customers as well as existing customers. The initial on this formulation from some of the customers have been favourable. In the manufacturing plant in Munnar, we are also working on an enhanced product range for one of our major customers. Developmental activities such as these, coupled with the existing product range is expected to help the company to sustain and grow the extraction business.
Zhejiang Tata Tea Extraction Company Limited- China t Venture operations Delays continue in stabilisation of the China business. While prospective customers have shown interest in our instant tea products, the final conversion to orders will be dependent on meeting the product profile requirements. Going forward, stabilising the production process and establishing a pipeline of external customers and successful scaling of technology will be key to the success of the project. In view of the continued uncertainty of the business, your Company is evaluating various options for restructuring the business.
Estate Management Services Private Limited (EMSPL) Estate Management Services Private Limited, Sri Lanka (EMSPL) in which your Company owns 31.85% of the shares, is the holding company of Watawala Plantations Limited (WPL). WPL is one of the largest producers of tea and palm oil in Sri Lanka and amongst the most efficiently run in that country. EMSPL also owns Watawala Tea Ceylon Limited (WTCL) which is in the branded business and owns three key brands ‘Zesta’, ‘Watawala’ and ‘Ran Kahata’ which together command 33% market share of the branded tea market in Sri Lanka. Sri Lankan tea has good acceptance in several countries including Russia, South East Asia, Australia and Middle East.
Corporate Overview 01-48
EMSPL has continued to perform well during 2015-16. Watawala Plantations PLC ed growth in profitability driven by better performance of tea and rubber segments. Watawala Tea Ceylon also recorded healthy growth in operating performance with both revenue and profitability substantially improving over the previous financial year.
Companies which have become or ceased to be Subsidiaries, Associates and t Ventures During 2015-16, RBC Hold Co LLC ceased to be a subsidiary as it was dissolved during the year. As stated above, Mount Everest Mineral Water Limited, an erstwhile subsidiary, was amalgamated with the Company, effective 18th May, 2015. No other company became or ceased to be a subsidiary, t venture or associate during 2015-16.
Human Resources and Industrial Relations During the year under review, a key agenda of the Company was to prioritise HR imperatives to the Company’s ambitious growth plans. The theme was ‘Raising the Bar’ and laying down practices on HR policies and principles to in accelerating business Growth. The Company further continued leveraging the 3 tier leadership program to build the leadership capabilities across regions. During the year under review, industrial relations remained harmonious at all our offices and establishments.
Corporate Governance and MD &A A detailed report on Corporate Governance is separately attached together with a report on Management Discussion and Analysis (MDA). The MDA also covers the consolidated operations and reflects the global nature of our business.
Vigil Mechanism / Whistle Blower Policy The Company has a vigil mechanism for directors and employees to report their concerns about unethical behaviour, actual or suspected fraud or violation of the code of conduct/business ethics that provides for adequate safeguards against victimisation of the director(s) and employee(s) who avail of the mechanism. No director/employee has been denied access to the Chairman of the Audit Committee.
Internal Financial Controls The Company has adequate system of Internal Controls which are detailed in the Management Discussion and Analysis Report.
Statutory Reports 49-124
Financial Statements 125-220
Governance Guidelines The Company has adopted a governance guidelines on Board effectiveness. The guidelines cover aspects relating to composition and role of the Board, Chairman and Directors, Board diversity, definition of independence, term of directors, retirement age and committees of the Board. The guidelines also cover aspects relating to nomination, appointment and induction and development of directors, directors remuneration, subsidiary oversight, code of conduct, Board effectiveness reviews and mandates of Board committees.
Procedure for Nomination and appointment of directors The Nomination and Remuneration Committee (NRC) is responsible for developing competency requirements for the Board based on the industry and strategy of the Company. The Board composition analysis reflects in-depth understanding of the Company, including its strategies, environment, operations, financial condition and compliance requirements. The NRC makes recommendations to the Board in regard to appointment of new directors. The NRC also conducts a gap analysis to refresh the Board on a periodic basis, including each time a directors appointment or re-appointment is required. The NRC is also responsible for reviewing the profiles of potential candidates vis-à-vis the required competencies, undertake a reference and due diligence and meeting of potential candidates prior to making recommendations of their nomination to the Board. At the time of appointment , specific requirements for the position, including expert knowledge expected, is communicated to the appointee.
Criteria for determining qualifications, positive attributes and independence of a director The NRC has formulated the criteria for determining qualifications, positive attributes and independence of directors in of the provisions of Section 178(3) of the Companies Act, 2013 and Regulation 19 of the Securities and Exchange Board of India (Listing Obligations and Disclosure Requirements) Regulations, 2015 (Listing Regulations), the key features of which are: •
Qualifications – The Board nomination process encourages diversity of thought, experience, knowledge, age and gender. It also ensures that the Board has an appropriate blend of functional and industry expertise.
63
Annual Report 2015-16
•
Positive Attributes- Apart from the duties of directors as prescribed in the Companies Act, 2013, the directors are expected to demonstrate high standards of ethical behaviour, communication skills and independent judgment. The directors are also expected to abide by the respective Code of Conduct as applicable to them.
•
Independence - A director will be considered independent if he / she meet the criteria laid down in Section 149(6) of the Companies Act, 2013 and Regulation 16(1)(b) the Listing Regulations.
Annual Evaluation of the Board, its Committees and Individual Directors The Board of directors had carried out an annual evaluation of its own performance, board committees and individual directors as required under the Companies Act, 2013 and the Listing Regulations. The performance of the board was evaluated by the board after seeking inputs from all the directors on the basis of criteria such as board composition, structure, board processes and their effectiveness, information given to the board etc. The performance of the board committees was evaluated by the board after seeking inputs from the committee on the basis of criteria such as committee composition, structure, effectiveness of committee meetings etc. The Board and the NRC reviewed the performance of the individual directors on the basis of criteria such as contribution at meetings, their preparedness on the issues to be discussed etc. Additionally the Chairman was also evaluated on key aspects of his role.
Remuneration Policy The NRC has formulated a policy relating to the remuneration for the directors, key managerial personnel and other employees. The philosophy for remuneration is based on the commitment of fostering a culture of leadership with trust. The remuneration policy has been prepared pursuant to the provisions of Section 178(3) of the Companies Act, 2013, and Regulation 19 of the Listing Regulations. While formulating this policy, the NRC has considered the factors laid down in Section 178(4) of the Companies Act, 2013, which are as under: •
•
That the level and composition of remuneration is reasonable and sufficient to attract, retain and motivate directors of the quality required to run the company successfully; Relationship of remuneration to performance is clear and meets appropriate performance benchmarks; and 64
•
Connect with every sip
•
Remuneration to directors, key managerial personnel and senior management involves a balance between fixed and incentive pay reflecting short and long-term performance objectives appropriate to the working of the company and its goals.
The key principles governing the remuneration policy are as follows:
•
Market competitiveness
•
Role played by the individual
•
Reflective of size of the company, complexity of the sector/ industry/ company’s operations and the company’s capacity to pay
•
Consistent with recognised best practices and
•
Aligned to any regulatory requirements
In accordance with the policy, the Managing / Executive directors / KMPs / employees are paid basic/ fixed salary, benefits, perquisites and allowances and annual incentive remuneration/ performance linked bonus subject to achievement of certain performance criteria and such other parameters as may be considered appropriate from time to time by the Board. The performance linked bonus would be driven by the outcome of the performance appraisal process and the performance of the Company.
Remuneration for independent directors and non independent non executive directors The non-executive Directors, including Independent Directors, are paid Sitting fees for attending the meetings of the Board and Committees of the Board. The overall remuneration (sitting fees and commission) should be reasonable and sufficient to attract, retain and motivate directors aligned to the requirements of the Company including considering the challenges faced by the Company and its future growth imperatives. The remuneration should also be reflective of the size of the Company, complexity of the business and the Company’s capacity to pay the remuneration. The Company pays a sitting fee of Rs. 30,000 per meeting per director for attending meetings of the Board, Audit, Nomination and Remuneration and Executive Committees (Rs. 20,000 in case of Mr. Cyrus Mistry, Chairman and Mr. Harish Bhat, Director). For meetings of all other Committees of the Board, a sitting fee of
Corporate Overview 01-48
Rs. 20,000 per meeting per director is paid (Rs. 15,000 in case of Mr. Cyrus Mistry, Chairman and Mr. Harish Bhat, Director). Within the ceiling of 1% of net profits of the Company computed under the applicable provisions of the Companies Act, 2013, the Non-Executive Directors including Independent Directors are also paid a commission, the amount whereof is recommended by the NRC and determined by the Board. The basis of determining the specific amount of commission payable to a Non-Executive Director is related to his attendance at meetings, role and responsibility as Chairman/Member of the Board/Committees and overall contribution as well as time spent on operational matters other than at the meetings. The shareholders of the Company had approved payment of commission to the non-executive directors at the Annual General Meeting held on 26th August 2014, which is valid up to the financial year ending 31st March 2019. No Stock option has been granted to the Non-Executive Directors.
Familiarisation programme for independent directors The details for familiarisation of the independent directors are given in the website and the same can be accessed at the link http://www.tataglobalbeverages.com/company/leadership/ board-of-directors As required under Regulation 46(2)(i) of the Listing Regulations, the details of familiarisation programmes conducted during the year 2015-16, is also put on the Company’s website.
Number of meetings of the Board Nine meetings of the Board of Directors were held during the year 2015-16. For further details, please refer to the Corporate Governance Report, which forms part of this Annual Report.
Audit Committee The details pertaining to composition of audit committee are included in the Corporate Governance Report which forms part of this Annual Report.
Significant and material orders ed by the Regulators or Courts There are no significant and material orders ed by the Regulators/Courts that would impact the going concern status of the Company and its future operations.
Corporate Social Responsibility and Sustainability initiatives The Natural Beverages Policy of Tata Global Beverages is the apex policy that incorporates all relevant elements of Sustainability, Corporate Social Responsibility, Affirmative Action, Community Initiatives and volunteering. It is aligned with the Tata Group Sustainability Policy, and is applicable to all units of Tata Global
Statutory Reports 49-124
Financial Statements 125-220
Beverages, including associate companies and t ventures. Through this policy, Tata Global Beverages aspires for global sustainability leadership in the natural beverages sector. The policy states that, “Tata Global Beverages is committed to be the most ired natural beverage company in the world by making a big and lasting difference through Sustainability and Corporate Social Responsibility. We shall achieve this by being the consumer’s first choice in sustainable beverage production and consumption.” The policy is built around the five pillars of sustainability - community development, sustainable sourcing, climate change, water management and waste management. In compliance with Section 135 of Companies Act, 2013, Tata Global Beverages has undertaken CSR activities, projects and programs, excluding activities undertaken in pursuance of its normal course of business. The report on CSR activities as required under Companies (Corporate Social Responsibility Policy) Rules, 2014 is given in Annexure 1 forming part of this report. The CSR Policy may be accessed on the Company’s website at the link http://www.tataglobalbeverages.com/docs/default-source/ default-document-library/corporate-social-responsibility-policy72 14b6881a2368caa65dff02001c5be1.pdf?sfvrsn=0 During the year under review, the Company has spent Rs. 5.53 Crores (around 2.46% of the average net profits of last three financial years) on CSR activities on projects qualifying as per Section 135 of the Companies Act, 2013 duly approved by the CSR Committee. In addition to the projects specified as CSR activities under Section 135 of Companies Act 2013, the Company has also carried out several other sustainability / responsible business initiatives and projects on a global scale. In 2015, for the fourth year in a row, Tata Global Beverages (TGB) was recognised on the Climate Disclosure Leadership Index (CDLI), and ranked second in India by CDP.
Particulars of employees The Information required under Section 197 read with Rule 5(1) of the Companies (Appointment and Remuneration of Managerial Personnel) Rules, 2014 are given in Annexure 2 which forms part of this report. Pursuant to Section 197 (14) of the Companies Act, 2013 the details of remuneration received by the Managing and Executive directors from the Company’s subsidiary company during 2015-16 are also given in Annexure 2 attached to this report.
Particulars of Loans, Guarantees or Investments by the Company Details of Loans, Guarantees and Investments covered under the provisions of Section 186 of the Companies Act, 2013 are provided in Annexure 3 attached to this report. 65
Annual Report 2015-16
•
Connect with every sip
Risk Management
Directors’ Responsibility Statement
The Risk Management Committee of the Board is entrusted with the responsibility to assist the Board in overseeing and approving the Company’s risk management framework. The Company has a comprehensive Risk policy and a Risk detailing the risks that the Company faces under various categories like strategic, financial, commercial, operational, IT, legal, regulatory, people, reputational and other risks and these have been identified and suitable mitigation measures have also been formulated. The Risk Management Committee reviews the key risks, the Risk and the mitigation measures periodically. The Audit Committee has additional oversight in the area of financial risks and control.
Pursuant to Section 134(5) of the Companies Act, 2013, the Board of Directors, to the best of their knowledge and ability, confirm that: (i)
In the preparation of the s for the financial year ended 31st March 2016, the applicable ing standards have been followed and that there are no material departures;
(ii)
That the Directors have selected such ing policies and applied them consistently and made judgments and estimates that were reasonable and prudent so as to give a true and fair view of the state of affairs of the Company at the end of the financial year and of the profits of the Company for that period;
(iii)
That the Directors have taken proper and sufficient care to the best of their knowledge and ability for the maintenance of adequate ing records in accordance with the provisions of the Companies Act, 2013 for safeguarding the assets of the Company and for preventing and detecting fraud and other irregularities;
Deposits from public
(iv)
The Company has not accepted any deposits from the public during the year under review. No amounts on of principal or interest on deposits from public was outstanding as on 31st March 2016.
That they have prepared the s for the financial year ended 31st March 2016 on a ‘going concern’ basis.
(v)
The Directors have laid down internal financial controls
Disclosures as per the Sexual Harassment of Women at Workplace (Prevention, Prohibition and Redressal) Act, 2013 The Company has zero tolerance for sexual harassment at workplace and has adopted a policy on prevention, prohibition and redressal of sexual harassment at workplace in line with the provisions of the Sexual Harassment of Women at Workplace (Prevention, Prohibition and Redressal) Act, 2013 and the Rules thereunder for prevention and redressal of complaints of sexual harassment at workplace.
Secretarial Audit Pursuant to the provisions of Section 204 of the Companies Act, 2013 and the Companies (Appointment and Remuneration of Managerial Personnel) Rules, 2014, the Company has appointed Dr. Asim Kumar Chattopadhyay, Company Secretary in Practice, to carry out the Secretarial Audit of the Company. The Report of the Secretarial Audit for 2015-16 is attached herewith as Annexure 4. There are no qualifications in the said report.
Annual Return As provided under Section 92(3) of the Companies Act, 2013, the extract of annual return in Form MGT-9 is given in Annexure 5 which forms part of this report.
66
for the company which are adequate and are operating effectively. (vi)
The Directors have devised proper systems to ensure compliance with the provisions of all applicable laws and such systems are adequate and are operating effectively.
Based on the framework of internal financial controls and compliance systems established and maintained by the Company, work performed by the internal, statutory and secretarial auditors including audit of internal financial controls over financial reporting by the statutory auditors and the reviews performed by Management and the relevant Board Committees, including the Audit Committee, the Board is of the opinion that the Company’s internal financial controls were adequate and effective during the financial year 2015-16.
Corporate Overview 01-48
Related Party Transactions All Related party transactions that were entered into during the financial year were on an arms length basis and in the ordinary course of business. There are no material significant related party transactions made by the Company during the year that would have required shareholder approval under Regulation 23(4) of the Listing Regulations and the erstwhile Clause 49 of the Listing Agreement. All related party transactions are reported to the Audit Committee. Prior approval of the Audit Committee is obtained for the transactions which are planned and/ or repetitive in nature and omnibus approvals are taken within the criteria/ limits laid down for unforeseen transactions. The disclosure under Section 134(3)(h) of the Companies Act, 2013 read with Rule 8(2) of the Companies (s) Rules, 2014 is not applicable. The Policy on Related Party transactions as approved by the Board has been ed on the Company’s Website and may be accessed at the link http://www.tataglobalbeverages.com/our-investors/ governance. The details of the transactions with related parties during 2015-16 are provided in the accompanying financial statements. None of the Directors had any pecuniary relationship or transactions with the Company during the year under review.
Directors and key managerial personnel At the Annual General Meeting of the Company held on 26th August 2014, the had approved the appointments of Mr. Analjit Singh, Mrs. Mallika Srinivasan, Mr. V Leeladhar, Mrs. Ranjana Kumar, Mr. Darius Pandole and Mrs. Ireena Vittal as Independent Directors for a term of five years from 26th August 2014. All the independent directors have given declarations that they meet the criteria of independence as provided in Section 149(6) of the Companies Act, 2013 and Regulation 16(1)(b) of Listing Regulations. In the opinion of the Board, they fulfill the conditions of independence as specified in the Act and the Rules made thereunder and they are independent of the management. Mr. Cyrus P Mistry retires by rotation at the forthcoming Annual General Meeting and being eligible, offers himself for re-election. Brief particulars and expertise of Mr. Mistry together with his other directorships and committee hips have been given in the annexure to the Notice of the Annual General Meeting in accordance with the requirements of Listing Regulations.
Financial Statements 125-220
Statutory Reports 49-124
No director or key managerial personnel was appointed or has retired or resigned during the year under review.
Auditors and Auditors’ Report The at the Annual General Meeting held on 26th August 2014, had appointed M/s. Lovelock and Lewes, as the Statutory Auditors for three years subject to ratification by the each year. The are requested to ratify the appointment of M/s. Lovelock and Lewes as Statutory Auditors from the conclusion of the fifty third Annual General Meeting till the conclusion of the fifty fourth Annual General Meeting. The Auditors’ report on the financial statements for the year 2015-16 does not contain any qualifications, reservations or adverse remarks.
Cost Auditors Your Board has appointed M/s. Shome and Banerjee, 5A Nurulla Doctor Lane, 2nd Floor, Kolkata - 700 017 as cost auditors of the Company for conducting cost audit for the financial year 2016-17. The are requested to ratify the remuneration payable to the Cost Auditors for 2016-17.
Disclosure requirements The information on conservation of energy, technology absorption and foreign exchange earnings and outgo pursuant to Section 134(3)(m) of the Companies Act, 2013, read with Rule 8(3) of the Companies (s) Rules, 2014 is given in Annexure 6 attached to this report.
Concluding Remarks The Directors wish to convey their appreciation to all of the Company’s employees for their sincere and dedicated services as well as their collective contribution to the Company’s performance.
Mumbai, 24th May 2016
On behalf of the Board of Directors
Cyrus P Mistry Chairman
67
Annual Report 2015-16
•
Connect with every sip
Annexure 1 to Directors’ Report Annual Report on CSR Activities 1.
A brief outline of the company’s CSR policy, including overview of projects or programs proposed to be undertaken and a reference to the web-link to the CSR policy and projects or programs: Natural Beverages Policy Tata Global Beverages (TGB) is committed to be the most ired natural beverage company in the world by making a big and lasting difference through Sustainability and Corporate Social Responsibility. We shall achieve this by being the consumer’s first choice in sustainable beverage production and consumption. TGB shall focus on Climate Change, Water Management, Sustainable Sourcing, Waste Management and Community Development. Towards community development, we shall undertake programs focused on education and skills, healthcare and women empowerment. We shall actively participate in TATA Group activities and programs for volunteering and affirmative action. We shall achieve this by being knowledgeable, responsive and trustworthy, and by adopting environmentally and socially-friendly technologies, business practices and innovation, while pursuing long-term growth aspirations and the enhancement of stakeholder value. The Corporate Social Responsibility (CSR) Policy of the Company is available at http://www.tataglobalbeverages. com/docs/default-source/default-document-library/ corporate-social-responsibility-policy7214b6881a2368caa6 5dff02001c5be1.pdf?sfvrsn=0 Overview of projects implemented during 2015-16 as identified for the purpose of Section 135 of the Companies Act, 2013: Education • Srishti is a welfare centre for the differently abled in Munnar, Kerala. Srishti is the umbrella under which Tata Global Beverages is enabling learning and economic opportunities for differently-abled youth, through its training and rehabilitation initiatives in Munnar. Set up in 1991, Srishti has five projects: The DARE (Development Activities in Rehabilitative Education) School, DARE Strawberry Unit, Athulya (handmade paper and paper products), Aranya (natural dye project) and The Deli (confectionery unit). The welfare centre serves differently-abled children of the of the plantation community. TGB s the welfare centre by sponsoring the operational expenses. Healthcare • Providing affordable healthcare has always been a key community intervention for TGB. The Referral Hospital and Research Centre (RHRC) Chubwa in Assam provides free or subsidized medical facilities
68
to general population and the tea communities. New medical specialities, namely, Orthopaedics, Neurosurgery and Physiotherapy have been introduced at the hospital. The eHub, located at RHRC for the e-Healthcare Project in collaboration with Hewlett Packard, has been completed and gone live. During FY 2015-16, the hospital has treated a total of 38,660 patients (OPD & IPD). TGB’s CSR contribution to the hospital is ed for by covering the deficit incurred by the hospital. • TGB s the St. Jude’s India Child Care Centres to extend help to the cancer affected children. St Judes provides needy children under treatment for cancer with a clean, safe, hygienic place to stay, nutritional , transportation to hospital for treatment, as well as recreation, education and counselling. Skill Development • TGB s Unnati (a Bangalore based NGO) in providing job oriented training for youth from the under privileged communities. Unnati has provided training and placement of 182 youths from the under privileged communities in FY 15-16. Women Empowerment • The UNICEF-ETP project aims to promote child rights and reduce their vulnerability to trafficking and abuse in the 3 districts of Assam (Dibrugarh, Sivasagar, Tinsukia). The first year of the project has seen the successful implementation at 87 tea gardens, all of which now have active Adolescent Girls’ Groups (AGG) and Child Protection Committees (C). Across these estates and the local communities, nearly 14,000 girls have been reached. TGB co-funds the cost of the program that includes awareness creation and on-ground implementation of the programme to prevent human trafficking. • TGB is ing Concern India Foundation for livelihood opportunities for rural women in 1100 families of 11 villages from Haveri and Ranebennur districts in Karnataka. Affirmative Action TGB has a clear focus and strategic approach towards driving Affirmative Action (AA). This means that the organisation is committed to directly conducting and ing initiatives for socially and economically disadvantaged sections in the country at large, and in particular the AA initiatives are specifically focused on the Scheduled caste and Scheduled tribe communities in India. The Tata Affirmative Action programme has defined criteria and the processes are driven through 4Es – Employment, Employability, Entrepreneurship and Education. Rural Infrastructure TGB has funded rural infrastructure upgradation in Dhaulakuwan, District Sirmour, Himachal Pradesh during the financial year 2015-16.
Corporate Overview 01-48
2.
Composition of the CSR Committee TGBL has constituted a robust governance structure to oversee the implementation of the CSR projects, in compliance with the requirements of Section 135 of the Companies Act, 2013. The CSR governance structure of TGBL will be headed by the Board CSR Committee. The Board CSR Committee grants auxiliary power to the Working Committee of the Company to act on their behalf. The CSR Committee of the Board comprises of the following : a. Ranjana Kumar (Mrs.) (Chairperson) b. V. Leeladhar c. S. Santhanakrishnan
c.
Financial Statements 125-220
Statutory Reports 49-124
d. Ajoy Misra e. Prof. S. Parasuraman (Expert Member) Average net profit of the company for last three 3. financial years: Rs. 224.85 Crores 4. Prescribed CSR Expenditure (two per cent of the amount as in item 3 above): Rs. 4.50 Crores 5. Details of CSR spent during the financial year : a. Total amount to be spent for the financial year: Rs. 4.50 Crores b. Total amount spent during the financial year: Rs. 5.53 Crores (2.46% of average net profit) Amount unspent, if any : Nil
Manner in which the amount spent during the financial year is detailed below:
Sl. CSR Project or Activity Identified No.
Relevant Section of Schedule VII in which the project is covered
Projects or programs (1) Local area or other (2) Specify the State and District where projects or programs was undertaken
1 2
Skill Development training to AA Youth Skill Development training to differently abled Affordable healthcare for all
(ii) (ii)
Bangalore,Karnataka Munnar, Kerala
(i)
Chubwa, Assam
2.25
2.87
(iii) (ii)
Assam Chennai
0.50 0.12
0.49 0.12
6
Creating Awareness on human trafficking Enhancing skills of women in up cycling of laminates ing Cancer affected children
(i)
Kolkata
0.22
0.20
7
Providing rural infrastructure
(x)
-
0.05
8
Formation and strengthening of women self-help groups
(iii)
Paonta Sahib, Himachal Pradesh Haveri, Karnataka
0.04
0.06
4.69
5.53
3 4 5
Schedule VII (i) Eradicating hunger, poverty and malnutrition, promoting preventive health care and sanitation and making available safe drinking water; (ii) Promoting education, including special education and employment enhancing vocation skills especially among children, women, elderly, and the differently abled and livelihood enhancement projects; (iii) Promoting gender equality, empowering women, setting up homes and hostels for women and orphans; setting up old age homes, day care centres and such other facilities for senior citizens and measures for reducing inequalities faced by socially and economically backward groups. (x) Rural Infrastructure
Amount Outlay (Budget) Project or program wise (Rs. in Crores) 0.26 1.30
Amount spent on the projects or program subheads
Cumulative Expenditure upto the reporting period
Amount Spent: Direct or through Implementing agency
(Rs. in Crores) (Rs. in Crores) 0.22 0.22 Unnati 1.52 1.52 Direct 2.87 Associate Company 0.49 UNICEF and ETP 0.12 Exanora 0.20 ST Jude’s Child Care Centres 0.05 Government of H.P. 0.06 Concern India Foundation 5.53
CSR Committee responsibility statement Through this report, TGBL seeks to communicate its commitment towards CSR to the Ministry of Corporate Affairs. The implementation and monitoring of our CSR Policy is in compliance with the CSR objectives and policies as laid down in this report. The Board of the Company and the CSR Committee is responsible for the integrity and the objectivity of all the information provided in the disclosure above.
Ajoy Misra Chief Executive Officer and Managing Director Mumbai, 24th May 2016
Ranjana Kumar Chairperson, CSR Committee
69
Annual Report 2015-16
•
Connect with every sip
Annexure 2 to Directors’ Report Particulars of Employees The information required under Section 197 of the Companies Act, 2013 read with Rule 5(1) of the (Companies Appointment and Remuneration of Managerial Personnel) Rules, 2014 are given below: a)
The ratio of the remuneration of each director to the median remuneration of the employees of the Company for the financial year: Non- Executive Directors Mr. Cyrus P Mistry Mr. Harish Bhat Mrs. Mallika Srinivasan Mr. Analjit Singh Mr. V Leeladhar Mrs. Ranjana Kumar Mr. Darius Pandole Mr. S Santhanakrishnan Mrs. Ireena Vittal
Ratio to median remuneration* 1.79 2.97 10.35 3.75 54.48 41.81 36.31 25.96 26.36
Executive Directors
Ratio to median remuneration*
Mr. Ajoy Misra
229.68
Mr. L KrishnaKumar
205.23
*Median salary computation is based on a total employee head count of 2,552 of which approximately 2,000 employees are within collective bargaining process. b)
The percentage increase in remuneration of each Director, Chief Executive Officer, Chief Financial Officer, Company Secretary in the financial year: Directors, Chief Executive Officer, Chief Financial Officer and Company Secretary Mr. Cyrus P Mistry# Mr. Harish Bhat # Mrs. Mallika Srinivasan Mr. Analjit Singh Mr. V Leeladhar Mrs. Ranjana Kumar Mr. Darius Pandole Mr. S Santhanakrishnan Mrs. Ireena Vittal Mr. Ajoy Misra, Chief Executive Officer and Managing Director** Mr. L KrishnaKumar, Executive Director and Group CFO** Mr. John Jacob, Chief Financial Officer*** Mr. V Madan, Company Secretary
% increase in remuneration in the financial year^ 47% 18% 1% (47%) 5% 13% 18% (3%) 18% 12% 8% 13%
^ For the purposes of these computations, incentive remuneration has been considered based on accruals and payments relating to earlier years have been excluded.
# Mr. Cyrus P Mistry and Mr. Harish Bhat draw only sitting fees from the Company.
** Compensation paid from a Subsidiary Company in UK has also been considered for computation of the increase.
***Appointed as CFO for a part of the year in FY 2014-15 and hence remuneration numbers are not comparable.
70
Corporate Overview 01-48
Financial Statements 125-220
Statutory Reports 49-124
c)
The percentage increase in median remuneration of employees in the financial year: 8%
d)
The number of permanent employees on the rolls of the Company: 2,552
e)
The explanation on the relationship between average increase in remuneration and Company performance:
On an average, employees (excluding unionised staff ) received an annual increase of around 12%. The increase in remuneration is in line with current market trends. In order to ensure that remuneration reflects Company performance, the performance pay is linked to both individual performance rating and business performance.
f )
Comparison of the performance of the key managerial personnel against the performance of the Company:
In line with Company’s remuneration policy, salary increases and annual bonus pay-outs of its employees including key managerial personnel are directly linked to individual performance as well as Company’s performance. The remuneration to key managerial personnel in addition to these factors also takes into various other parameters as decided and approved by Nomination and Remuneration Committee.
g)
Variations in the market capitalisation of the Company, price earnings ratio as at the closing date of the current financial year and previous financial year: Particulars Market Capitalisation (Rs. Crores)
h)
Price Earnings Ratio* * Based on consolidated performance
March 31 2016
March 31, 2015
% Change
7652.45
9201.77
(16.84%)
23.50
37.86
(37.93%)
Percentage increase over decrease in the market quotations of the shares of the Company in comparison to the rate at which the Company came out with the last public offer: Particulars Market Price (Rs.)*
March 31 2016
Issue price at last IPO
% Change
121.25
1
12025%
*Face value of share was sub-divided to Re. 1 from Rs. 10 on 2nd July 2010.
i)
Average percentile increase already made in the salaries of employees other than the managerial personnel in the last financial year and its comparison with the percentile increase in the managerial remuneration and justification thereof and point out if there are any exceptional circumstances for increase in the managerial remuneration:
Average percentage increase for other than managerial personnel (excluding unionised staff ) works to around 12%. The percentage increase for all employees was 10%. Increase in the managerial remuneration was 10% (including compensation paid from a Subsidiary Company in the UK). Percentage increases for various categories are granted based on market trends and performance criteria.
71
Annual Report 2015-16
j)
•
Connect with every sip
Comparison of each remuneration of the key managerial personnel against the performance of the Company: Particulars
Remuneration (Rs. Crores) Standalone Revenue (Rs. Crores) Remuneration as a % of Standalone Revenue Standalone Earnings Before Interest and Tax (Rs. Crores) Remuneration as a % of Standalone Earnings Before Interest and Tax Consolidated Revenue (Rs. Crores) Remuneration as a % of Consolidated Revenue Consolidated Earnings Before Interest and Tax (Rs. Crores) Remuneration as a % of Consolidated Earnings Before Interest and Tax
Mr Ajoy Misra CEO and Managing Director
Mr L KrishnaKumar Executive Director and Group CFO
Mr John Jacob CFO
Mr V Madan Company Secretary
2.82
2.52
1.44
1.11
0.05
0.03
0.45
0.35
0.02
0.01
0.27
0.21
3190.49 0.09
0.08 319.44
0.88
0.79
0.03
0.03
8181.11
531.73 0.53
0.47
k)
The key parameters for any variable component of remuneration availed by directors:
The variable pay for the directors is recommended by the Nomination and Remuneration Committee based on the actual performance of the organisation against the performance criteria laid down in addition to the evaluation of directors’ personal contribution.
l)
The ratio of the remuneration of the highest paid director to that of the employees who are not directors but receive remuneration in excess of the highest paid director during the year: None.
m)
Affirmation that the remuneration is as per the remuneration policy of the Company:
The Company affirms that the remuneration is as per the remuneration policy of the Company.
n)
The statement containing particulars of employees as required under Section 197(12) of the Companies Act, 2013 (“the Act”) read with Rule 5(2) of the Companies (Appointment and Remuneration of Managerial Personnel) Rules, 2014, is provided in a separate annexure forming part of this report . However, the report and the s are being sent to the excluding the aforesaid annexure. In of Section 136 of the Act, the said annexure is open for inspection at the ed Office of the Company. Any shareholder interested in obtaining a copy of the same may write to the Company Secretary.
o)
Disclosure under Section 197(14) of the Companies Act, 2013:
Mr. Ajoy Misra, Managing Director and Mr. L. KrishnaKumar, Executive Director, received remuneration of Rs. 65.35 Lakhs and Rs.42.39 Lakhs respectively from the Company’s overseas subsidiary, Tata Global Beverages (GB) Ltd. during the year 2015-16. (The remuneration drawn in GBP has been converted into INR at average exchange rate). On behalf of the Board of Directors
Mumbai 24th May 2016
72
Cyrus P Mistry Chairman
Corporate Overview 01-48
Statutory Reports 49-124
Financial Statements 125-220
Annexure 3 to Directors’ Report Particulars of Investment made and Guarantee/Loan given during the year: Particulars of Investment made, Guarantee given and Loan given
Name of the Entity
Investments
NourishCo Beverages Limited
13.00
Tata Starbucks Private Limited
28.00
Zhejiang Tata Tea Extractions Limited#
33.54
Mutual Funds - Net
Amount Purpose for which Loan,Guarantee is (Rs. in Crores) proposed to be utilised by recipient
Not Applicable
162.50
Guarantee
Zhejiang Tata Tea Extractions Limited
3.41 Corporate Guarantees were issued against loans drawn by a Subsidiary Company from banks as working capital loans and term debts
Inter Corporate Deposits
Kerala Ayurveda Limited^
4.75
Casa Décor Private Limited*^
5.00
Taj Air Limited^
7.50
Tata Housing Limited*
Cash Management / Trade Deposits
50.00
# Loans converted into Equity * Given and repaid during the year ^ Renewed during the year
On behalf of the Board of Directors
Mumbai 24th May 2016
Cyrus P Mistry Chairman
73
Annual Report 2015-16
•
Connect with every sip
ANNEXURE 4 TO DIRECTORS’ REPORT FORM NO. MR-3 SECRETARIAL AUDIT REPORT FOR THE FINANCIAL YEAR ENDED 31st MARCH 2016 [Pursuant to Section 204(1) of the Companies Act, 2013 and Rule No.9 of the Companies (Appointment and Remuneration of Personnel) Rules, 2014] To, The , Tata Global Beverages Limited 1, Bishop Lefroy Road Kolkata – 700 020 I have conducted the secretarial audit of the compliance of applicable statutory provisions and the adherence to good corporate practices by Tata Global Beverages Limited, (hereinafter called the Company). Secretarial Audit was conducted in a manner that provided me a reasonable basis for evaluating the corporate conduct/statutory compliances and expressing my opinion thereon. Based on my verification of the Company’s books, papers, minute books, forms and returns filed and other records maintained by the Company and also the information provided by the Company, its officers, agents and authorised representatives during the conduct of secretarial audit, I hereby report that in my opinion, the company has, during the audit period covering the financial year ended on 31st March, 2016 complied with the statutory provisions listed hereunder and also that the Company has proper Board-processes and compliance-mechanism in place to the extent, in the manner and subject to the reporting made hereinafter: I have examined the books, papers, minute books, forms and returns filed and other records maintained by Tata Global Beverages Limited for the financial year ended on 31st March 2016 according to the provisions as may be applicable to the Company of:
b.
The Securities and Exchange Board of India (Prohibition of Insider Trading) Regulations, 2015;
c.
The Securities and Exchange Board of India (Listing Obligations And Disclosure Requirements) Regulations, 2015;
d.
The Securities and Exchange Board of India (Issue and Listing of Debt Securities) Regulations, 2008;
e.
The Securities and Exchange Board of India (Issue of Capital and Disclosure Requirements) Regulations, 2009;
f.
The Securities and Exchange Board of India (Share Based Employee Benefits) Regulations, 2014: Not applicable during the period under review.
g.
The Securities and Exchange Board of India (Registrars to an Issue and Share Transfer Agents) Regulations, 1993 regarding the Companies Act and dealing with client: Not applicable during the period under review as the Company is not acting as a Registrar and Share Transfer Agent.
h.
The Securities and Exchange Board of India (Delisting of Equity Shares) Regulations, 2009: Not applicable during the period under review.
i.
The Securities and Exchange Board of India (Buyback of Securities) Regulations, 1998: Not applicable during the period under review.
The Food Safety and Standards Act, 2006 along with Food Safety and Standards Rules 2011;
(i)
The Companies Act, 2013 (the Act) and the rules made thereunder;
(vi)
(ii)
The Securities Contracts (Regulation) Act, 1956 (‘SCRA’) and the rules made thereunder;
(vii) The Tea Board Guidelines and Orders;
(iii)
The Depositories Act, 1996 and the Regulations and Bye-laws framed thereunder;
(iv)
Foreign Exchange Management Act, 1999 and the rules and regulations made thereunder;
(v)
The following Regulations and Guidelines prescribed under the Securities and Exchange Board of India Act, 1992 (‘SEBI Act’);
a.
74
The Securities and Exchange Board of India (Substantial Acquisition of Shares and Takeovers) Regulations, 2011;
(viii) Pollution Control Act, Rules and Notification issued thereof; (ix)
Legal Metrology Act, 2009 and Rules made thereunder;
(x) The Tea Act, 1953 and Tea Warehouse (Licensing) Order, 1989; (xi) The Factories Act, 1948 and Rules made thereunder; (xii)
Shops and Establishment Act, 1953;
(xiii) The Employees Provident Fund and Miscellaneous Provisions Act, 1952 and Rules made thereunder; (xiv) The Maternity Benefits Act, 1961;
Corporate Overview 01-48
(xv)
The Minimum Wages Act, 1948;
(xvi) The Payment of Bonus Act, 1965; (xvii) The Payment of Gratuity Act, 1972; (xviii) The Employment Exchange (Compulsory Notification of Vacancies) Act, 1959; (xix) The Payment of wages Act, 1936 and other applicable Industrial and Labour Laws. I have also examined compliance of Secretarial Standards on Board of Directors (SS-1) and General Meetings (SS-2) issued by the Institute of Company Secretaries of India and made effective from 1st July, 2015. During the period under review, the Company has complied with the provisions of the Act, Rules, Regulations, Guidelines, Standards, etc. mentioned above. I further report that The Board of Directors of the Company is duly constituted with proper balance of Executive Directors, Non-Executive Directors and Independent Directors. No changes has taken place in the composition of the Board of Directors during the period under review. Adequate notice is given to all the directors to schedule the Board Meetings, agenda and detailed notes on agenda were sent at least seven days in advance, and a system exists for seeking and obtaining further information and clarifications
Statutory Reports 49-124
Financial Statements 125-220
on the agenda items before the meeting and for meaningful participation at the meeting. The Resolutions ed by the Board of Directors and Committees thereof had no dissenting views which were required to be captured and minuted. I further report that there are adequate systems and processes in the Company commensurate with the size and operations of the Company to monitor and ensure compliance with applicable laws, rules, regulations and guidelines. I also report that with regard to Amalgamation of Mount Everest Mineral Water Limited with the Company, on the basis of Scheme of Amalgamation as approved by both the Hon’ble High Courts at Calcutta and Himachal Pradesh (Shimla) Effective Date of the Amalgamation /Merger was 18th May 2015 on submission of requisite Form with the Registrar of Companies, West Bengal as well as Himachal Pradesh. Accordingly, the Equity Shares of the Company were allotted thereafter to the Equity Shareholders of the Transferor Company as per the said scheme and also Listed with the Company’s concerned stock exchanges.
12th May 2016
Dr. Asim Kumar Chattopadhyay Practising Company Secretary FCS No. 2303 Certificate of Practice No. 880
Annexure “A” (TO THE SECRETARIAL AUDIT REPORT OF TATA GLOBAL BEVERAGES LIMITED FOR THE FINANCIAL YEAR ENDED 31st MARCH 2016) To, The Tata Global Beverages Limited 1, Bishop Lefroy Road Kolkata 700 020 My Report for the financial year ended 31st March 2016 of even date is to be read along with this letter. 1.
2.
Maintenance of secretarial records is the responsibility of the management of the Company. My responsibility is to express an opinion on these secretarial records based on my audit. I have followed the audit practices and processes as were appropriate to obtain reasonable assurance about the correctness of the contents of the secretarial records. The verification was done on test basis to ensure that correct facts are reflected in secretarial records. I believe that the processes and practices, I followed provide a reasonable basis for my opinion.
3.
I have not verified the correctness and appropriateness of financial records and Books of s of the Company.
4.
Wherever required, I have obtained the management representation about the compliance of laws, rules and regulations and happening of events etc.
5.
The compliance of the provisions of Corporate and other applicable laws, rules, regulations, standards is the responsibility of management. My examination was limited to the verification of procedures on test basis.
6.
The Secretarial Audit Report is neither an assurance as to the future viability of the Company nor of the efficacy or effectiveness with which the management has conducted the affairs of the Company.
12th May 2016
Dr. Asim Kumar Chattopadhyay Practising Company Secretary FCS No. 2303 Certificate of Practice No. 880
75
Annual Report 2015-16
•
Connect with every sip
ANNEXURE 5 TO DIRECTORS’ REPORT Form No. MGT-9 Extract Of Annual Return As on the financial year ended on 31st March 2016 [Pursuant to Section 92(3) of the Companies Act, 2013 and Rule 12(1) of the Companies (Management and istration) Rules, 2014]
I.
REGISTRATION AND OTHER DETAILS i)
CIN
L15491WB1962PLC031425
ii)
Registration Date
18th October 1962
iii)
Name of the Company
Tata Global Beverages Limited
iv)
Category / Sub Category of the Company
Company Limited by shares / Indian Non Government Company
v)
Address of the ed office and details
1, Bishop Lefroy Road, Kolkata – 700 020 Tel: 033-22836917 Fax: –22833032 Email: [email protected]
vi)
Whether listed company (Yes / No)
Yes
vii)
Name, Address and details of Registrar TSR Darashaw Limited and Transfer Agent, if any 6-10 Haji Moosa Patrawala Ind. Estate 20 Dr. E Moses Road, Mahalaxmi Mumbai – 400 011 Telephone : 022-66568484 Fax : 022-66568494 Website : www.tsrdarashaw.com E-mail : [email protected]
II.
PRINCIPAL BUSINESS ACTIVITIES OF THE COMPANY
(All the business activities contributing 10% or more of the total turnover of the company shall be stated)
III.
Sl. No.
Name and Description of main products /services
1
Processing and blending of tea including manufacture of Instant tea
NIC Code of the Product/ service
% to total turnover of the Company
NIC Code 107921
98.96
PARTICULARS OF HOLDING, SUBSIDIARY AND ASSOCIATE COMPANIES Sl. No.
Name and Address of the Company
CIN/GLN
1
Tata Global Beverages Group Limited 325 Oldfield Lane North, Greenford, Middlesex, UB6 0AZ, UK Tata Global Beverages Holdings Limited 325 Oldfield Lane North, Greenford, Middlesex, UB6 0AZ, UK Tata Global Beverages Services Limited 325 Oldfield Lane North, Greenford, Middlesex, UB6 0AZ, UK Tata Global Beverages GB Limited 325 Oldfield Lane North, Greenford, Middlesex , UB6 0AZ, UK
N.A.
Holding/ Subsidiary/ Associate Subsidiary
N.A.
2
3
4
76
% of shares held
Applicable Section
88.65
2 (87)
Subsidiary
100
2 (87)
N.A.
Subsidiary
100
2 (87)
N.A.
Subsidiary
100
2 (87)
Corporate Overview 01-48
Sl. No.
Name and Address of the Company
5
Tata Global Beverages Overseas Holdings Limited 325 Oldfield Lane North, Greenford, Middlesex , UB6 0AZ, UK Tata Global Beverages Overseas Limited 325 Oldfield Lane North, Greenford, Middlesex , UB6 0AZ, UK Lyons Tetley Limited 325 Oldfield Lane North, Greenford, Middlesex , UB6 0AZ, UK Drassington Limited 325 Oldfield Lane North, Greenford, Middlesex , UB6 0AZ, UK Teapigs Limited 325 Oldfield Lane North, Greenford, Middlesex , UB6 0AZ, UK Teapigs US LLC 195 Chrystie Street, #602E, New York, New York 10002 Stansand Limited 325 Oldfield Lane North, Greenford, Middlesex , UB6 0AZ, UK Stansand (Brokers) Limited 325 Oldfield Lane North, Greenford, Middlesex , UB6 0AZ, UK Stansand (Africa) Limited 3rd Floor Tea House, Nyerere Abenue P. O. Box 90683-80100 Mombasa, Kenya Stansand (Central Africa) Limited Along Masauko Chipembere Highway-Maselema AreaLimbe, P. O. Box 546, Blantyre, Malawi Joekels Tea Packers (Proprietary) Limited Joekels 12 Caversham Road Pinetown 3610 Kwazulu Natal South Africa Tata Global Beverages Polska Sp.zo.o. UL Zolny 33 02-815 Warszawa, Poland Tata Global Beverages Czech Republic a.s. Znojemska 687 675 31 Jemnice Czech Republic Tata Global Beverages US Holdings Inc. 155 Chestnut Ridge Road, Montvale, New Jersey 07645 Tetley USA Inc. 155 Chestnut Ridge Road, Montvale, New Jersey 07645 Good Earth Corporation 155 Chestnut Ridge Road, Montvale, New Jersey 07645 Good Earth Teas Inc. 155 Chestnut Ridge Road, Montvale, New Jersey 07645
6
7
8
9
10
11
12
13
14
15
16
17
18
19
20
21
Statutory Reports 49-124
CIN/GLN
Financial Statements 125-220
N.A.
Holding/ Subsidiary/ Associate Subsidiary
% of shares held
Applicable Section
100
2 (87)
N.A.
Subsidiary
100
2 (87)
N.A.
Subsidiary
100
2 (87)
N.A.
Subsidiary
100
2 (87)
N.A.
Subsidiary
100
2 (87)
N.A.
Subsidiary
100
2 (87)
N.A.
Subsidiary
100
2 (87)
N.A.
Subsidiary
100
2 (87)
N.A.
Subsidiary
100
2 (87)
N.A.
Subsidiary
100
2 (87)
N.A.
Subsidiary
51
2 (87)
N.A.
Subsidiary
100
2 (87)
N.A.
Subsidiary
100
2 (87)
N.A.
Subsidiary
100
2 (87)
N.A.
Subsidiary
100
2 (87)
N.A.
Subsidiary
100
2 (87)
N.A.
Subsidiary
100
2 (87)
77
Annual Report 2015-16
Sl. No.
Name and Address of the Company
22
Tata Global Beverages Canada Inc. 10 Carlson street, Etobicoke, Ontario M9W6L2, Canada Tata Global Beverages Australia Pty. Limited 620 Church Street, Richmond, Victoria, Australia 3121 Earth Rules Pty. Limited 620 Church Street, Richmond, Victoria, Australia 3121 Tata Global Beverages Investments Limited 325 Oldfield Lane North, Greenford, Middlesex, UB6 0AZ, UK Campestres Holdings Limited Capital Center, 9th Floor, 2-4 Makarios Avenue, 1065 Nicosia, Cyprus Kahutara Holdings Limited Capital Center, 9th Floor, 2-4 Makarios Avenue, 1065 Nicosia, Cyprus Suntyco Holding Limited Capital Center, 9th Floor, 2-4 Makarios Avenue, 1065 Nicosia, Cyprus Onomento Co. Limited Capital Center, 9th Floor, 2-4 Makarios Avenue, 1065 Nicosia, Cyprus OOO Sunty LLC Prospect Mira Street, 69 Building 1, Moscow, 129110, Russian Federation OOO Tea Trade LLC Prospect Mira Street, 69 Building 1, Moscow, 129110, Russian Federation Tata Global Beverages Capital Limited 325 Oldfield Lane North, Greenford, Middlesex, UB6 0AZ, UK Tata Coffee Ltd Pollibetta, Kodagu, Karnataka Consolidated Coffee Inc. 155 Chestnut Ridge Road, Montvale, New Jersey 07645 Eight ‘O Clock Holdings Inc. 155 Chestnut Ridge Road, Montvale, New Jersey 07645 Eight ‘ O Clock Coffee Company 155 Chestnut Ridge Road, Montvale, New Jersey 07645 Tata Tea Extractions Inc 1001 W Dr M L King Jr Blvd Plant City, FL 33563, USA Zhejiang Tata Tea Extraction Co. Limited Economic Development Zone, Anji, Zhejiang, China
23
24
25
26
27
28
29
30
31
32
33
34
35
36
37
38
78
CIN/GLN
•
Connect with every sip
N.A.
Holding/ Subsidiary/ Associate Subsidiary
% of shares held
Applicable Section
100
2 (87)
N.A.
Subsidiary
100
2 (87)
N.A.
Subsidiary
100
2(87)
N.A.
Subsidiary
100
2 (87)
N.A.
Subsidiary
100
2 (87)
N.A.
Subsidiary
65
2 (87)
N.A.
Subsidiary
100
2 (87)
N.A.
Subsidiary
100
2 (87)
N.A.
Subsidiary
100
2 (87)
N.A.
Subsidiary
100
2 (87)
N.A.
Subsidiary
100
2 (87)
L01131KA1943PLC000833
Subsidiary
57.48
2 (87)
N.A.
Subsidiary
100
2 (87)
N.A.
Subsidiary
100
2 (87)
N.A.
Subsidiary
100
2 (87)
N.A.
Subsidiary
100
2 (87)
N.A.
Subsidiary
81.46
2 (87)
Corporate Overview 01-48
Sl. No.
Name and Address of the Company
39
Tata Tea Holdings Private Limited 4th Floor, New Excelsior Building, Amrit Keshav Nayak Marg, Fort, Mumbai – 400 001 RBC Hold Co LLC $ 1614, 15th Street Suite 200 Denver, CO 80202 USA TRIL Constructions Limited Elphinstone Building, 2nd Floor, 10 Veer Nariman Road, Mumbai - 400 001
U67190MH2008PTC187767
Holding/ Subsidiary/ Associate Subsidiary
N.A.
Mount Everest Mineral Water Limited* Village Dhaula Kuan , District Sirmour-173 025 Himachal Pradesh , India Estate Management Services Private Ltd No.60, Dharmapala Mawatha, Colombo 03 Amalgamated Plantations Private Ltd 1, Bishop Lefroy Road, Kolkata – 700 020 Kanan Devan Hills Plantations Private Ltd KDHP House, Munnar, Kerala- 685612 B Jets Pte. Limited # 80, Raffles Place, #32-01 UOB, Plaza 1, Singapore-048624 Empirical Group, LLC 155 Chestnut Ridge Road, Montvale, New Jersey 07645 NourishCo Beverages Limited 3B, DLF Corporate Park ‘S’ Block Phase 3 Gurgaon 122002 Haryana Tata Starbucks Private Limited 4th Floor, New Excelsior Building, Amrit Keshav Nayak Marg Fort, Mumbai – 400 001 Tetley ACI (Bangladesh) Limited 245 Tejgaon Industrial Area, Dhaka - 1208 Southern Tea, LLC 1267 Cobb Industrial Drive, Marietta, Georgia 30066 Tetley Clover (Private) Limited Lakson Square Building No 2 Sarwar Shaheed Road, Karachi
40
41
42
43
44
45
46
47
48
49
50
51
52
Statutory Reports 49-124
CIN/GLN
Financial Statements 125-220
% of shares held
Applicable Section
100
2 (87)
Subsidiary
59.89
2 (87)
U45201MH2007PLC171985
Subsidiary
50.12@
2 (6)
L15543HP1991PLC019065
Subsidiary
50.07
2 (87)
N.A.
Associate
31.85
2 (6)
U01132WB2007PTC112852
Associate
41.03
2 (6)
U01132KL2005PTC018014
Associate
28.52
2 (6)
N.A.
Associate
49.31
2 (6)
N.A.
t Venture
56.00
2 (6)
U15500HR2010PLC041616
t Venture
50
2 (6)
U74900MH2011PTC222589
t Venture
50
2 (6)
N.A.
t Venture
50
2 (6)
N.A.
t Venture
50
2( 6)
N.A.
t Venture
50
2 (6)
% of shares held shown above is by the immediate Holding Company $ Dissolved during 2015-16 # Ceased to be ed as an Associate Company since 2014-15 * Amalgamated with the Company w.e.f. 18.05.2015 (Appointed date 1st April 2013) @ Includes investments in Preference Shares
79
Annual Report 2015-16
•
Connect with every sip
IV.
SHARE HOLDING PATTERN (Equity Share Capital Breakup as percentage of Total Equity)
(i)
Category-wise Share Holding Category of Shareholders
A. Promoters (1) Indian a) Individuals/ HUF b) Central Government c) State Government(s) d) Bodies Corporate e) Banks / Financial Institutions f ) Any Other Sub-total (A)(1) (2) Foreign a) NRIs – Individuals b) Other – Individuals c) Bodies Corporate d) Banks / Financial Institutions e) Any other Sub-total(A)(2) Total shareholding of Promoter and Promoter Group (A) = (A)(1) + (A)(2) B. Public Shareholding 1. Institutions a) Mutual Funds/UTI b) Banks / Financial Institutions c) Central Government d) State Government(s) e) Venture Capital Funds f ) Insurance Companies g) Foreign Institutional Investors h) Foreign Venture Capital Funds i) Foreign Portfolio Investors (corporate) j) Others (specify) Sub -total (B)(1) 2. Non-Institutions a) Bodies Corporate b) Individuals i) Individual shareholders holding nominal share capital upto Rs. 1 Lakh ii) Individual shareholders holding nominal share capital in excess of Rs. 1 Lakh c) Qualified Foreign Investors d) Any Others (specify) (i) Trusts (ii) Directors and their relatives (iii) OCB’s/Foreign Cos (iv) Non-Resident Individuals (v) Foreign Bodies-DR (vi) Foreign Bodies (vii) Foreign Institutional Investors (viii) Foreign Nationals- DR Sub-Total(B)(2) Total Public Shareholding (B)=(B)(1)+ (B)(2) C. Shares held by Custodian for GDRs & ADRs Grand Total (A+B+C)
80
No. of Shares held at the beginning of the year Physical Total % of Demat Total Shares
Demat
No. of Shares held at the end of the year Physical Total % of Total Shares
% Change during the year
0 0 0 21,70,83,190 0 0 21,70,83,190
0 0 0 0 0 0 0 21,70,83,190 0 0 0 0 0 21,70,83,190
0.00 0 0.00 0 0.00 0 35.10 21,71,28,190 0.00 0 0.00 0 35.10 21,71,28,190
0 0 0 0 0 0 0 21,71,28,190 0 0 0 0 0 21,71,28,190
0.00 0.00 0.00 34.40 0.00 0.00 34.40
0.00 0.00 0.00 -0.70 0.00 0.00 -0.70
0 0 0 0 0 0 21,70,83,190
0 0 0 0 0 0 0 0 0 0 0 0 0 21,70,83,190
0.00 0 0.00 0 0.00 0 0.00 0 0.00 0 0.00 0 35.10 21,71,28,190
0 0 0 0 0 0 0 0 0 0 0 0 0 21,71,28,190
0.00 0.00 0.00 0.00 0.00 0.00 34.40
0.00 0.00 0.00 0.00 0.00 0.00 -0.70
2,49,90,354 5,61,35,315 3,53,281 0 0 37,43,054 10,59,09,066 0 1,91,78,855 0 21,03,09,925
90,690 2,50,81,044 96,270 5,62,31,585 5,850 3,59,131 0 0 0 0 0 37,43,054 8,260 10,59,17,326 0 0 0 1,91,78,855 0 0 2,01,070 21,05,10,995
4.05 4,24,26,761 9.09 7,98,12,436 0.06 3,53,281 0.00 0 0.00 0 0.61 39,36,673 17.13 2,95,81,793 0.00 0 3.10 5,38,99,882 0.00 0 34.04 21,00,10,826
1,34,715 4,25,61,476 62,845 7,98,75,281 5,850 3,59,131 0 0 0 0 0 39,36,673 8,260 2,95,90,053 0 0 0 5,38,99,882 0 0 2,11,670 21,02,22,496
6.74 12.66 0.06 0.00 0.00 0.62 4.69 0.00 8.54 0.00 33.31
2.69 3.56 0.00 0.00 0.00 0.02 -12.44 0.00 5.44 0.00 -0.73
1,46,30,622
2,61,470
1,48,92,092
2.41
1,46,94,821
2,79,940
1,49,74,761
2.37
-0.04
12,06,76,684
1,43,27,708
13,50,04,392
21.83
12,73,19,409
1,41,45,161
14,14,64,570
22.41
0.58
79,31,359
10,19,370
89,50,729
1.45
96,77,479
6,01,870
1,02,79,349
1.63
0.18
0
0
0
0.00
0
0
0
0.00
0.00
0.51 67,34,843 4,630 67,39,473 0.01 33,500 0 33,500 0.00 975 50,100 51,075 0.78 66,17,416 1,32,117 67,49,533 0.05 0 0 0 0.00 0 0 0 0.20 67,262 0 67,262 500 0 500 0.00 27.24 16,51,46,205 1,52,13,818 18,03,60,023 61.28 37,51,57,031 1,54,25,488 39,05,82,519 3.62 2,34,19,020 0 2,34,19,020 100.00 61,57,04,241 1,54,25,488 63,11,29,729
1.07 0.01 0.01 1.07 0.00 0.00 0.01 0.00 28.58 61.89 3.71 100.00
0.56 0.00 0.01 0.29 -0.05 0.00 -0.19 0.00 1.34 0.61 0.09 0.00
31,81,986 4,630 31,86,616 33,500 0 33,500 0 0 0 47,39,159 85,835 48,24,994 2,92,566 0 2,92,566 0 0 0 12,49,030 0 12,49,030 500 0 500 15,27,35,406 1,56,99,013 16,84,34,419 36,30,45,331 1,59,00,083 37,89,45,414 2,23,69,966 0 2,23,69,966 60,24,98,487 1,59,00,083 61,83,98,570
Corporate Overview 01-48
II.
Financial Statements 125-220
Statutory Reports 49-124
Shareholding of Promoters Sl. No.
Shareholder’s Name
Shareholding at the beginning of the year i.e. 01.04.2015 No. of % of total % of Shares Shares Shares Pledged / of the encumbered Company to total shares 14,28,54,570 23.10 1.86
1
Tata Sons Limited
2 3 4 5 6
Tata Chemicals Limited 4,31,75,140 Tata Investment Corporation Limited** 2,69,00,000 Ewart Investments Limited 34,16,360 Tata Industries Limited 7,31,120 Titan Company Limited 6,000 Total 21,70,83,190
6.98 4.35 0.55 0.12 0.00 35.10
Shareholding at the end of the year % change in i.e. 31.03.2016 shareholding during the No. of % of total % of Shares year* Shares Shares of the Pledged/ Company encumbered to total shares 14,28,54,570 22.63 1.86 - 0.47
0.00 4,31,75,140 0.00 2,69,45,000 0.00 34,16,360 0.00 7,31,120 0.00 6,000 1.86 21,71,28,190
6.84 4.27 0.54 0.12 0.00 34.40
0.00 0.00 0.00 0.00 0.00 1.86
- 0.14 - 0.08 - 0.01 0.00 0.00 - 0.70
*% change in Shareholding is consequent to increase in paid up share capital arising due to allotment of shares pursuant to the amalgamation of Mount Everest Mineral Water Limited with the Company.
III.
Change in Promoters’ Shareholding (please specify, if there is no change) Sl. No Name of Shareholder
Part of Promoter Group 1 Tata Investment Corporation Ltd**
Shareholding at the beginning of the year as on 01.04.2015 No. of shares % of total shares of the Company 2,69,00,000
Date
Reason
4.35 02.07.2015 Allotment 31.03.2016 At the year end
Increase / Decrease in Shareholding No. of % of total shares shares of the Company 45,000
0.00
Cumulative Shareholding during the year No. of % of total shares shares of the Company 2,69,45,000 2,69,45,000
4.27 4.27
** Increase in Shareholding is consequent to allotment of shares pursuant to the amalgamation of Mount Everest Mineral Water Limited with the Company.
Note: Except for the above there is no change in the holding of the Promoter and/ or Promoter Group during the Financial Year 2015 -16
81
Annual Report 2015-16
iv.
Shareholding Pattern of top ten Shareholders:
(other than Directors, Promoters and holders of GDRs and ADRs): Sl. No. Name of the Shareholder
1
2
82
Lic of India Child Fortune Plus Growth Fund Lic of India Profit Plus Balanced Fund Life Insurance Corporation of India Lic of India Money Plus Growth Fund Lic of India Market Plus 1 Growth Fund Life Insurance Corporation of India Ulif002180912licflx+Mix512 Life Insurance Corporation of India
Icici Prudential Mutual Fund Icici Prudential Fmcg Fund Icici Prudential Top 100 Fund Icici Prudential Long Term Equity Fund (Tax Saving) Icici Prudential Equity Arbitrage Fund Icici Prudential Balanced Advantage Fund Icici Prudential Midcap Fund Icici Prudential Blended Plan - Plan A Icici Prudential Dynamic Plan Icici Prudential Select Large Cap Fund Icici Prudential Nifty Next 50 Index Fund Icici Prudential Nifty 100 Etf Icici Prudential Value Fund Series 1 Icici Prudential Value Fund Series 2 Icici Prudential Value Fund-Series 5 Icici Prudential Equity Income Fund Icici Prudential Growth Fund-Series 8 Icici Prudential Value Fund - Series 6 Icici Prudential Value Fund - Series 7 Icici Prudential Business Cycle Fund Series 2
•
Connect with every sip
Cumulative Shareholding during the year
Shareholding No. of shares at the beginning of the Year (01.04.2015 / end of year 31.03.2016) 31,213,954
54,416,998 15,803,894
% of total shares of the Company
5.05
Date
Reason
Increase/ % of total shares Decrease of the in shareholding Company#
01-Apr-2015 10-Apr-2015 24-Apr-2015 01-May-2015 08-May-2015 15-May-2015 15-May-2015 22-May-2015 22-May-2015 05-Jun-2015 05-Jun-2015 12-Jun-2015 24-Jul-2015 31-Jul-2015 07-Aug-2015 14-Aug-2015 21-Aug-2015 04-Sep-2015 11-Sep-2015 18-Sep-2015 25-Sep-2015
Transfer Transfer Transfer Transfer Transfer Transfer Transfer Transfer Transfer Transfer Transfer Transfer Transfer Transfer Transfer Transfer Transfer Transfer Transfer Transfer
1,136,872 1,000,000 550,000 1,037,996 1,831,062 1,527,291 586,798 300,000 450,000 1,708,461 860,348 969,351 1,379,080 1,170,321 1,200,000 132,248 810,654 1,731,690 647,221 697,231
0.18 0.16 0.09 0.17 0.30 0.25 0.09 0.05 0.07 0.28 0.14 0.16 0.22 0.19 0.19 0.02 0.13 0.28 0.10 0.11
32,350,826 33,350,826 33,900,826 34,938,822 36,769,884 38,297,175 38,883,973 39,183,973 39,633,973 41,342,434 42,202,782 43,172,133 44,551,213 45,721,534 46,921,534 47,053,782 47,864,436 49,596,126 50,243,347 50,940,578
5.13 5.28 5.37 5.54 5.83 6.07 6.16 6.21 6.28 6.55 6.69 6.84 7.06 7.24 7.43 7.46 7.58 7.86 7.96 8.07
Transfer Transfer Transfer Transfer
445,000 1,356,420 775,000 900,000
0.07 0.22 0.13 0.15
51,385,578 52,741,998 53,516,998 54,416,998
8.14 8.36 8.48 8.62
Transfer Transfer Transfer Transfer Transfer Transfer Transfer Transfer Transfer Transfer Transfer Transfer Transfer Transfer Transfer Transfer Transfer Transfer Transfer Transfer Transfer Transfer Transfer Transfer Transfer
336 -323 250,000 150 640,000 228 421,419 108 23 305 428,000 -276,000 -264,680 -506,822 -652 -4,376 -14 568,245 351 594,815 -275 343,911 -150 2,207,627 -141
0.00 0.00 0.04 0.00 0.10 0.00 0.07 0.00 0.00 0.00 0.07 -0.04 -0.04 -0.08 0.00 0.00 0.00 0.09 0.00 0.10 0.00 0.06 0.00 0.36 0.00
15,804,230 15,803,907 16,053,907 16,054,057 16,694,057 16,694,285 17,115,704 17,115,812 17,115,835 17,116,140 17,544,140 17,268,140 17,003,460 16,496,638 16,495,986 16,491,610 16,491,596 17,059,841 17,060,192 17,655,007 17,654,732 17,998,643 17,998,493 20,206,120 20,205,979
2.50 2.50 2.54 2.54 2.65 2.65 2.71 2.71 2.71 2.71 2.78 2.74 2.69 2.61 2.61 2.61 2.61 2.70 2.70 2.80 2.80 2.85 2.85 3.20 3.20
30-Sep-2015 18-Mar-2016 25-Mar-2016 8.62 31-Mar-2016 2.56 01-Apr-2015 10-Apr-2015 17-Apr-2015 24-Apr-2015 24-Apr-2015 01-May-2015 01-May-2015 08-May-2015 08-May-2015 08-May-2015 15-May-2015 22-May-2015 22-May-2015 22-May-2015 29-May-2015 29-May-2015 05-Jun-2015 05-Jun-2015 12-Jun-2015 12-Jun-2015 19-Jun-2015 19-Jun-2015 26-Jun-2015 30-Jun-2015 03-Jul-2015 10-Jul-2015
No. of % of total shares shares of the Company#
Corporate Overview 01-48
Sl. No. Name of the Shareholder
Statutory Reports 49-124
Financial Statements 125-220
Cumulative Shareholding during the year
Shareholding No. of shares at the beginning of the Year (01.04.2015 / end of year 31.03.2016)
% of total shares of the Company
Date
Reason
Increase/ % of total shares Decrease of the in shareholding Company#
17-Jul-2015 17-Jul-2015 17-Jul-2015 24-Jul-2015 24-Jul-2015 24-Jul-2015 31-Jul-2015 31-Jul-2015 07-Aug-2015 07-Aug-2015 14-Aug-2015 14-Aug-2015 21-Aug-2015 21-Aug-2015 28-Aug-2015 04-Sep-2015 04-Sep-2015 11-Sep-2015 18-Sep-2015 25-Sep-2015 30-Sep-2015 30-Sep-2015 30-Sep-2015 09-Oct-2015 16-Oct-2015 16-Oct-2015 23-Oct-2015 23-Oct-2015 30-Oct-2015 06-Nov-2015 13-Nov-2015 13-Nov-2015 20-Nov-2015 20-Nov-2015 20-Nov-2015 20-Nov-2015 27-Nov-2015 27-Nov-2015 04-Dec-2015 11-Dec-2015 18-Dec-2015 25-Dec-2015 25-Dec-2015 31-Dec-2015 31-Dec-2015 31-Dec-2015 31-Dec-2015 08-Jan-2016 08-Jan-2016 15-Jan-2016 15-Jan-2016 15-Jan-2016 15-Jan-2016
Transfer Transfer Transfer Transfer Transfer Transfer Transfer Transfer Transfer Transfer Transfer Transfer Transfer Transfer Transfer Transfer Transfer Transfer Transfer Transfer Transfer Transfer Transfer Transfer Transfer Transfer Transfer Transfer Transfer Transfer Transfer Transfer Transfer Transfer Transfer Transfer Transfer Transfer Transfer Transfer Transfer Transfer Transfer Transfer Transfer Transfer Transfer Transfer Transfer Transfer Transfer Transfer Transfer
375,503 1,195,079 -1,096 2,640 7,958 -700,000 700,000 -356 299,916 -199 74 83 74 61,448 735 -73 62,835 305 496 -264 492,468 -96 -22 -573 480,000 446 -525 -9 440 185 115,606 171 345,910 788 19,223 194,199 226 132,491 -221 -556 4,865 149 -21,560 -393,867 -477 -237,586 -197,403 -100 -2,248 -473,372 240,000 529 -129,287
0.06 0.19 0.00 0.00 0.00 -0.11 0.11 0.00 0.05 0.00 0.00 0.00 0.00 0.01 0.00 0.00 0.01 0.00 0.00 0.00 0.08 0.00 0.00 0.00 0.08 0.00 0.00 0.00 0.00 0.00 0.02 0.00 0.06 0.00 0.00 0.03 0.00 0.02 0.00 0.00 0.00 0.00 0.00 -0.06 0.00 -0.04 -0.03 0.00 0.00 -0.08 0.04 0.00 -0.02
No. of % of total shares shares of the Company#
20,581,482 21,776,561 21,775,465 21,778,105 21,786,063 21,086,063 21,786,063 21,785,707 22,085,623 22,085,424 22,085,498 22,085,581 22,085,655 22,147,103 22,147,838 22,147,765 22,210,600 22,210,905 22,211,401 22,211,137 22,703,605 22,703,509 22,703,487 22,702,914 23,182,914 23,183,360 23,182,835 23,182,826 23,183,266 23,183,451 23,299,057 23,299,228 23,645,138 23,645,926 23,665,149 23,859,348 23,859,574 23,992,065 23,991,844 23,991,288 23,996,153 23,996,302 23,974,742 23,580,875 23,580,398 23,342,812 23,145,409 23,145,309 23,143,061 22,669,689 22,909,689 22,910,218 22,780,931
3.26 3.45 3.45 3.45 3.45 3.34 3.45 3.45 3.50 3.50 3.50 3.50 3.50 3.51 3.51 3.51 3.52 3.52 3.52 3.52 3.60 3.60 3.60 3.60 3.67 3.67 3.67 3.67 3.67 3.67 3.69 3.69 3.75 3.75 3.75 3.78 3.78 3.80 3.80 3.80 3.80 3.80 3.80 3.74 3.74 3.70 3.67 3.67 3.67 3.59 3.63 3.63 3.61
83
Annual Report 2015-16
Sl. No. Name of the Shareholder
4
5
Government Pension Fund Global
National Westminster Bank Plc As Depositary Of First State Asia Pacific Fund A Sub Fund Of First State Investments Icvc
National Insurance Company Ltd
22,401,478 7,692,045
Cumulative Shareholding during the year
% of total shares of the Company
3.55 1.24
Date
Reason
22-Jan-2016 12-Feb-2016 19-Feb-2016 19-Feb-2016 19-Feb-2016 19-Feb-2016 19-Feb-2016 19-Feb-2016 26-Feb-2016 04-Mar-2016 04-Mar-2016 11-Mar-2016 18-Mar-2016 18-Mar-2016 18-Mar-2016 18-Mar-2016 18-Mar-2016 25-Mar-2016 25-Mar-2016 25-Mar-2016 31-Mar-2016 01-Apr-2015
Transfer Transfer Transfer Transfer Transfer Transfer Transfer Transfer Transfer Transfer Transfer Transfer Transfer Transfer Transfer Transfer Transfer Transfer Transfer Transfer Transfer
-393 -100,000 623,258 423 100,000 60,000 200,000 20,000 -1,211 100,000 238 -651 140 11 -480,099 -200,000 -20,000 -36,680 -183,434 -100,000 -361,055
0.00 -0.02 0.10 0.00 0.02 0.01 0.03 0.00 0.00 0.02 0.00 0.00 0.00 0.00 -0.08 -0.03 0.00 -0.01 -0.03 -0.02 -0.06
No. of % of total shares shares of the Company#
22,780,538 22,680,538 23,303,796 23,304,219 23,404,219 23,464,219 23,664,219 23,684,219 23,683,008 23,783,008 23,783,246 23,782,595 23,782,735 23,782,746 23,302,647 23,102,647 23,082,647 23,045,967 22,862,533 22,762,533 22,401,478
3.61 3.59 3.69 3.69 3.71 3.72 3.75 3.75 3.75 3.77 3.77 3.77 3.77 3.77 3.69 3.66 3.66 3.65 3.62 3.61 3.55
18-Sep-2015
Transfer
42,000
0.01
7,734,045
1.23
Transfer
98,000
0.02
7,832,045
1.24
30-Sep-2015
Transfer
100,000
0.02
7,932,045
1.26
16-Oct-2015
Transfer
55,000
0.01
7,987,045
1.27
13-Nov-2015
Transfer
45,000
0.01
8,032,045
1.27
01-Jan-2016
Transfer
70,000
0.01
8,102,045
1.28
08-Jan-2016
Transfer
130,000
0.02
8,232,045
1.30
15-Jan-2016
Transfer
80,180
0.01
8,312,225
1.32
22-Jan-2016
Transfer
519,820
0.08
8,832,045
1.40
26-Feb-2016
Transfer
-150,000
-0.02
8,682,045
1.38
8,682,045
1.38
1.38
31-Mar-2016
4,992,566
0.81
01-Apr-2015 22-May-2015
Transfer
530,781
0.09
5,523,347
0.88
19-Jun-2015
Transfer
557,399
0.09
6,080,746
0.96
28-Aug-2015
Transfer
558,920
0.09
6,639,666
1.05
26-Feb-2016
Transfer
316,843
0.05
6,956,509
1.10
04-Mar-2016
Transfer
995,858
0.16
7,952,367
1.26
7,952,367
1.26
7,952,367
1.26
31-Mar-2016
7,005,780
1.13
01-Apr-2015
1.15
Increase/ % of total shares Decrease of the in shareholding Company#
25-Sep-2015
8,682,045
7,264,780
84
Connect with every sip
Shareholding No. of shares at the beginning of the Year (01.04.2015 / end of year 31.03.2016)
3
•
10-Apr-2015
Transfer
100,000
0.02
7,105,780
1.13
01-May-2015
Transfer
100,000
0.02
7,205,780
1.14
01-Jan-2016
Transfer
-50,000
-0.01
7,155,780
1.13
08-Jan-2016
Transfer
-41,000
-0.01
7,114,780
1.13
12-Feb-2016
Transfer
150,000
0.02
7,264,780
1.15
7,264,780
1.15
31-Mar-2016
Corporate Overview 01-48
Sl. No. Name of the Shareholder
6
7
Dimensional Emerging Markets Value Fund
Uti- Unit Scheme For Charitable And Religious Trusts and ed Societies Uti- Mid Cap Fund Uti- Monthly Income Scheme Uti- Equity Fund Uti- Balanced Fund Uti- Spread Fund Uti- Retirement Benefit Pension Fund Uti- Childrens Career Balanced Plan Uti- Capital Protection Oriented Scheme - Series iv - i (1103 Days) Uti- Capital Protection Oriented Scheme - Series iv - ii (1104 Days) Uti- Capital Protection Oriented Scheme - Series iv iii (1105 Days) Uti- Capital Protection Oriented Scheme - Series v - i (1163 Days) Uti- Dual Advantage Fixed Term Fund Series i - ii (1145 Days) Uti- Capital Protection Oriented Scheme - Series v - ii (1135 Days) Uti- Dual Advantage Fixed Term Fund Series i - iv (1099 Days) Uti- Dual Advantage Fixed Term Fund Series i - v (1099 Days) Uti- Capital Protection Oriented Scheme - Series vi - i (1098 Days) Uti- Dual Advantage Fixed Term Fund Series ii - i (1998 Days) Uti- Dual Advantage Fixed Term Fund Series ii - ii (1997 Days) Uti- Dual Advantage Fixed Term Fund Series ii - iii (1998 Days) Uti- Capital Protection Oriented Scheme - Series vi - iii (1098 Days) Uti-Dual Advantage Fixed Term Fund Series ii - iv (1997 Days) Uti- Capital Protection Oriented Scheme - Series vii - i (1098 Days) Uti- Dual Advantage Fixed Term Fund Series ii - v (1997 Days)
Statutory Reports 49-124
Financial Statements 125-220
Cumulative Shareholding during the year
Shareholding No. of shares at the beginning of the Year (01.04.2015 / end of year 31.03.2016) 5,996,268
6,632,236 2,727,295
% of total shares of the Company
Date
01-Apr-2015 10-Apr-2015 01-May-2015 15-May-2015 22-May-2015 29-May-2015 30-Oct-2015 06-Nov-2015 13-Nov-2015 20-Nov-2015 25-Dec-2015 31-Dec-2015 08-Jan-2016 15-Jan-2016 22-Jan-2016 1.05 31-Mar-2016 0.44 01-Apr-2015 10-Apr-2015 10-Apr-2015 24-Apr-2015 24-Apr-2015 15-May-2015 05-Jun-2015 05-Jun-2015 12-Jun-2015 12-Jun-2015 19-Jun-2015 03-Jul-2015 10-Jul-2015 17-Jul-2015 17-Jul-2015 21-Aug-2015 21-Aug-2015 28-Aug-2015 28-Aug-2015 28-Aug-2015 28-Aug-2015 28-Aug-2015 28-Aug-2015 04-Sep-2015 04-Sep-2015 04-Sep-2015 04-Sep-2015 04-Sep-2015 04-Sep-2015 04-Sep-2015 04-Sep-2015 04-Sep-2015 04-Sep-2015 04-Sep-2015 04-Sep-2015 11-Sep-2015 11-Sep-2015 11-Sep-2015
Reason
Increase/ % of total shares Decrease of the in shareholding Company#
No. of % of total shares shares of the Company#
0.97
Transfer Transfer Transfer Transfer Transfer Transfer Transfer Transfer Transfer Transfer Transfer Transfer Transfer Transfer
26,677 21,370 185,475 66,047 28,193 13,871 9,979 12,086 11,767 58,938 39,669 24,344 93,844 43,708
0.00 0.00 0.03 0.01 0.00 0.00 0.00 0.00 0.00 0.01 0.01 0.00 0.02 0.01
6,022,945 6,044,315 6,229,790 6,295,837 6,324,030 6,337,901 6,347,880 6,359,966 6,371,733 6,430,671 6,470,340 6,494,684 6,588,528 6,632,236 6,632,236
0.95 0.96 0.99 1.00 1.00 1.00 1.01 1.01 1.01 1.02 1.03 1.03 1.04 1.05 1.05
Transfer Transfer Transfer Transfer Transfer Transfer Transfer Transfer Transfer Transfer Transfer Transfer Transfer Transfer Transfer Transfer Transfer Transfer Transfer Transfer Transfer Transfer Transfer Transfer Transfer Transfer Transfer Transfer Transfer Transfer Transfer Transfer Transfer Transfer Transfer Transfer Transfer
147,000 6,000 81,000 50,000 170,000 61,000 -56,000 175,000 175,000 100,000 365,432 155,000 125,000 173,538 23,163 15,442 40,000 162,600 155,400 215,000 201,176 12,855 80,414 144,000 46,841 255,000 330,000 58,091 36,241 24,641 13,649 10,205 13,475 13,939 405,000 17,292 53,869
0.02 0.00 0.01 0.01 0.03 0.01 -0.01 0.03 0.03 0.02 0.06 0.03 0.02 0.03 0.00 0.00 0.01 0.03 0.03 0.03 0.03 0.00 0.01 0.02 0.01 0.04 0.05 0.01 0.01 0.00 0.00 0.00 0.00 0.00 0.07 0.00 0.01
2,874,295 2,880,295 2,961,295 3,011,295 3,181,295 3,242,295 3,186,295 3,361,295 3,536,295 3,636,295 4,001,727 4,156,727 4,281,727 4,455,265 4,478,428 4,493,870 4,533,870 4,696,470 4,851,870 5,066,870 5,268,046 5,280,901 5,361,315 5,505,315 5,552,156 5,807,156 6,137,156 6,195,247 6,231,488 6,256,129 6,269,778 6,279,983 6,293,458 6,307,397 6,712,397 6,729,689 6,783,558
0.00 0.00 0.27 0.01 0.30 0.07 0.00 0.32 0.10 0.12 0.38 0.41 0.43 0.14 0.43 0.15 0.01 0.46 0.17 0.03 0.03 0.00 0.02 0.48 0.01 0.07 0.08 0.01 0.01 0.00 0.00 0.00 0.00 0.00 0.14 0.00 0.01
85
Annual Report 2015-16
Sl. No. Name of the Shareholder
9
10
Platinum International Brands Fund
General Insurance Corporation Of India
The New India Assurance Company Limited
Cumulative Shareholding during the year
% of total shares of the Company
Date
6,445,448 6,380,060
18-Sep-2015 18-Sep-2015 18-Sep-2015 25-Sep-2015 02-Oct-2015 02-Oct-2015 09-Oct-2015 09-Oct-2015 16-Oct-2015 16-Oct-2015 13-Nov-2015 11-Dec-2015 11-Dec-2015 18-Dec-2015 08-Jan-2016 15-Jan-2016 15-Jan-2016 15-Jan-2016 22-Jan-2016 22-Jan-2016 19-Feb-2016 19-Feb-2016 18-Mar-2016 1.02 31-Mar-2016 1.03 01-Apr-2015
6,380,060
1.01
5,202,120
0.84
31-Mar-2016
Increase/ % of total shares Decrease of the in shareholding Company#
Transfer 130 Transfer 86 Transfer 50,000 Transfer 100,000 Transfer 100,000 Transfer 50,000 Transfer 165,000 Transfer 50,000 Transfer 16,189 Transfer 55,000 Transfer 75,000 Transfer 50,000 Transfer 230,000 Transfer 9,419 Transfer 45,000 Transfer -250,000 Transfer 6,584 Transfer 36,764 Transfer -1,175,466 Transfer 10,579 Transfer 15,000 Transfer 9,544 Transfer 13,061 No Movement during the year
0.00 0.00 0.01 0.02 0.02 0.01 0.03 0.01 0.00 0.01 0.01 0.01 0.04 0.00 0.01 -0.04 0.00 0.01 -0.19 0.00 0.00 0.00 0.00
No. of % of total shares shares of the Company#
6,783,688 6,783,774 6,833,774 6,933,774 7,033,774 7,083,774 7,248,774 7,298,774 7,314,963 7,369,963 7,444,963 7,494,963 7,724,963 7,734,382 7,779,382 7,529,382 7,535,966 7,572,730 6,397,264 6,407,843 6,422,843 6,432,387 6,445,448 6,445,448
0.48 0.17 0.15 0.10 0.16 0.02 0.19 0.11 0.02 0.12 0.18 0.49 0.22 0.00 0.23 0.19 0.00 0.01 0.00 0.00 0.01 0.00 0.00 1.02
6,380,060
1.01
0
01-Apr-2015 Transfer
75,000
0.01
5,277,120
0.84
24-Apr-2015
Transfer
170,000
0.03
5,447,120
0.86
01-May-2015
Transfer
255,000
0.04
5,702,120
0.90
08-May-2015
Transfer
75,000
0.01
5,777,120
0.92
5,777,120
0.92
0.92
31-Mar-2016
5,318,673
0.86
01-Apr-2015
0.91
Reason
17-Apr-2015
5,777,120
5,747,945
86
Connect with every sip
Shareholding No. of shares at the beginning of the Year (01.04.2015 / end of year 31.03.2016)
8
•
09-Oct-2015
Transfer
166,772
0.03
5,485,445
0.87
16-Oct-2015
Transfer
125,000
0.02
5,610,445
0.89
23-Oct-2015
Transfer
112,500
0.02
5,722,945
0.91
06-Nov-2015
Transfer
25,000
0.00
5,747,945
0.91
5,747,945
0.91
31-Mar-2016
Corporate Overview 01-48
Sl. No. Name of the Shareholder
11
NPS Trust- A/C Lic Pension Fund Scheme Central Govt. NPS Trust- A/C UTI Retirement Solutions Pension Fund Scheme - Central Govt. NPS Trust- A/C UTI Retirement Solutions Pension Fund Scheme E - Tier I NPS Trust- A/C Icici Prudential Pension Fund Scheme E - Tier I NPS Trust- A/C Lic Pension Fund Scheme - State Govt. NPS Trust- A/C UTI Retirement Solutions Pension Fund Scheme - State Govt. NPS Trust- A/C Icici Prudential Pension Fund Scheme E - Tier Ii NPS Trust A/C - Lic Pension Fund Limited - NPS Lite Scheme - Govt. Pattern NPS Trust A/C - UTI Retirement Solutions Limited - NPS Lite Scheme -Govt. Pattern NPS Trust - A/C Lic Pension Fund Scheme Corporate Cg NPS Trust- A/C Lic Pension Fund Scheme E Tier I NPS Trust- A/C Lic Pension Fund Scheme E Tier Ii NPS Trust - A/C UTI Retirement Solutions Ltd Scheme - Atal Pension Yojana (Apy) NPS Trust - A/C Lic Pension Fund Scheme - Atal Pension Yojana (Apy)
Statutory Reports 49-124
Financial Statements 125-220
Cumulative Shareholding during the year
Shareholding No. of shares at the beginning of the Year (01.04.2015 / end of year 31.03.2016) 2,114,996
% of total shares of the Company
0.34
Date
Reason
01-Apr-2015 08-May-2015 08-May-2015 08-May-2015 08-May-2015 15-May-2015 15-May-2015 05-Jun-2015 05-Jun-2015 12-Jun-2015 12-Jun-2015 19-Jun-2015 19-Jun-2015 19-Jun-2015 17-Jul-2015 17-Jul-2015 24-Jul-2015 24-Jul-2015 21-Aug-2015 21-Aug-2015 21-Aug-2015 28-Aug-2015 28-Aug-2015 28-Aug-2015 28-Aug-2015 04-Sep-2015 04-Sep-2015 04-Sep-2015 04-Sep-2015 11-Sep-2015 11-Sep-2015 11-Sep-2015 30-Sep-2015 30-Sep-2015 02-Oct-2015 02-Oct-2015 02-Oct-2015 09-Oct-2015 09-Oct-2015 09-Oct-2015 16-Oct-2015 23-Oct-2015 23-Oct-2015 30-Oct-2015 30-Oct-2015 06-Nov-2015 06-Nov-2015 13-Nov-2015 13-Nov-2015 20-Nov-2015 20-Nov-2015 27-Nov-2015 27-Nov-2015
Transfer Transfer Transfer Transfer Transfer Transfer Transfer Transfer Transfer Transfer Transfer Transfer Transfer Transfer Transfer Transfer Transfer Transfer Transfer Transfer Transfer Transfer Transfer Transfer Transfer Transfer Transfer Transfer Transfer Transfer Transfer Transfer Transfer Transfer Transfer Transfer Transfer Transfer Transfer Transfer Transfer Transfer Transfer Transfer Transfer Transfer Transfer Transfer Transfer Transfer Transfer Transfer
Increase/ % of total shares Decrease of the in shareholding Company#
15,000 25,000 1,000 2,500 5,000 10,000 10,000 10,000 10,000 10,000 16,900 23,470 1,000 15,000 15,000 72,000 720 150,000 225,000 1,500 482,000 657,000 15,000 5,540 275,000 375,000 9,000 5,000 156,000 227,000 8,000 12,314 902 6,477 670 4,000 7,500 400 199 212 440 32 127 10 143 6 279 8 345 -47 116 4
0.00 0.00 0.00 0.00 0.00 0.00 0.00 0.00 0.00 0.00 0.00 0.00 0.00 0.00 0.00 0.01 0.00 0.02 0.04 0.00 0.08 0.11 0.00 0.00 0.04 0.06 0.00 0.00 0.03 0.04 0.00 0.00 0.00 0.00 0.00 0.00 0.00 0.00 0.00 0.00 0.00 0.00 0.00 0.00 0.00 0.00 0.00 0.00 0.00 0.00 0.00 0.00
No. of % of total shares shares of the Company#
2,129,996 2,154,996 2,155,996 2,158,496 2,163,496 2,173,496 2,183,496 2,193,496 2,203,496 2,213,496 2,230,396 2,253,866 2,254,866 2,269,866 2,284,866 2,356,866 2,357,586 2,507,586 2,732,586 2,734,086 3,216,086 3,873,086 3,888,086 3,893,626 4,168,626 4,543,626 4,552,626 4,557,626 4,713,626 4,940,626 4,948,626 4,960,940 4,961,842 4,968,319 4,968,989 4,972,989 4,980,489 4,980,889 4,981,088 4,981,300 4,981,740 4,981,772 4,981,899 4,981,909 4,982,052 4,982,058 4,982,337 4,982,345 4,982,690 4,982,643 4,982,759 4,982,763
0.34 0.34 0.34 0.34 0.34 0.34 0.35 0.35 0.35 0.35 0.35 0.36 0.36 0.36 0.36 0.37 0.37 0.40 0.43 0.43 0.51 0.61 0.62 0.62 0.66 0.72 0.72 0.72 0.75 0.78 0.78 0.79 0.79 0.79 0.79 0.79 0.79 0.79 0.79 0.79 0.79 0.79 0.79 0.79 0.79 0.79 0.79 0.79 0.79 0.79 0.79 0.79
87
Annual Report 2015-16
Sl. No. Name of the Shareholder
Retail Employees Superannuation Pty. Limited As Trustee For Retail Employees Superannuation Trust
% of total shares of the Company
5,305,346
0.84
2,821,048
0.46
4,759,014
88
Connect with every sip
Cumulative Shareholding during the year
Shareholding No. of shares at the beginning of the Year (01.04.2015 / end of year 31.03.2016)
12
•
0.75
Date
Reason
04-Dec-2015 04-Dec-2015 11-Dec-2015 11-Dec-2015 11-Dec-2015 11-Dec-2015 11-Dec-2015 11-Dec-2015 18-Dec-2015 18-Dec-2015 18-Dec-2015 18-Dec-2015 18-Dec-2015 18-Dec-2015 25-Dec-2015 25-Dec-2015 31-Dec-2015 31-Dec-2015 01-Jan-2016 01-Jan-2016 08-Jan-2016 08-Jan-2016 15-Jan-2016 15-Jan-2016 22-Jan-2016 22-Jan-2016 29-Jan-2016 29-Jan-2016 05-Feb-2016 05-Feb-2016 12-Feb-2016 12-Feb-2016 12-Feb-2016 12-Feb-2016 12-Feb-2016 12-Feb-2016 12-Feb-2016 19-Feb-2016 19-Feb-2016 26-Feb-2016 26-Feb-2016 26-Feb-2016 26-Feb-2016 26-Feb-2016 26-Feb-2016 31-Mar-2016
Transfer Transfer Transfer Transfer Transfer Transfer Transfer Transfer Transfer Transfer Transfer Transfer Transfer Transfer Transfer Transfer Transfer Transfer Transfer Transfer Transfer Transfer Transfer Transfer Transfer Transfer Transfer Transfer Transfer Transfer Transfer Transfer Transfer Transfer Transfer Transfer Transfer Transfer Transfer Transfer Transfer Transfer Transfer Transfer Transfer Transfer
Increase/ % of total shares Decrease of the in shareholding Company#
181 8 20,000 379 10,000 17 3,000 3,000 25,000 259 25,000 8 3,000 3,000 155 13 196 12 49 3 389 20 503 18 533 31 311 23 644 23 693 20,000 39 5,000 5,000 100 5,000 574 14 94,000 9,400 655 94,000 27 9,400 -17,094
0.00 0.00 0.00 0.00 0.00 0.00 0.00 0.00 0.00 0.00 0.00 0.00 0.00 0.00 0.00 0.00 0.00 0.00 0.00 0.00 0.00 0.00 0.00 0.00 0.00 0.00 0.00 0.00 0.00 0.00 0.00 0.00 0.00 0.00 0.00 0.00 0.00 0.00 0.00 0.02 0.00 0.00 0.02 0.00 0.00 0.00
No. of % of total shares shares of the Company#
4,982,944 4,982,952 5,002,952 5,003,331 5,013,331 5,013,348 5,016,348 5,019,348 5,044,348 5,044,607 5,069,607 5,069,615 5,072,615 5,075,615 5,075,770 5,075,783 5,075,979 5,075,991 5,076,040 5,076,043 5,076,432 5,076,452 5,076,955 5,076,973 5,077,506 5,077,537 5,077,848 5,077,871 5,078,515 5,078,538 5,079,231 5,099,231 5,099,270 5,104,270 5,109,270 5,109,370 5,114,370 5,114,944 5,114,958 5,208,958 5,218,358 5,219,013 5,313,013 5,313,040 5,322,440 5,305,346
0.79 0.79 0.79 0.79 0.79 0.79 0.79 0.80 0.80 0.80 0.80 0.80 0.80 0.80 0.80 0.80 0.80 0.80 0.80 0.80 0.80 0.80 0.80 0.80 0.80 0.80 0.80 0.80 0.80 0.80 0.80 0.81 0.81 0.81 0.81 0.81 0.81 0.81 0.81 0.83 0.83 0.83 0.84 0.84 0.84 0.84
01-Apr-2015 28-Aug-2015
Transfer
341,675
0.06
3,162,723
0.50
23-Oct-2015
Transfer
684,703
0.11
3,847,426
0.61
11-Dec-2015
Transfer
796,688
0.13
4,644,114
0.74
18-Dec-2015
Transfer
114,900
0.02
4,759,014
0.75
4,759,014
0.75
31-Mar-2016
Corporate Overview 01-48
Sl. No. Name of the Shareholder
14
15
16
The Scottish Oriental Smaller Companies Trust plc
The Emerging Markets Small Cap Series of The DFA Investment Trust Company
Emerging Markets Core Equity Portfolio (The Portfolio) of Dfa Investment Dimensions Group Inc. (Dfaidg)
ICICI Lombard General Insurance Company Ltd.
Cumulative Shareholding during the year
Shareholding No. of shares at the beginning of the Year (01.04.2015 / end of year 31.03.2016)
13
Financial Statements 125-220
Statutory Reports 49-124
% of total shares of the Company
4,221,438
0.68
4,221,438
0.67
2,733,817
0.44
Date
01-Apr-2015 No 31-Mar-2016 Movement during the year
0
No. of % of total shares shares of the Company#
4,221,438
0.68
4,221,438
0.67
01-Apr-2015 Transfer
62,402
0.01
2,796,219
0.44
17-Apr-2015
Transfer
36,121
0.01
2,832,340
0.45
24-Apr-2015
Transfer
184,053
0.03
3,016,393
0.48
01-May-2015
Transfer
101,362
0.02
3,117,755
0.49
08-May-2015
Transfer
216,906
0.04
3,334,661
0.53
15-May-2015
Transfer
10,569
0.00
3,345,230
0.53
22-May-2015
Transfer
71,869
0.01
3,417,099
0.54
30-Sep-2015
Transfer
23,945
0.00
3,441,044
0.55
02-Oct-2015
Transfer
20,479
0.00
3,461,523
0.55
16-Oct-2015
Transfer
19,281
0.00
3,480,804
0.55
3,480,804
0.55
0.55
31-Mar-2016
27,13,836
0.44
1-Apr-15 1-May-15
Transfer
90,771
0.01
28,04,607
0.44
17-Jul-15
Transfer
93,047
0.02
28,97,654
0.46
28-Aug-15
Transfer
-1,79,431
-0.03
27,18,223
0.43
16-Oct-15
Transfer
36,901
0.01
27,55,124
0.44
23-Oct-15
Transfer
50,674
0.01
28,05,798
0.44
30-Oct-15
Transfer
26,160
0
28,31,958
0.45
6-Nov-15
Transfer
9,525
0
28,41,483
0.45
22-Jan-16
Transfer
24,003
0
28,65,486
0.45
29-Jan-16
Transfer
1,53,290
0.02
30,18,776
0.48
5-Feb-16
Transfer
38,358
0.01
30,57,134
0.48
12-Feb-16
Transfer
47,597
0.01
31,04,731
0.49
26-Feb-16
Transfer
1,12,034
0.02
32,16,765
0.51
4-Mar-16
Transfer
44,592
0.01
32,61,357
0.52
31-Mar-16
0
0.00
01-Apr-2015
0.49
Increase/ % of total shares Decrease of the in shareholding Company#
10-Apr-2015
3,480,804
3,080,000
Reason
32,61,357
0.52
32,61,357
0.52
12-Jun-2015
Transfer
200,000
0.03
200,000
0.03
03-Jul-2015
Transfer
100,000
0.02
300,000
0.05
21-Aug-2015
Transfer
50,000
0.01
350,000
0.06
28-Aug-2015
Transfer
50,000
0.01
400,000
0.06
04-Sep-2015
Transfer
1,795,000
0.29
2,195,000
0.35
11-Sep-2015
Transfer
305,000
0.05
2,500,000
0.40
29-Jan-2016
Transfer
25,000
0.00
2,525,000
0.40
05-Feb-2016
Transfer
50,000
0.01
2,575,000
0.41
12-Feb-2016
Transfer
75,000
0.01
2,650,000
0.42
19-Feb-2016
Transfer
200,000
0.03
2,850,000
0.45
04-Mar-2016
Transfer
230,000
0.04
3,080,000
0.49
3,080,000
0.49
31-Mar-2016
89
Annual Report 2015-16
Sl. No. Name of the Shareholder
17
18
19
20
90
JM Financial Mutual Fund - JM Arbitrage Advantage Fund
First State Investments (Hongkong) Limited A/C First State Indian Subcontinent Fund
HDFC Standard Life Insurance Company Limited
Citigroup Global Markets Mauritius Private Limited
•
Connect with every sip
Cumulative Shareholding during the year
Shareholding No. of shares at the beginning of the Year (01.04.2015 / end of year 31.03.2016) 2,084,000
2,784,000 3,588,131
2,757,766 575,113
500,000 6,266,811
% of total shares of the Company
0.34
0.44 0.58
0.44 0.09
0.08 1.01
Date
01-Apr-2015 24-Apr-2015 01-May-2015 08-May-2015 19-Jun-2015 26-Jun-2015 30-Jun-2015 04-Sep-2015 18-Sep-2015 30-Oct-2015 11-Dec-2015 18-Dec-2015 12-Feb-2016 04-Mar-2016 18-Mar-2016 25-Mar-2016 31-Mar-2016 01-Apr-2015 01-May-2015 28-Aug-2015 04-Sep-2015 31-Mar-2016 01-Apr-2015 10-Apr-2015 08-May-2015 19-Jun-2015 18-Sep-2015 31-Dec-2015 31-Mar-2016 01-Apr-2015
Reason
Transfer Transfer Transfer Transfer Transfer Transfer Transfer Transfer Transfer Transfer Transfer Transfer Transfer Transfer Transfer
Increase/ % of total shares Decrease of the in shareholding Company#
No. of % of total shares shares of the Company#
160,000 354,000 252,000 4,000 130,000 188,000 400,000 -98,000 -2,000 -252,000 -96,000 -268,000 136,000 -64,000 -144,000
0.03 0.06 0.04 0.00 0.02 0.03 0.06 -0.02 0.00 -0.04 -0.02 -0.04 0.02 -0.01 -0.02
2,244,000 2,598,000 2,850,000 2,854,000 2,984,000 3,172,000 3,572,000 3,474,000 3,472,000 3,220,000 3,124,000 2,856,000 2,992,000 2,928,000 2,784,000 2,784,000
0.36 0.41 0.45 0.45 0.47 0.50 0.57 0.55 0.55 0.51 0.49 0.45 0.47 0.46 0.44 0.44
Transfer 391,711 Transfer -1,086,825 Transfer -135,251
0.06 -0.18 -0.02
3,979,842 2,893,017 2,757,766 2,757,766
0.63 0.46 0.44 0.44
Transfer Transfer Transfer Transfer Transfer
20 26 9 -168 -75,000
0.00 0.00 0.00 0.00 -0.01
575,133 575,159 575,168 575,000 500,000 500,000
0.09 0.09 0.09 0.09 0.08 0.08
17-Apr-2015
Transfer
544,500
0.09
6,811,311
1.08
24-Apr-2015
Transfer
-42,000
-0.01
6,769,311
1.07
01-May-2015
Transfer
-119,311
-0.02
6,650,000
1.05
08-May-2015
Transfer
-118,000
-0.02
6,532,000
1.03
15-May-2015
Transfer
-36,000
-0.01
6,496,000
1.03
29-May-2015
Transfer
-450,000
-0.07
6,046,000
0.96
05-Jun-2015
Transfer
-564,000
-0.09
5,482,000
0.87
12-Jun-2015
Transfer
-790,000
-0.13
4,692,000
0.74
26-Jun-2015
Transfer
-28,000
0.00
4,664,000
0.74
28-Aug-2015
Transfer -1,428,000
-0.23
3,236,000
0.51
04-Sep-2015
Transfer
-184,000
-0.03
3,052,000
0.48
11-Sep-2015
Transfer
-124,000
-0.02
2,928,000
0.46
18-Sep-2015
Transfer
-158,000
-0.03
2,770,000
0.44
25-Sep-2015
Transfer
-902,000
-0.15
1,868,000
0.30
30-Sep-2015
Transfer
-194,000
-0.03
1,674,000
0.27
09-Oct-2015
Transfer
-735,200
-0.12
938,800
0.15
09-Oct-2015
Transfer
417,200
0.07
1,356,000
0.21
16-Oct-2015
Transfer
-8,000
0.00
1,348,000
0.21
30-Oct-2015
Transfer
-700,000
-0.11
648,000
0.10
Corporate Overview 01-48
Sl. No. Name of the Shareholder
Merrill Lynch Capital Markets Espana S.A. S.V.
Financial Statements 125-220
Cumulative Shareholding during the year
Shareholding No. of shares at the beginning of the Year (01.04.2015 / end of year 31.03.2016)
21
Statutory Reports 49-124
56,000 4,818,644
0
% of total shares of the Company
Increase/ % of total shares Decrease of the in shareholding Company#
No. of % of total shares shares of the Company#
Date
Reason
04-Dec-2015 11-Dec-2015 18-Dec-2015 18-Dec-2015 08-Jan-2016 29-Jan-2016 29-Jan-2016 18-Mar-2016 25-Mar-2016 0.01 31-Mar-2016 0.78 01-Apr-2015 10-Apr-2015 17-Apr-2015 24-Apr-2015 01-May-2015 08-May-2015 15-May-2015 22-May-2015 29-May-2015 05-Jun-2015 19-Jun-2015 26-Jun-2015 30-Jun-2015 03-Jul-2015 10-Jul-2015 10-Jul-2015 17-Jul-2015 24-Jul-2015 24-Jul-2015 31-Jul-2015 31-Jul-2015 07-Aug-2015 21-Aug-2015 04-Sep-2015 30-Sep-2015 18-Dec-2015 25-Dec-2015 08-Jan-2016 15-Jan-2016 05-Feb-2016 12-Feb-2016 19-Feb-2016 0.00 31-Mar-2016
Transfer Transfer Transfer Transfer Transfer Transfer Transfer Transfer Transfer
-24,000 -152,000 -48,000 -120,000 84,000 -266,800 -121,200 17,700 38,300
0.00 -0.02 -0.01 -0.02 0.01 -0.04 -0.02 0.00 0.01
624,000 472,000 424,000 304,000 388,000 121,200 0 17,700 56,000 56,000
0.10 0.07 0.07 0.05 0.06 0.02 0.00 0.00 0.01 0.01
Transfer Transfer Transfer Transfer Transfer Transfer Transfer Transfer Transfer Transfer Transfer Transfer Transfer Transfer Transfer Transfer Transfer Transfer Transfer Transfer Transfer Transfer Transfer Transfer Transfer Transfer Transfer Transfer Transfer Transfer Transfer Transfer
78,000 448,135 68,000 2,710 -450,000 -688,000 -134,365 -44,690 -1,935 -539,164 -503,000 -123,000 -998,000 -483,000 210,263 -718,000 -293,000 -224,000 -93,171 -278,829 -53,598 120,000 -94,000 -26,000 56,248 47,355 -27,214 -18,744 -57,645 8,000 -8,000
0.01 0.07 0.01 0.00 -0.07 -0.11 -0.02 -0.01 0.00 -0.09 -0.08 -0.02 -0.16 -0.08 0.03 -0.12 -0.05 -0.04 -0.02 -0.05 -0.01 0.02 -0.02 0.00 0.01 0.01 0.00 0.00 -0.01 0.00 0.00
4,896,644 5,344,779 5,412,779 5,415,489 4,965,489 4,277,489 4,143,124 4,098,434 4,096,499 3,557,335 3,054,335 2,931,335 1,933,335 1,450,335 1,660,598 942,598 649,598 425,598 332,427 53,598 0 120,000 26,000 0 56,248 103,603 76,389 57,645 0 8,000 0 0
0.78 0.85 0.86 0.86 0.79 0.68 0.66 0.65 0.65 0.56 0.48 0.46 0.31 0.23 0.26 0.15 0.10 0.07 0.05 0.01 0.00 0.02 0.00 0.00 0.01 0.02 0.01 0.01 0.00 0.00 0.00 0.00
Shareholding is consolidated based on Permanent Number (PAN) of the Shareholder.
# Based on the increased paid up equity capital consequent to allotment of new shares pursuant to the amalgamation of Mount Everest Mineral Water Limited with the Company. 91
Annual Report 2015-16
(v)
•
Shareholding of Directors and Key Managerial Personnel: Sl. Name of the Directors No and/ or KMP
1.
Mr. Cyrus P Mistry (Chairman)
Date Reason Increase / Decrease Cumulative Shareholding at the in Shareholding Shareholding during beginning of the year the year as on 01.04.2015 % of total No. of % of total No. of No. of % of total shares shares of the shares shares of the shares shares of the Company Company Company 33,000 0.01 No Movement during the financial year 2015-16 33,000 0.01 31.03.2016
2.
Mr. V. Madan Company Secretary
0
0.00
At the year end 02.07.2015 Allotment 31.03.2016
Connect with every sip
112
0.00
At the year end
33,000
0.01
112
0.00
112
0.00
No other Director and Key Managerial Personnel of the Company holds shares in the Company.
V. INDEBTEDNESS
Indebtedness of the Company including interest outstanding/accrued but not due for payment Rs. in Crores Secured Loans Unsecured Loans excluding deposits
Deposits
Total Indebtedness
72.24
-
477.50
Indebtedness at the beginning of the financial year i)
Principal Amount
ii)
Interest due but not paid
iii)
Interest accrued but not due
Total (i+ii+iii)
405.26 -
-
-
-
4.30
0.03
-
4.33
409.56
72.27
-
481.83
-
750.00
-
750.00
Change in Indebtedness during the financial year • Addition • Reduction Net Change
27.53
822.27
-
849.80
(27.53)
(72.27)
-
(99.80)
377.61
-
-
377.61
Indebtedness at the end of the financial year i)
Principal Amount
ii)
Interest due but not paid
iii)
Interest accrued but not due
Total (i+ii+iii)
92
-
-
-
-
4.42
-
-
4.42
382.03
-
-
382.03
Corporate Overview 01-48
Statutory Reports 49-124
VI.
REMUNERATION OF DIRECTORS AND KEY MANAGERIAL PERSONNEL:
A.
Remuneration to Managing Director, Whole-time Directors and/or Manager:
Financial Statements 125-220
Rs. in Lakhs Sl. No.
Particulars of Remuneration
1
Gross salary
Name of MD/WTD/Manager L. KrishnaKumar (Executive Director)
Ajoy Misra (Managing Director) (a)
Salary as per provisions contained in Section 17(1) of the Income-tax Act, 1961
188.36
169.10
357.46
(b)
Value of perquisites u/s 17(2) of the Income-tax Act, 1961
66.52
60.25
126.77
(c)
Profits in lieu of Salary under Section 17(3) of the Income- tax Act, 1961
-
-
-
2
Stock Option
-
-
-
3
Sweat Equity
-
-
-
4
Commission - as % of profit - others-specify
-
-
-
26.94
22.47
49.41
281.82
251.82
533.64
-
-
4,033.66
65.35
42.39
107.74
5
Others (contribution to PF, Gratuity and Superannuation) Total Ceiling as per the Act Payment from overseas subsidiary
B.
Total Amount
Remuneration to other Directors: Sl No. Particulars of Remuneration
1
2
Rs. in Lakhs
Mr. Mrs. M Cyrus P Srinivasan Mistry
Independent Directors Fee for attending board/ committee meetings Commission Others, please specify Total (1) Other Non-Executive Directors Fee for attending board/ 2.20 committee meetings Commission Others, please specify Total (2) 2.20 Total (1+2) 2.20 Total Managerial Remuneration Overall Ceiling as per the Act
Mr. Mr. V. Analjit Leeladhar Singh
Name of Directors Mrs. Mr. Ranjana Darius Kumar Pandole
Mrs. Ireena Vittal
Mr. S. Santhanakrishnan
Mr. Harish Bhat
Total Amount
1.70
0.60
7.85
6.30
5.55
4.35
-
-
26.35
11.00 12.70
4.00 4.60
59.00 66.85
45.00 51.30
39.00 44.55
28.00 32.35
-
-
186.00 212.35
-
-
-
-
-
-
3.85
3.65
9.70
12.70
4.60
66.85
51.30
44.55
32.35
28.00 31.85 31.85
3.65 3.65
28.00 37.70 250.05 250.05 403.37
93
Annual Report 2015-16
C.
•
Connect with every sip
Remuneration to Key Managerial Personnel other than Md/Manager/Wtd Sl Particulars of Remuneration Key Managerial Personnel No. John Jacob V. Madan 1
Chief Financial Officer
Gross salary
Rs. in Lakhs Total
Company Secretary
2
Salary as per provisions contained in Section 17(1) of the Income-tax Act, 1961 (b) Value of perquisites u/s 17(2) of the Income-tax Act, 1961 (c) Profits in lieu of Salary under Section 17(3) of the Income-tax Act, 1961 Stock Option
3
Sweat Equity
-
-
-
4
Commission
(a)
5
97.26
75.10
172.36
33.19
25.43
58.62
-
-
-
-
-
-
-
-
-
-
as % of profit
-
-
-
-
others
-
-
-
13.31
10.44
23.75
143.76
110.97
254.73
Others (contribution to PF, Gratuity and Superannuation) Total
VII. PENALTIES / PUNISHMENT/ COMPOUNDING OF OFFENCES Type
Section of the Companies Act
A. COMPANY Penalty Punishment Compounding B. DIRECTORS Penalty Punishment Compounding C. OTHER OFFICERS IN DEFAULT Penalty Punishment Compounding
Brief Description
Details of Penalty / Punishment/ Compounding fees imposed
Authority [RD / NCLT/ COURT]
Appeal made, if any (give Details)
NIL
On behalf of the Board of Directors
Mumbai 24th May 2016
94
Cyrus P Mistry Chairman
Corporate Overview 01-48
Statutory Reports 49-124
Financial Statements 125-220
Annexure 6 to Directors’ Report Conservation of Energy, Technology Absorption, Foreign Exchange Earnings and Outgo A.
Conservation of Energy
Energy conservation measures taken during 2015-16
i.
Steps taken or impact on conservation of energy:
Pullivasal and Periakanal Estates
•
Installation of Tuflite sheets (translucent fiber-glass sheets) in labour line units and additional usage of CFL bulbs
Tetley Cochin Division
•
Installation of low wattage LED light fixers in the plant
•
Installation of turbine air ventilators
following initiatives during the year 2016-17, at an approximate additional investment of around Rs. 118 Lakhs:
•
Installation of Auto Start Delta convertor for some of the heavy duty motors to reduce power consumption
•
Phase wise replacement of heavy duty motors with energy efficient ones
•
Plant lightings up gradation using the latest LED lighting
Above investment is expected to generate an annual incremental savings of Rs. 5 Lakhs.
The following initiatives are proposed to be taken at the packeting centres during 2016-17:
•
Installation of solar system and KVR capacitor to improve power factor
•
Installation of LED lights
•
Replacement of vacuum conveying system with electrically operated vacuum conveying system to reduce the load on compressors
•
Installation of turbine ventilation system
B.
Technology Absorption
(i)
Instant Tea Division, Munnar
•
Replacement of old metal halide & sodium vapour lamps with energy efficient LED electrical fittings
•
Replacement of old Thermal Relays with electronic type relays for critical motors
Packeting Centres
•
New blending line resulting in reduced usage of motor
•
Installation of additional energy efficient LED lights
•
ii.
Steps taken by the Company for utilising alternate sources of energy:
iii.
Installation of Turbine ventilators with transparent FRP sheet for improved air change
The Company has resorted to usage of firewood, own generation and solar sources in addition to electricity purchase Capital investment on Energy Conservation Equipment: The Instant Tea Division will be taking up the
Efforts made towards technology absorption: The Company has been engaging with various companies and Research Institutes for technical collaborations for process improvement, product development, packaging development and analytical . Technical discussions were held to identify the relevant technologies, solutions and development . TGBL has entered into MOU with many external companies and Institutes under confidentiality agreements to work further on various collaborative projects and assignments. We are engaging with our regular vendors of rigid and flexible packaging for packaging improvement including re-engineering of packs.
95
Annual Report 2015-16
(ii)
Benefits derived like product improvement, cost reduction, product development or import substitution:
During the year, the Company launched three products – Tata Tea Fusion (Black tea), Tetely Lemon flavoured Long Leaf Green Tea and Tata Coffee Grand (Instant Coffee). This has been achieved through the efforts taken on technology and product development and collaborations.
Other benefits included collaborations with various external partners to the development work, significant of which are as under:
•
•
•
Collaborated with Nichrome, Facile and Manjusree Plastics for development of packaging concepts and machinery for Tata Tea Fusion
Connect with every sip
In case of imported Technology (imported during the last three years reckoned from the beginning of the financial year): a)
The details of technology imported: The Company has not imported any technology during the last three financial years
b)
The year of import: Not Applicable
c)
Whether the technology has been fully absorbed: Not Applicable
d)
If not fully absorbed, areas where absorption has not taken place and the reasons thereof: Not Applicable.
Expenditure incurred on Research & Development:
(iv)
Collaborated with flavour houses of Givaudan and IFF for flavour development for Flavoured Green Tea and Tata Coffee Grand
Capital Expenditure
0.71
Projects taken up with Central Food Technological Research Institute (CFTRI) for shelf life studies
Revenue Expenditure
5.50
Total R&D expenditure as a % of Net sales
•
Service agreements with Analytical labs – Eurofins, TUV India and MicroChem for analytical
•
Progressed collaboration efforts with Sami Labs and DuPont India Limited for t exploration of functional ingredients for development of products in the area of Health & Wellness
•
Engagement with Tata Chemicals for identifying suitable opportunities with various functional ingredients continues and progress made on some development concepts
•
Technology platform exploration continues with Zeon Life sciences for developing technologies for various product formats.
96
(iii)
•
Rs. in Crores
0.21%
C.
Foreign Exchange Earnings and Outgo
The Foreign Exchange earned in of actual inflows during the year and the Foreign Exchange Outgo during the year in of actual outflows:
Rs. in Crores
1.
Foreign Exchange Earned
314.84
2.
Outgo of Foreign Exchange
97.64
On behalf of the Board of Directors
Mumbai 24th May 2016
Cyrus P Mistry Chairman
Corporate Overview 01-48
Statutory Reports 49-124
Financial Statements 125-220
Management Discussion and Analysis- 2015-16 Business Overview Tata Global Beverages is a global natural beverage business with brand presence in over 40 countries. Your Company is the second largest player in branded tea in the world and has growing interests in coffee and water. Your Company focuses on creating ‘magical beverage moments’ for its consumers through its stable of innovative beverage brands, including Tata Tea, Tetley, Himalayan natural mineral water, Tata Gluco+, Tata Coffee Grand and Eight O’clock Coffee. Your Company follows an overall strategy that builds on its core strengths – understanding of consumer requirements, differentiated product offerings, brand management, distribution and international footprint. Whilst tea s for around 74% of our revenue, coffee s for 25% and water and other products contribute to the rest. Approximately 60% of the consolidated revenues come from markets outside India such as United Kingdom, United States of America, Canada, Russia, , Australia and Europe.
Industry Structure - Global Economic, Consumer and Competitor Trends The global economic trends continue to be uncertain with slower growth in many markets. India and China appear to be the growth engines of the future along with the US where the outlook appears to be improving. The macro-economic conditions are driving certain behavioral trends in consumers. Consumers, especially in the international markets, are continuing to seek better value thereby increasing competitive intensity. We have also seen new entrants in certain segments which has further increased the competitive intensity in those countries. Consumers are also looking for product choices that are increasingly shifting towards convenience, health and wellness and improving lifestyle. In keeping with the lifestyle theme, there is also a growing trend for more ised products in many markets. In addition, we have seen growth in new formats and new channels for sales. There is an emergence of specialty tea stores and café concepts coupled with growing e-commerce channels with an emphasis on personalisation and convenience. Changing consumer trends s has led to a category decline in everyday black tea in certain developed markets. In addition, since consumers have become value conscious, there have been instances of private label and regional players gaining in market share. Your Company continues to constantly strive to meet these challenges by strengthening its brands, category expansion, innovation, investment in new ventures and cost rationalisation. Your Company closely tracks and gains insights into the changing consumer landscape and trends like change in lifestyle, isation and the need for convenience. We do this by understanding the palate unique to each region and also
leveraging on the consumer preference for products related to health and wellness in order to offer a range of interesting and innovative products across the beverage portfolio. TGB brands have successfully adapted to the digital medium to narrate brand stories. From Tetley being rated as one of the top social brands by The Grocer in the UK, to the innovative Tetley Transformation initiative in India, the 80 seconds of Mindfulness campaign by Tetley in Australia, and Tetley Farmer’s First Hand – a unique property of TGB, our brands are leveraging the digital medium to touch consumers in meaningful ways.
Industry Structure – Commodity Trends Tea The 2015-16 season witnessed a crop decline across all major producing countries barring Bangladesh. In India, annual production declined 16.2 million kgs but most of this decline came from the South. Kenya which is the largest exporter of CTC teas also experienced a less favourable year and after two successive record crop years saw a drop of 45.9 million kgs or 10% from 2014. The top 10 producing and exporting countries outside of China collectively ed for a decline of 105 million kgs in annual production. However not all prices moved along expected lines and in tandem with a drop in supply. With the exception of Africa, led by Kenyan teas, most other producing countries witnessed a gradual easing in overall sales averages. Mombasa averages rose by $ 0.71 or 35% over 2014 at an average of $ 2.75 per kg. This is also $ 0.22 above the 5 year average. In North India, whilst the annual CTC average was lower by Rs 3.29, orthodox teas were dearer by Rs 19.28. North India also saw a pricing for quality teas which will be an encouragement for the unorganised sector and small tea growers towards more sustainable field practices and quality control. In South India prices dropped Rs 3.07 per kg. All India averages fell by Rs 2.31 and the year closed at Rs 128.60 per kg. In Colombo prices fell sharply by SL Rs 59.24 despite a lower crop. Bangladesh on the other hand recorded a higher crop and also a higher price of Tk 17.47. Markets in the first few months of the current year have reverted to a more traditional and expected pattern. A record first flush crop in North India has meant easier opening levels. This trend is forecast to continue for some time. In South India drier weather and lower production has moved prices upwards. We expect prices to remain at this level until the onset of the monsoons when higher spot availability should see prices move back. Kenya has had a record crop at the beginning of the year and prices have moved down reacting to this additional supply.
97
Annual Report 2015-16
Coffee The supply and price of coffee are subject to significant volatility. Supply and price of all coffee grades are affected by multiple factors, such as weather, natural disasters, crop damage, farm inputs and cost of production, competitive pressures, domestic and international currency and economics in producing countries. Price is also impacted by trading activities in the coffee futures markets including hedge funds and commodity index funds. We continually analyse green coffee costs to review our costing structure. To help mitigate volatility and external trading factors, commodity price management strategies are implemented to protect forward pricing. We purchase coffee from over 20 countries through a combination of outside trading companies and through other relationships to ensure supply of green coffee. We depend on these relationships with our supply partners to deliver on-time, specific taste profiles of our raw green coffee. The global production of Coffee for the year 2015 is estimated at 144.7 million bags and consumption at 152.1 million bags as per International Coffee Organisation. Due to higher production of Robusta in Vietnam and weakening emerging market currencies, coffee prices trended downward l in 2015-16. Coffee prices have traded in the price range of 1.1 cents/lbs to 1.5 cents/lbs for Arabica and 0.6 cents/lbs to 0.8 cents/lbs for Robusta. The outlook is for lower prices to continue in the initial months with some scope for hardening as the year progresses.
Consolidated Financial and Operating Performance The consolidated financial highlights for 2015-16 are as follows: Rs. in Crores 2015-16
2014-15
Variance
8,111
7,993
118
Operating Profit
532
642
(110)
Profit before exceptional items and taxes Exceptional items (net)
534
630
(96)
11
(130)
141
Profit before tax
545
500
45
Profit after tax
335
284
51
Group Consolidated net profit
326
248
78
Operating Income
For the year ended 31st March 2016, Income from operations at Rs 8,111 Crores was 2% higher than the previous year. At prior year exchange rates, the improvement would have been 3%. The growth has been achieved despite high competitive intensity,
98
•
Connect with every sip
adverse macro-economic conditions in certain countries, slower growth or decline in everyday black tea categories in developed markets. Operating profits at Rs 532 Crores is lower than the previous period mainly due to increased spends behind brands and new launches, higher spends on initiatives, absence of one time credits which was available in the previous year and higher commodity costs mainly in the international markets. However Group net profit significantly improved over the prior year due to the impact of exceptional items. In the current year, the exceptional items had a favourable impact mainly due to profit on sale of non-core investments partially offset by impairments taken for certain intangible assets.
Standalone Financial and Operating Performance Rs. in Crores 2015-16
2014-15
Variance
3,084
2,885
199
Operating Profit
319
297
22
Profit before exceptional items and taxes
396
418
(22)
Exceptional items (net)
265
(69)
334
Profit before tax
661
349
312
Provision for tax
(97)
(60)
(37)
Profit after tax
564
289
275
Operating Income
Income from operations grew 7% over the prior year driven by improvement in branded business due to volume improvements and higher price realisations. Profit from operations improved over the prior year mainly due to higher sales and lower blend costs offsetting the impact of higher spends behind brands. Profit after tax was significantly higher than the prior year mainly due to the impact of exceptional items. Exceptional items were favorably impacted by profit on sale of non-core investments.
Product / Brand Performance - Tea & Coffee Despite the challenging environment prevailing in the international markets, the branded business did report growth led by improvements in operations in India, MAP, Teapigs, Tata Starbucks, NourishCo and Russia. In India, tea sales improved due to volume increases and higher realisations, Tata Starbucks’ topline increase was attributable to better in-store performance and increase in the number of stores. Improvement in NourishCo’s performance was attributable to strong growth in Tata Gluco Plus and to a lesser extent Himalayan. Our MAP brand in
Corporate Overview 01-48
Australia benefitted from the impact of full year of operations post acquisition and improvements through growth in grocery channel. In certain developed markets like UK, Canada and US, we grappled with the challenge to grow top line as there was significant competitive intensity and decline in black tea category. High commodity cost in the international markets had an impact on profit delivery. However, your Company has done well in the /specialty segments. To meet the increasing demand in the segment, we increased distribution of our super tea, Teapigs. Teapigs recorded good growth in UK, Canada, US and other international markets with increased distribution. Green tea performance also exceeded expectations. In UK, our green tea growth has been significant and ahead of category growth driven by the improved performance of Tetley Super Green tea. Green tea also recorded significant growth in India with ment in the beginning of the year and online activation in the second half of the year. Our green tea portfolio has also done well in other countries such as Canada and . In addition, we also launched fruit and herbals in UK and USA which received favourable response from consumers. In India, during the year, we launched Tata Coffee Grand, with a high impact launch which created desired buzz and visibility. The global marketing function continues to focus on developing a strong global brand portfolio with an enhanced global innovation agenda. TGB will increase focus on its 4 power brands namely Tetley, Tata Tea, EOC and Himalayan. These power brands will be managed in a globally consistent manner including creating a global brand identity. Sales from non branded business recorded improvements mainly due to improved performance in coffee / pepper plantations coupled with improvements in instant coffee sales driven by improved agglomerated coffee sales. However, profitability was flat mainly due to wage revision impacting the plantation business and soft tea commodity prices offsetting the favourable impact of higher coffee/pepper sales.
Performance of Key Geographies/ Segments India Your Company’s operations in India reflect a topline improvement of 6% driven by growth across all major brands. The growth has been achieved mainly due to improved volumes and higher realisation. Operating profit improved attributed to improved sales and lower blend cost despite higher investments behind brands. The Company’s growth plans for the Indian business are driven by strategic innovation, category expansion and entering white
Statutory Reports 49-124
Financial Statements 125-220
spaces in the market. In line with this, your Company launched two new products in the tea category during the year under review. Tata Tea Fusion is a good example of innovation that allows consumers the option of blending different types of teas to create a customised brew. With Tata Tea Gold Mixture, your Company entered white space geographies by launching the brand in Maharashtra, the second largest tea market in India which is dominated by local players. This tea blend was specially crafted to deliver the strength, thickness and aroma preferred by consumers in Maharashtra. Additionally, your Company introduced an instant coffee product in India under the brand Tata Coffee Grand. This product was launched in a competitive environment and at a time when coffee consumption is seeing growth in non southern markets in India. Tata Coffee Grand is an innovative product and the launch is in line with our strategy of category expansion. The product was tly developed by your Company and Tata Coffee Limited, which leverages our deep heritage in coffee from ‘Source to Sip.’ Sourced primarily from Tata Coffee’s own plantations in South India, these coffees are roasted and processed to perfection, making the product an intensely rich, fresh and aromatic coffee. The product is an innovative blend of the finest coffee powder and decoction crystals which gives consumers a ‘best in class’ taste experience in the instant coffee category. The brand launch was ed by an impactful advertising campaign. Tata Starbucks business continues to grow. The store count stands at 82 at the end of the financial year. The growth drivers mainly are improved in- store performance as well as increase in the number of stores. Your Company continues to be the value and volume leaders in the overall tea category and is also a market leader in the green tea category. The branded tea segment recorded volume and value growth aided by improvements in Tata Tea Gold, Tata Tea Agni, Chakra Gold, Kanan Devan and Gemini. These brands have been ed through various ment campaigns and on-ground /online activations during the year. Double digit growth in Tetley brand was led by Green tea category. Within this category, online activation in the 2nd half of the year met with good consumer response We are pleased to report that our brand campaign, ‘Jaago Re’, won the Gold in the ‘Best On-going Campaign’ category for the campaign titled ‘From Packaged Good to Packaging Good’, at the 15th edition of the Effies Awards organised by the Advertising Club of India. The award recognises advertising that has succeeded in building brands and increasing sales.
99
Annual Report 2015-16
United Kingdom
Australia
Tetley in UK has been rated the No. 2 FMCG social brand of 2015 by The Grocer, jumping seven places from ninth position last year. The Grocer leads the market as the UK’s only paid-for online service and weekly magazine with coverage of the whole FMCG sector.
Europe and Middle East
In a challenging market, Eight O’ Clock Coffee’s 2015-16 reported net sales recorded marginal improvement over the prior year. The underlying performance was impacted mainly due to increase in competitor intensity through additional promotional events as well as deeper discounting. In addition, there were new entrants in the Pods category which further intensified the competitive landscape. The profitability of the business was impacted in the earlier part of the year due to higher commodity costs but improved in the second half of the year. The brand continues to do well and grow volumes in a competitive market. In the tea category, the green tea business is performing well and is gaining share. Good Earth Tea recorded stable sales and plans are being readied for scaling up this brand. Sales of Tetley however were lower against the prior year largely due to promotional underperformance in black tea. The Herbal tea which was launched has seen good consumer response.
Canada The business launched its line of specialty teas called Tetley Signature collection. The launch was ed by 100
Connect with every sip
advertising to reinforce Tetley’s leadership position in the specialty tea segment. The tea also provides the customer with a string and tag/drawstring tea bag. The Company is pleased to announce that it maintains both volume and value market leadership in Canada. In addition Teapigs has gained distribution and market share in the segment.
Black tea category continues to dominate the market with around 80% of volume and 60% value. While the everyday black tea category is in decline, there is good growth in speciality, green and fruit & herbal categories. The market environment is challenging with intense competition resulting in pressure on margins in major grocery s and frequent retailer strategy change and SKU reviews. This was further exacerbated with hardening of commodity costs which impacted operating profits. However, there were pockets of improvements in UK. The green tea, specialty teas and the super tea, Teapigs witnessed impressive growth. Early last year, Tetley launched four new Super Green Teas, the first fortified green teas in the UK with proven health benefits. The taste, combined with vitamins and minerals and the functional benefits has been drawing in consumers making Super Green award winning and the No. 1 NPD in the UK The product earlier received the coveted gold stars in the 2015 Great Taste Awards and has now followed it up with the Product of the Year 2016 award. Backed by the success of Tetley super green teas in UK, a new range of super fruit products has been presented to key customers and listing has been secured with some major retailers.
United States of America
•
Tetley in Canada has been voted the Most Trusted Brand of Tea by Canadians in 2016 now for two years in a row by the Reader’s Digest in their annual Trusted Brand survey.
The Australian business benefited from increase in MAP pods sales with tea volumes showing a decline due to decreased on-shelf display at key retail s. The business continues to engage with retailers to review product placement plans which will help improve volumes. The profitability of the tea business improved due to lower promotional costs and optimisation of overheads. However, the coffee business was impacted on of higher spends behind brands. Tea business remained stable despite decline in mainstream black tea segment. Within the specialty range, new flavours were launched across steamed green and Fruit &Herbal range. A new product – Mr. Barista was launched in the coffee segment which had a positive customer response.
The TGB team in Western Europe achieved new placements for Tetley in the domestic tea fixtures in Spain, with 6 products launching in 100 El Corte Ingles stores, the biggest department store group in Europe. El Corte Ingles have also invited Tetley to showcase additional products at their trade fair. We have also successfully secured the listing of Tetley Decaf in 400 stores owned by Grupo DIA, one of the leading specialist discount groups in Europe. These listings will help in gaining momentum with Spanish consumers. The exposure to domestic consumers from this listing is expected to have a positive impact on the awareness of the Tetley brand and the possibility of introducing new products, at a later stage, custom made for the local palate. The business in reported a robust growth, reflected in its MAT volume and value growth aided by green and earl grey segments post relaunch. The business also grew in Portugal mainly aided by specialty greens. Russia business topline grew aided by price increases with consumers switching to lower cost brands due to prevailing economic conditions. However, the profitability was impacted due to macro-economic conditions which reflected in the exchange rates and interest rates. There was good execution of the launch plans for Tetley in the Middle East and we continue to consolidate our position in the region.
Corporate Overview 01-48
The TGB team in Poland extended the Vitax range, our specialty tea brand, with the introduction of standout flavours full of intriguing combinations which is expected to gain consumer traction and mitigate the historical underperformances Very recently we completed a restructuring of the sales and distribution network in Poland which has improved the operational efficiencies and is expected to improve the business performance.. In the Middle East, the execution of the launch continues ed by ment and in-store promotions. New launches under the Kanan Devan brand found favourable response from the hot tea shops.
Water Vertical Tata Gluco plus was the star performer in the water vertical. The brand has been performing extremely well and high double digit growth in volume and value were recorded during the year 2015-16. The new proposition of “Gas minus Energy Plus” and the visual changes on the packaging to communicate “Energy” for the brand were received very well by the consumers and have accelerated the brand’s growth rate. The growth trajectory has been intact despite price increases taken for the brand. We have strengthened our distribution through the Pepsi network with presence in Maharashtra, Karnataka, Gujarat and Kerala. Himalayan sales reflected double digit growth with price increases and focus on channel mix. During the year, a television commercial was run with the objective of establishing Himalayan’s “Source” and “Nature” credentials.
Non Branded Business Our Non Branded business consists of plantations and extraction verticals. In plantations, we primarily manufacture and sell tea, coffee and other plantation produce like pepper whilst the extraction business is split between instant tea and instant coffee. In the current year, improvements were recorded in the Coffee extraction business and in coffee/pepper plantation business. In the instant coffee business, there were improvements in exports sales to the African and Russian markets. On the plantation side of the business, while the sales volumes and pricing generally improved, profitability was impacted by soft tea prices, wage revisions in the plantations. The instant tea business benefitted from customer acquisitions, improved sales realisation and lower operating costs. The instant coffee operation continues to focus on operational discipline, cost reduction and sustainability in operations. With a specific focus on cost reduction, various alternatives have been pursued to reduce the power and fuel costs in the instant coffee factories. The Theni Unit won the CII Sustainability award and Toopran unit, the National level Energy conservation award. We
Statutory Reports 49-124
Financial Statements 125-220
are pleased to report that the Instant Tea unit in Munnar won the prestigious Kerala State Pollution Control Board Award for the second year.
Outlook – Consumer, Commodity and Competition As detailed earlier in the document, the market environment is different across geographies and operating challenges are likely to continue. While overall global demand for tea is growing, in some developed markets, we face the challenge of decline mainly in the black tea category reflecting a shift in consumer consumption patterns. However, there are positive emerging trends - (i) growth in health and wellness segment with increasing recognition of health benefits of tea vs carbonated beverages, (ii) consumption shift towards non-black (includes green, specialty and Fruit & Herbal), (iii) increasing preference for / novelty/ artisanal products and (iv) emergence of alternate channels like specialty tea stores/ cafes and e-commerce platform with emphasis on personalisation. In developed markets, we expect the retail environment to remain competitive with increasing retailer consolidation and plan to continue with aggressive promotions strategy to sustain growth levels. We also expect the significance of modern trade to increase over traditional trade in these markets exacerbating the competitive environment. In addition to this, we also foresee private own-label brands and local brands continuing to be major competitors. With our vision to become the most ired natural beverages company in the world, Tata Global Beverages has stepped up its innovation agenda to leverage the emerging growth trends in our markets. We continue to commit resources to bolster our R&D pipeline and launch new products with a focus on specific themes: health & wellness and convenience (new formats), isation and expansion of non-black tea portfolio. For example, in the current year we launched Tetley Super Green in UK which provides functional benefits as part of our strategy to increase presence in Health & Wellness segment, launched Tata Tea Fusion in India and accelerated expansion of our super brand Teapigs as part of isation strategy and customised product for entry in white space markets e.g. Tata Tea Gold Mixture for Maharashtra. We also continue to invest in growth for our JVs: Tata Starbucks and NourishCo (Water) and scale up businesses in Middle East, Australia (Coffee) and USA (Tea). We also continuously review our cost structure and operating efficiencies in order to remain competitive and to leverage funds for growth.
101
Annual Report 2015-16
Outlook - Interest Rates and Exchange Rates Given the global operations of our Company, both interest rates and exchange rates in various currencies / geographies are of significant importance to our business. Most geographies that we operate in, witnessed a flat interest rate, mainly as inflation and inflationary expectation remained subdued. Interest rates eased in India driven by cut in policy rates by its central bank and are further expected to drift downwards marginally. Future impact of interest rates will depend on the outlook and action by the US Federal Reserve and also events like the impact of the UK referendum. The rupee saw an overall weakness given the probability of interest rates hike in the US and sudden sharp depreciation of its currency by China. The rupee however recovered some of its losses on of its apex bank instilling confidence by curtailing the volatility and some optimism that the Fed would gradually hike interest rates in US. Also expectations of rate cuts by RBI post budget prompted exporters to convert their receipts and kept the Rupee on a soft note. The rupee is expected to trade with a weaker bias owing to fears of Yuan devaluation and rate hikes by Fed. Sterling weakened against USD, starting from third quarter and is expected to weaken further given the uncertainty in outcome of the referendum on possible UK exit from the European Union coupled with dollar strengthening on the expectation of US rate hikes later in the year. The outcome of the referendum could impact currency and interest rates and potentially trade flows within the European Union. Russia macro- economic conditions remained uncertain given the high volatility in the oil prices. The market witnessed two-way movements in both interest rates and currency. The Company is governed by Board approved treasury policies with respect to hedges for its exposures arising out of interest rate risks and foreign exchange risks, and is reasonably covered in respect of its immediate trade flows.
Opportunities The focus on healthier lifestyles has created a very positive market for our product range. There is a big opportunity across geographies to ‘extend our business footprint by entering the Fruit and Herbal segments with Tetley’. Continuing its drive into functional teas, Tetley in the UK is launching three new Tetley Super Green Teas extending the functional benefits of the range to feature European Food Standards Agency approved health claims relating to heart health, detox and beauty. The momentum behind Super Green Tea enabled Tetley in the UK to grow retail value sales within the Green tea segment by 28% year on year. With the Boost and Immune variants doing
102
•
Connect with every sip
exceptionally well, it was important to extend the range to include other popular health benefits which are appealing to younger consumers who have been turning away from tea. The wide range of benefits offered in this range now gives consumers an added reason to drink green tea. The coffee category in India is poised to grow in the coming years and Tata Global Beverages is well positioned to enter this category. Tata Coffee Grand gives consumers the convenience of instant coffee along with excellent taste and flavour.
Threats, Risks and Concerns There is a continuous decline in the everyday black tea category in some of the key markets where your Company has significant operations. The Company is driving innovation in tea and non-tea categories to adapt to the changing environment. Intense competition in the market place with increased investment in promotions/ media impacts Company’s performance in market. The Company reviews and monitors its pricing and promotion strategy very closely and benchmarks with the industry practices. Significant increase in tea prices and inability to the increase to the consumer may impact earnings. Further, political, social and weather changes may impact availability as well. The Company focuses on development of market relationships, innovation of alternate supplier channels and exploring alternate sources of teas in other parts of the world to safeguard the earnings and availability. Tea is a multi harvest agricultural commodity and is sold through public auction or by private treaty. There is no futures market in tea. Price levels reflect supply/demand position and as an agricultural crop supply/demand balance may change quickly when weather conditions are adverse. To manage supply risk, the Company spreads its buying between public auction and private treaties. Cyclical swings in coffee commodity markets are common and the most recent years have been especially volatile for the price of coffee. Increases in the cost of green coffee could reduce our gross margin and profit. There can be no guarantee that we will be successful in ing commodity price increases on to our customers without losses in sales volume or gross margin. Precipitous decreases in the cost of green coffee could result in significant headwinds causing us to lower sales prices before realising cost reductions in our green coffee inventory. TGB has a robust framework in place to protect its interests from risks arising out of market volatility. Based on market intelligence and continuous monitoring, the sales and procurement teams take appropriate strategy to deal with such market volatility.
Corporate Overview 01-48
Volatility in currency exchange movements like RUB, CAD, USD, GBP and AUD can pose challenges to the Company’s operations through earnings dilution. The Company has established currency hedging policies and practices to manage these risks. The referendum on Brexit can also pose some risks if the decision by the UK is to exit the EU. While the potential implications arising out of absence of free trade access in such a scenario is difficult to predict in the short to medium term, the currency is most likely to experience sharp depreciation which can have an inflationary impact on the business. Changes in regulations relating to taxation, product and other areas if significant could impact performance.
Risk Management The Company has a system of documenting and reviewing key risks. Apart from management reviews, the risks are also periodically reviewed by the Board and its various sub committees including the Risk Management Committee.
Human Resources and Industrial Relations Your Company implemented several initiatives towards enhancing capabilities and to our growth agenda. The key initiatives were: •
Re-energising the organisation: A group wide survey was conducted in association with Gallup wherein we identified 20 engagement driver questions which saw a very high level of participation and the results showed that 14 drivers have a significant positive change as per Gallup benchmarks.
•
Brewing Brilliance: This is an online peer to peer recognition program wherein every employee can share and convey appreciation & recognition to other colleagues. This has been very successful.
•
Perfect Cup: The Company introduced a Global Reward & Recognition programme celebrating a culture of success and recognition.
•
High Performance and Reward: A Global Reward Strategy Benchmarking was undertaken and a key summary was shared with Senior Leadership for their inputs and . A revised approach to the Annual Salary Review process aligned to the recommendation of the benchmarking report and best-in class practices is proposed to be implemented.
•
Statutory Reports 49-124
Financial Statements 125-220
Talent Management Framework - An Integrated approach to Talent Management focusing on Talent, Assessment, Aspiration, Development and Impact was introduced with focus on aligning the Key HR process with talent management process to create an effective framework for attracting and retaining High performing Talent.
The total number of employees on the rolls of Tata Global Beverages Limited as of 31st March 2016 was 2,552.
Internal Controls and Governance Your Company has adequate internal controls and robust systems in place. The Audit Committee of your Company review such controls periodically. The Internal audit function carries out a focused internal audit programme in consultation with the Audit Committee. The internal audit primarily focuses on the adequacy of appropriate systems and controls. The Tata Code of Conduct has prescribed guidelines outlining the key disclosure and governance requirements besides mandating the observance of applicable statutory requirements by the Company. Your Company and its senior management have affirmed adherence to the Code.
Cautionary statement Certain statements made in this report relating to the Company’s objectives, projections, outlook, expectations, estimates, among others may constitute ‘forward-looking statements’ within the meaning of applicable laws and regulations. Actual results may differ from such expectations, projections etc., whether express or implied. Several factors could make a significant difference to the Company’s operations. These include climatic conditions, economic conditions affecting demand and supply, government regulations and taxation, natural calamity, currency rate changes, among others over which the Company does not have any direct control.
Conclusion Your Company’s primary focus will be to grow volumes across markets. TGB will address each market depending on local conditions and consumer trends. While we recognise that the global environment is extremely challenging there are new opportunities emerging to meet consumer needs. Tata Global Beverages will focus on profitable growth through a mix of brand led growth, innovation, efficient cost management and successfully scaling up new businesses.
103
Annual Report 2015-16
•
Connect with every sip
Report on Corporate Governance for the Financial Year 2015-16 1.
Company’s Philosophy on Code of Governance
The corporate governance philosophy of your Company ensures transparency in all dealings and in the functioning of the management and the Board. These policies seek to focus on enhancement of long-term shareholder value without compromising on integrity, social obligations and regulatory compliances. The Company operates within accepted standards of propriety, fair play and justice and aims at creating a culture of openness in relationships between itself and its stakeholders. It has set up a system which enables all its employees to voice their concerns openly and without any fear or inhibition. The corporate governance philosophy of the Company has been further strengthened through the Tata Code of Conduct, Tata Business Excellence Model, Tata Code for Prevention of Insider Trading and Code of Corporate Disclosure policies.
As a global organisation, the corporate governance practices followed by your Company are compatible with international standards and best practices. As a responsible corporate citizen, your Company had established systems to encourage and recognise employee participation and volunteering in environmental and social initiatives that contribute to organisational sustainability, systematic training, learning and personal growth, conservation of energy and other scarce resources, promoting safety and health of its employees and of the neighbouring community etc. These actions have become an integral part of your Company’s operating plans and are not meant for building of image or publicity.
2.
Board of Directors a. Composition & Category of Directors
The Company has an optimum combination of executive and non-executive directors including woman directors. As on 31st March, 2016, the Company had 11 directors and the composition of the Board of Directors is given in the table below. The Chairman of the Board is a non-executive director and 81.82% of the Board comprises of non-executive directors. In of Regulation 17 of Securities and Exchange Board of India (Listing Obligations and Disclosure Requirements) Regulations, 2015, at least 50% of the Board should comprise of non-executive independent directors with at least one woman director. The non-executive independent directors constituted 54.55% of the Board as at 31st March 2016. The Company has three women directors on the Board.
Category
Number of Directors
%
Non-Independent Directors
3
27.27
Managing & Executive Directors
2
18.18
Independent Directors
6
54.55
11
100.00
Total
104
Corporate Overview 01-48
b.
Details of attendance of each Director at Board Meetings and at the last year’s Annual General Meeting with particulars of their other Directorships and Chairman/hip of Board Committees (excluding Tata Global Beverages Limited) along with the number of shares and convertible instruments held by the Directors showing the position as at 31st March 2016 are given in the following table:
Name of Director
Position
Attendance at Board Meetings Held
Attended
Last AGM
No. of Directorships and Chairman/ hip of Board Committees equity in other Indian public companies shares Held Director Committee Committee Member Chairman
Mr. Cyrus P Mistry
C, NED & NI
9
9
Yes
9
-
-
33,000
Mrs. M Srinivasan
NED & I
9
6
Yes
6
-
-
-
Mr. Analjit Singh
NED & I
9
2
No
5
-
-
-
Mr. V Leeladhar
NED & I
9
9
Yes
5
4
-
-
Mrs. Ranjana Kumar
NED & I
9
9
Yes
4
1
2
-
Mr. Darius Pandole
NED & I
9
9
Yes
2
2
-
-
Mr. S Santhanakrishnan NED & NI
9
6
Yes
7
-
4
-
Mrs. Ireena Vittal
9
7
Yes
6
5
-
-
NED & I
Mr. Harish Bhat
NED & NI
9
9
Yes
5
3
1
-
Mr. Ajoy Misra
MD
9
9
Yes
2
-
-
-
Mr. L KrishnaKumar
ED
9
9
Yes
1
-
-
-
C: Chairman; NI: Non-Independent; NED: Non-Executive Director; I: Independent Director; MD: Managing Director; ED: Executive Director
Video / teleconferencing facilities are used as and when required to facilitate Directors at other locations to participate in the meetings.
The Company has not issued any convertible instruments.
Note: Other Directorships do not include Directorships of private limited companies, foreign companies, companies ed under Section 25 of the Companies Act, 1956 and Alternate Directorships.
Financial Statements 125-220
Statutory Reports 49-124
Particulars about Director retiring by rotation and eligible for re-appointment is given in the Annexure to the Notice.
The Company has received declarations on criteria of independence as prescribed in Section 149 of Companies Act 2013 and Regulation 16 (1) (b) of Securities and Exchange Board of India (Listing Obligations and Disclosure Requirements) Regulations, 2015 from the Directors of the Company who have been classified as Independent Directors.
As will be noted from the table above, no director is member of more than 10 Board Committees or Chairman of more than 5 Board Committees across all companies where he/she is a Director. Further no Independent Director serves as Independent Director in more than 7 listed companies.
Chairmanship/hip of Board Committees includes hip of Audit and Stakeholder Relationship Committees of Indian public limited companies only.
105
Annual Report 2015-16
c.
Number of board meetings and dates on which held
During 2015-16, the Board met nine times on 30th April, 2015, 28th May, 2015, 6th August, 2015, 14th August, 2015, 29th October, 2015, 5th November, 2015, 14th January, 2016, 10th February, 2016 and 31st March, 2016. The maximum time gap between two board meetings was less than 120 days. Minutes of the meetings of all the Board and Committees are circulated to all the Directors.
d. No director of the Company is related to any other director of the Company.
e.
f.
Familiarisation programme for Independent Directors The Independent Directors have been familiarised with the Company, their roles and responsibilities in the Company, nature of the Industry in which the Company operates, business model of the Company etc. The details of familiarisation programmes imparted to the Independent Directors during 2015-16 are put up on the website of the Company and can be accessed at http://www. tataglobalbeverages.com/company/leadership/ board-of-directors
Code of conduct Tata Code of Conduct is a comprehensive written code which is applicable to all employees including the Managing and Executive Directors. A separate code of conduct applicable to the Non-Executive Directors was laid down by the Board. Both Tata Code of Conduct and the Code of Conduct for Non-Executive Directors have been posted on the website of the Company and can be accessed at http://www.tataglobalbeverages.com/company/ leadership/board-of-directors. The Board of Directors in their meeting held on 14th August 2015 have adopted the revised / refreshed Tata Code of Conduct which came into effect from 7th August, 2015.
In respect of financial year 2015-16, all Board and Senior Management personnel of the Company have affirmed compliance with the code as applicable to them and a declaration to this effect signed by the Managing Director is published in this Annual Report.
106
g.
•
Connect with every sip
Formal letter of appointment to the independent directors
The Company has issued formal letter of appointment to all the Independent Directors on their appointment explaining inter-alia, their roles, responsibilities, code of conduct, functions and duties as directors of the Company. The and conditions of appointment of independent directors have been hosted on the website of the Company and can be accessed at http://www. tataglobalbeverages.com/docs/default-source/ board-of-directors/-and-conditions-ofappointment-of-independent-directors.pdf
h.
Separate meeting of independent directors
During the financial year 2015-16, the independent directors met separately without the presence of non-independent directors on 31st March, 2016 in compliance with Regulation 25 (3) of the Securities and Exchange Board of India (Listing Obligations and Disclosure Requirements), Regulations, 2015.
The independent directors at their meeting inter-alia discussed the following:
i.
Reviewed the performance of nonindependent directors and the Board as a whole;
ii.
Reviewed the performance of the Chairman of the Company, taking into the views of executive directors and nonexecutive directors;
iii.
Assessed the quality, quantity and timeliness of flow of information between the Company management and the Board that is necessary for the Board to effectively and reasonably perform their duties.
3.
Audit Committee
a
Brief description of of reference A qualified and independent Audit Committee has been set up by the Board in compliance with the requirements of Regulation 18 of Securities and Exchange Board of India (Listing Obligations and Disclosure Requirements) Regulations, 2015 and Section 177 of the Companies Act, 2013. The of reference of the Audit Committee are inter-alia as under:
Corporate Overview 01-48
i.
Review of the quarterly and half yearly financial results with the management and the statutory auditors;
Review with the management and statutory auditors of the annual financial statements before submission to the Board;
ii.
iii.
Review with the management, statutory auditors and the internal auditors about the nature and scope of audits and of the adequacy of internal control systems;
iv.
Consideration of the reports of the internal auditors and discussion about their findings with the management and suggesting corrective actions wherever necessary;
v.
Review of the financial reporting process and disclosure of financial information;
vi.
Review of the adequacy of the internal audit function;
vii.
Look into the reasons for any substantial defaults in payment to the depositors, debenture-holders, shareholders (in case of non-payment of declared dividend) and creditors, if any;
viii.
Recommending the appointment and removal of External Auditors, fixation of audit fee and approval for payment for any other services;
ix.
Review and monitor statutory auditor’s independence and performance and effectiveness of audit process; Approval or any subsequent modification of transactions with related parties;
Financial Statements 125-220
Statutory Reports 49-124
xi.
Scrutiny of inter-corporate loans and investments;
xii.
Evaluation of internal financial controls and risk management systems;
xiii.
Review the functioning of the whistle blower mechanism;
xiv.
Frame policies in relation to implementation of the Code of Conduct for Prevention of Insider Trading (Code) and supervise its implementation under the overall supervision of the Board;
xv.
Reviewing the Company’s financial and risk management policies;
xvi. Authority to review / investigate into any matter covered by Section 177 of the Companies Act, 2013 and matters specified in Part C of Schedule II of the Securities and Exchange Board of India (Listing Obligations and Disclosure Requirements), Regulations, 2015.
b.
Composition, names of and Chairman
As on 31st March 2016, all of the Audit Committee are Non-Executive Directors and four of them, including the Chairman are Independent Directors. All the of the Audit Committee are financially literate as defined in Regulation 18 (1)(c) of Securities and Exchange Board of India (Listing Obligations and Disclosure Requirements) Regulations, 2015.
Mr. V Leeladhar is the Chairman of the Audit Committee. He has expert knowledge in banking and financial matters. He was present at the last Annual General Meeting of the Company held on 14th August 2015.
x.
The composition of the Audit Committee as on 31st March, 2016 and particulars of attendance by the at the meetings of the committee held in 2015-16 are given below: Name
Category
No. of meetings during 2015-16 Held
Attended
Mr. V Leeladhar, Chairman
Independent, Non-Executive
7
7
Mrs. Ranjana Kumar
Independent, Non-Executive
7
6
Mr. Darius Pandole
Independent, Non-Executive
7
7
Mr. S Santhanakrishnan
Non-Independent, Non-Executive
7
5
Mrs. Ireena Vittal
Independent, Non-Executive
7
6
Mr. Harish Bhat
Non-Independent, Non-Executive
7
4
107
Annual Report 2015-16
c.
Meetings and attendance during the year During 2015-16, seven Audit Committee meetings were held on 27th May 2015, 5th August 2015, 28th October 2015, 5th November 2015, 9th February 2016, 4th March, 2016 and 30th March 2016. The Audit Committee Meetings are attended by invitation by the Managing Director, Executive Director, Chief Financial Officer, Chief Internal Auditor and the Statutory Auditors. The Company Secretary acts as the Secretary of the Audit Committee.
4.
Nomination and Remuneration Committee
a.
Brief description of of reference The Board has set up a Nomination and Remuneration Committee. This Committee is inter-alia responsible for: i.
ii.
the Board in matters related to set up and composition of the Board, its committees and the leadership team including formulation of criteria for determining qualifications, positive attributes and independence of a director and recommend to the Board of Directors a policy relating to remuneration of the Directors, Key Managerial Personnel and other employees Carry out evaluation of every director’s performance and the Board and independent directors , as may be required, in evaluation of the performance of the Board, its committees and individual directors
b.
Connect with every sip
iii.
the Board in matters related to remuneration of directors, KMP, executive team and other employees
iv.
Extend oversight on the familiarisation programme of directors
v.
Extend oversight on the HR philosophy , HR and People Strategy and key HR practices
vi.
Recommending to the Board, the remuneration package of Managing and Executive Directors, including their annual increment and incentive remuneration after reviewing their performance
vii.
Devising a policy on diversity of board of directors
viii.
Identifying persons who are qualified to become directors and who may be appointed in senior management in accordance with the criteria laid down, and recommend to the board of directors their appointment and removal
ix.
Whether to extend or continue the term of appointment of the independent directors, on the basis of the report of performance evaluation of independent directors.
Composition, name of and Chairperson As on 31st March 2016, the Nomination and Remuneration Committee consisted of five directors, all of whom are non-executive directors. Mrs. Ranjana Kumar, Independent Director is the Chairperson of the Committee.
The composition of the committee as at 31st March, 2016 and particulars of attendance by the at the meetings of the committee held in 2015-16 are given below: Name
108
•
Category
No. of meetings during 2015-16 Held
Attended
Mrs. Ranjana Kumar, Chairperson
Independent, Non-Executive
2
2
Mr. Cyrus P Mistry
Non-independent, Non-Executive
2
2
Mr. V Leeladhar
Independent, Non-Executive
2
2
Mr. Darius Pandole
Independent, Non-Executive
2
2
Mr. Harish Bhat
Non-independent, Non-Executive
2
2
Corporate Overview 01-48
c.
d.
e.
Statutory Reports 49-124
Meetings and attendance during the year
targets, growth & diversification, remuneration in other companies of comparable size and complexity, performance of the directors at meetings of the Board and of the Board Committees etc.
The Nomination and Remuneration Committee met twice during 2015/16 on 26th May, 2015 and 31st March, 2016 and the particulars of attendance are mentioned in 4(b) above.
Performance Evaluation Pursuant to the provisions of Companies Act, 2013 and the applicable provisions of the Securities and Exchange Board of India (Listing Obligations and Disclosure Requirements) Regulations, 2015, the Board has carried out the Annual performance evaluation of its own performance, the Directors individually as well as the evaluation of the working of its Audit, Nomination and Remuneration, Stakeholder Relationship and CSR Committees. A structured questionnaire was prepared after taking into consideration inputs received from the Directors covering various aspects of the Board’s functioning such as adequacy of the composition of the Board and its Committees, Board culture, execution and performance of specific duties, obligations and governance. A separate exercise was carried out to evaluate the performance of individual directors including the Chairman of the Board who were evaluated on parameters such as guidance/ to management outside Board/ Committee meetings, degree of fulfilment of key responsibilities, effectiveness of meetings etc. The performance evaluation of the Independent Directors was carried out by the entire Board. The Directors expressed their satisfaction with the evaluation process.
Remuneration policy
The Company’s Remuneration policy for Directors, Key Managerial Personnel and other employees is mentioned in the Directors Report.
The remuneration policy followed by the Company takes into consideration performance of the Company during the year and of the Managing and Executive Directors on certain parameters, such as condition of the industry, achievement of budgeted
Financial Statements 125-220
5.
Remuneration of Directors
a)
During the year, there was no pecuniary relationship or transaction between the Company and any of its Non-executive Directors apart from sitting fees and commission.
b)
Non-Executive Directors’ compensation and disclosures
The non-executive Directors, including Independent Directors, are paid Sitting fees for attending the meetings of the Board and Committees of the Board. With effect from 28th May, 2015, the Company pays a fee of Rs. 30,000 per meeting per director for attending meetings of the Board, Audit, Nomination and Remuneration and Executive Committees (Rs. 20,000 in case of Mr. Cyrus Mistry, Chairman and Mr. Harish Bhat, Director). For meetings of all other Committees of the Board, a sitting fee of Rs. 20,000 per meeting per director is paid (Rs. 15,000 in case of Mr. Cyrus Mistry, Chairman and Mr. Harish Bhat, Director).
Within the ceiling of 1% of net profits of the Company computed under the applicable provisions of the Companies Act, 2013, the Non-Executive Directors including Independent Directors are also paid a commission, the amount whereof is determined by the Board. The basis of determining the specific amount of commission payable to a Non-Executive Director is related to his attendance at meetings, role and responsibility as Chairman/Member of the Board/Committees and overall contribution as well as time spent on operational matters other than at the meetings. The shareholders of the Company had approved payment of commission to the non-executive directors at the Annual General Meeting held on 26th August, 2014, which is valid up to the financial year ended 31st March 2019. No Stock option has been granted to the Non-Executive Directors.
109
Annual Report 2015-16
•
Connect with every sip
Non-Executive Directors’ Remuneration paid in 2015-16 and payable for 2015-16 Rs. in Lakhs
Mr. Cyrus P Mistry Mrs. Mallika Srinivasan Mr. Analjit Singh Mr. V. Leeladhar Mrs. Ranjana Kumar Mr. Darius Pandole Mr. S. Santhanakrishnan Mrs. Ireena Vittal Mr. Harish Bhat
Commission* (Relating to 2014-15) 12.00 8.00 60.00 42.00 35.00 30.00 25.00 -
Commission# (Relating to 2015-16) 11.00 4.00 59.00 45.00 39.00 28.00 28.00 -
Sitting Fees 2.20 1.70 0.60 7.85 6.30 5.55 4.35 3.85 3.65
*Paid in 2015-16 # Payable in 2016-17
c)
Note: The resolutions appointing these directors do not provide for payment of severance fees.
(i) & (ii) The Remuneration details of Managing / Executive Directors are mentioned below:
Salary Allowances and perquisites Contribution to Retiral Funds Incentive (relating to 2015-16) Stock option No. of Shares held Service Contract Notice period
Rs. in Lakhs Mr. L KrishnaKumar Executive Director 95.35 60.25 22.47 73.75 5 years from 1st April 2013 6 Months
In addition, both Mr. Ajoy Misra and Mr. L. KrishnaKumar drew the following remuneration during 2015-16 from an overseas subsidiary of the Company: Rs. in Lakhs
Salary and Benefits
Mr. Ajoy Misra Managing Director 114.39 66.52 26.94 73.97 5 years from 1st April 2014 6 Months
Mr. Ajoy Misra Managing Director 65.35
Mr. L KrishnaKumar Executive Director 42.39
Note: The remuneration drawn in GBP has been converted into INR at average exchange rate.
(iii) The of appointment of the Managing and Executive Directors provide that the appointment may be terminated by either party by giving to the other party six months’ notice of such termination or the Company paying six months remuneration in lieu thereof.
(iv) Stock options
110
Note: The resolutions appointing these directors do not provide for payment of severance fees.
The Company has not granted Stock Option to any of its Directors.
Corporate Overview 01-48
6.
Statutory Reports 49-124
Financial Statements 125-220
Stakeholder Relationship Committee a. Name of the Non-Executive Director heading the Committee
As on 31st March, 2016, the Stakeholder Relationship Committee comprised of 3 . Mr. V. Leeladhar is the Chairman and Mr. S. Santhanakrishnan and Mr. L. KrishnaKumar are the other of the said Committee.
The Committee held four meetings during 2015-16 on 8th June, 2015, 7th August, 2015, 9th February, 2016 and 30th March, 2016. The representatives of the Registrars are sometimes present at these meetings. The Committee’s of reference, inter-alia includes consideration and resolving the grievances of shareholders. The Committee also oversees the performance of the Registrar and Share Transfer Agent and recommends measures for overall improvement of the quality of investor services as and when need arises.
To expedite the process of share transfers, the Board has delegated the power of share transfer to the Registrars and share transfer agent and share transfer formalities are approved by them on a fortnightly basis. The composition of the Committee and details of attendance by its at the meetings of the Committee held in 2015-16 are given below:
b.
Name
Category
Mr. V Leeladhar, Chairman Mr. S Santhanakrishnan Mr. L. KrishnaKumar
Independent, Non-Executive Non-Independent, Non-Executive Non-Independent, Executive
No. of meetings during 2015-16 Held Attended 4 4 4 2 4 4
Name and designation of Compliance Officer
Mr. V Madan, Vice-President & Company Secretary is the Compliance Officer for complying with requirements of Securities laws and the Securities and Exchange Board of India (Listing Obligations and Disclosure Requirements) Regulations, 2015.
Number of shareholders’ complaints received, number not solved to the satisfaction of shareholders and number of pending complaints
c.
Given below are the position of queries/complaints and other correspondences received and attended to during 2015-16 in respect of equity shares: Equity Shares 1,978 1,333 3,281 30
For non-receipt of dividend, shares lodged for transfer, repayment cheques Other letters received from shareholders Queries/complaints redressed Pending queries/complaints as on 31/03/2016* *Replied in April 2016
Every letter received from the investors is replied and the response time for shareholders’ correspondences during 2015-16 is shown in the following table: Total number of correspondences received during 2015-16 Replied within 1 to 4 days of receipt Replied within 5 to 7 days of receipt Replied within 8 to 15 days of receipt Replied after 15 days of receipt* Received in last week of March 2016 and replied in April 2016
Number 3,311 2,084 696 481 20 30
% 100.00 62.94 21.02 14.53 0.60 0.91
* 15 queries pertained to issue of duplicate dividend warrants which were awaiting completion of reconciliation by bankers. Remaining 5 correspondences pertained to SEBI Complaints and involved retrieving of old records and hence took longer time to deal with. 111
Annual Report 2015-16
Connect with every sip
Promptness in attending to correspondences of shareholders is shown in the following chart:
Replied within 1 to 4 days of receipt
2,084
Replied within 5 to 7 days of receipt
696
Replied within 8 to 15 days of receipt
481
Replied after 15 days of receipt
20
Received in last week of March 2016 and replied in April 2016
30
The shares of the Company are traded in dematerialised form. A table showing the requests received for dematerialisation/ transfers during 2015/16 is given below: Transfers No. of requests
Transfers No. of Shares
Demats No. of requests
Demats No. of Shares
Lodged
494
6,11,977
1,255
12,59,580
Processed
216
3,77,946
674
7,64,286
Objections
274
2,27,081
567
4,68,164
4
6,950
14
27,130
Pending as on 31/03/2016
•
Note: 97.56% of the issued share capital of the Company is held in dematerialised form as on 31.03.2016.
7.
Other Board Committees
The Board has constituted following other Board committees besides the committees mentioned above:
a)
Ethics and Compliance Committee: The Board has constituted an Ethics and Compliance Committee to look into the requirements under Insider Trading Regulations including the Group guidelines on Insider Trading and Tata Code of Conduct. Three meetings of the said committee were held during 2015-16 on 7th August, 2015, 9th February, 2016 and 30th March, 2016. The composition of the Committee and details of attendance by its at the meetings are given below: Name
112
Category
No. of meetings during 2015-16 Held
Attended
Mr. V Leeladhar, Chairman
Independent, Non-Executive
3
3
Mrs. Ranjana Kumar
Independent, Non-Executive
3
3
Mr. Ajoy Misra
Non-Independent, Executive
3
3
Corporate Overview 01-48
b)
Financial Statements 125-220
Statutory Reports 49-124
Corporate Social Responsibility Committee: The Board has constituted a Corporate Social Responsibility Committee (CSR) to look into the following: yy
Matters specified in Section 135 of the Companies Act 2013 which inter-alia includes:
(a)
formulate and recommend to the Board, a Corporate Social Responsibility Policy which shall indicate the activities to be undertaken by the company as specified in Schedule VII;
(b)
recommend the amount of expenditure to be incurred on the activities referred to in clause (a);
(c)
monitor the Corporate Social Responsibility Policy of the Company from time to time.
yy
Monitor and provide guidance on Company’s policies on environment management, social responsibilities, health & safety, product stewardship, community development, principles of managing branded operations, etc.
yy
Provide guidance on welfare activities in and around Munnar.
Two meetings of the CSR Committee were held during 2015-16 on 28th October, 2015 and 30th March, 2016. The composition of the Committee and details of attendance by its at the meetings are given below: Name
c)
Category
No. of meetings during 2015-16 Held
Attended
Mrs. Ranjana Kumar, Chairperson
Independent, Non-Executive
2
2
Mr. V Leeladhar
Independent, Non-Executive
2
2
Mr. S Santhanakrishnan
Non-Independent, Non- Executive
2
1
Mr. Ajoy Misra
Non-Independent, Executive
2
2
Dr. S Parasuraman
Expert member (Not a Board member)
2
0
Executive Committee The Board has constituted an Executive Committee to review business and strategy, long term financial projections and cash flows, capital/revenue budgets and capital expenditure programmes, acquisition/divestment, business restructuring proposals, senior management succession planning and any other item that the Board may decide to delegate. No meetings of the said committee were held during 2015-16. However the matters mentioned above were reviewed by the Board from time to time. The composition of the Committee is given below: Name
Category
Mr. Cyrus P Mistry, Chairman
Non -Independent, Non-Executive
Mrs. Ireena Vittal
Independent, Non-Executive
Mr. Harish Bhat
Non-Independent Non- Executive
Mr. Ajoy Misra
Non-Independent, Executive
Mr. L KrishnaKumar
Non-Independent, Executive
113
Annual Report 2015-16
d)
•
Connect with every sip
Risk Management Committee
The Risk Management Committee of the Board of Directors has been entrusted with the responsibility to assist the Board in overseeing and approving the Company’s risk management framework. The Company has a comprehensive Risk policy and a Risk detailing the risks that the Company faces under various categories like strategic, financial, commercial, operational, IT, legal, regulatory, people, reputational and other risks and these have been identified and suitable mitigation measures have also been formulated. The Risk Management Committee reviews the key risks and the risk and the mitigation measures periodically.
Three meetings of the Risk Management Committee were held during 2015-16 on 5th August, 2015, 28th October, 2015 and 30th March, 2016. The composition of the Risk Management Committee as on 31st March, 2016 and particulars of attendance by the at the meetings are given below: Name
8.
Category
No. of meetings during 2015-16 Held
Attended
Mr. V Leeladhar, Chairman
Independent, Non-Executive
3
3
Mrs. Ranjana Kumar
Independent, Non-Executive
3
3
Mr. Darius Pandole
Independent, Non-Executive
3
3
Mr. S Santhanakrishnan
Non-Independent, Non-Executive
3
2
Mrs. Ireena Vittal
Independent, Non-Executive
3
3
Mr. Harish Bhat
Non-Independent, Non-Executive
3
3
General Body Meetings a. Location and time where last three AGMs were held, whether any special resolutions ed in the previous 3 AGMs
The last three Annual General Meetings of the Company were held as under:Year
Location
Date
Time
No. of Special Resolutions approved at the AGM
2012- 2013
The Oberoi Grand, 15, Jawaharlal Nehru Road, Kolkata-700 013
15th July, 2013
10.30 a.m.
2013-2014
Same as above
26th August, 2014
10.30 a.m.
2
2014-2015
Same as above
14th August, 2015
10.30 a.m.
Nil
Nil
b
Whether any special resolution ed last year through postal ballot – details of voting pattern
No special resolutions were ed during 2015-16 through postal ballot.
c
Person who conducted the postal ballot exercise
N.A.
d
Whether any special resolution is proposed to be conducted through postal ballot
At present there is no proposal to any special resolution through postal ballot.
e
Procedure for postal ballot
Does not arise
114
Corporate Overview 01-48
9.
Statutory Reports 49-124
Financial Statements 125-220
Means of Communication a
Quarterly results
The quarterly results are published in the newspapers and displayed on the Company’s website
b
Newspapers wherein results normally published
The quarterly results are generally published in Business Standard and Pratidin (Bengali).
c
Any website, where displayed
The quarterly results of the Company are put on the website of the Company after these are submitted to the Stock Exchanges. Our website address is www.tataglobalbeverages.com
d
Whether it also displays official news releases
Yes
e
The presentations made to institutional investors or to analysts
The Company made a presentation to financial analysts on 28th May, 2015 after the results for the financial year 2014-15 were approved by the Board. A similar presentation was also made on 6th November 2015 after the results for the six months ended 30th September 2015 were approved by the Board. For the quarters ended 30th June 2015 and 31st December 2015, there were conference calls with the financial analysts on 6th August 2015 and 11th February 2016 respectively, post the financials for the respective quarters were approved by the board. Copies of the presentations and audio transcripts of the conference calls have been put up on the Company’s website.
10. General Shareholder information a. Annual General Meeting: Day
Date
Time
Wednesday
24th August, 2016 10.30 a.m.
b.
Financial Year : April 1 to March 31
c.
Financial calendar
Venue
Book Closure Period
Dividend payment date
The Oberoi Grand 15 Jawaharlal Nehru Road Kolkata – 700 013
10th August, 2016 to 24th August, 2016 (both days inclusive)
On or after 26th August, 2016
Board Meetings for approval of
Tentative dates
Annual s 2015-16
24th May, 2016
Financial results for 1 Quarter 2016-17
Second week of August, 2016
Financial results for 2nd Quarter 2016-17
Last week of October, 2016
Financial results for 3 Quarter 2016-17
Last week of January, 2017 / First week of February, 2017
Annual s 2016-17
Last week of May, 2017
st
rd
115
Annual Report 2015-16
d.
•
Connect with every sip
Name and address of each Stock Exchange at which Company Shares are listed and Stock Code : Listing on Stock Exchanges
Name
Address
Stock Code
The Calcutta Stock Exchange Association Limited
7, Lyons Range, Kolkata – 700 001
27 (For Physical); 10000027 (For Demat)
BSE Limited
Phiroze Jeejeebhoy Towers, 500800 Dalal Street, Mumbai – 400 001
National Stock Exchange of India Limited
Exchange Plaza, Plot No. C/1, G Block Bandra Kurla Complex, Bandra (E) Mumbai – 400 051
Equity Shares
‘TATAGLOBAL’
Global Depository Shares Luxembourg Stock Exchange London Stock Exchange
Dematerialisation Name
Address
ISIN
National Securities Depository Limited
Trade World, 5 Floor, Kamla Mills Compound Senapati Bapat Marg, Lower Parel, Mumbai 400 013
INE 192A01025
th
Central Depository 17th floor, Phiroze Jeejeebhoy Towers, Dalal Street, Mumbai 400 023 Services Limited
INE 192A01025
Listing Fees
Annual listing fees for 2016-17 has been paid to all the Stock Exchanges where the securities of the Company are listed.
Market price data – high, low during each month in the last financial year
e.
Month
NSE High
116
(in Rs) BSE
Low
High
Low
April 2015
143.15
140.40
163.40
140.50
May 2015
146.65
143.05
150.40
136.75
June 2015
132.75
129.15
146.25
126.05
July 2015
142.80
135.35
143.00
131.45
August 2015
120.15
116.85
147.05
108.85
September 2015
129.40
126.65
129.35
114.25
October 2015
137.25
131.00
141.50
127.40
November 2015
138.10
135.90
138.30
123.15
December 2015
148.00
144.20
146.55
130.00
January 2016
127.45
123.35
149.80
119.65
February 2016
107.10
101.60
128.35
100.10
March 2016
122.30
120.30
123.90
104.50
NSE: National Stock Exchange of India Limited; BSE: BSE Limited. There was no trading of the Company’s shares on the Calcutta Stock Exchange during the year 2015/16.
Corporate Overview 01-48
Financial Statements 125-220
Statutory Reports 49-124
The market share price data is graphically represented below: TGBL v/s Sensex 30,000
180
29,000
170
SENSEX
150
27,000
140
26,000
130 120
25,000
110
24,000
100
23,000 22,000
TGBL SHARE PRICE
160
28,000
90 Apr 15
May 15
Jun 15
Jul 15
Aug 15
Sep 15
Oct 15
Nov 15
Dec 15
Jan 16
Feb 16
Mar 16
Sensex
27011
27828
27781
28115
26283
26155
26657
26146
26118
24871
23002
25342
TGBL
142.15
146.2
132.35
140.1
119.6
127.7
133.1
137.75
144.75
126.35
103.65
121.25
80
f.
Performance in comparison to broad-based indices One year performance Company’s share price - As at 1st April, 2015 - As at 31st March, 2016 - Change Indices - As at 1st April, 2015 - As at 31st March, 2016 - Change Five year performance Company’s share price - As at 1st April, 2011 - As at 31st March, 2016 - Change Indices - As at 1st April, 2011 - As at 31st March, 2016 - Change
NSE
BSE
148.80 121.25 -18.52%
149.50 121.00 -19.06%
S & P CNX NIFTY
Sensex
8483.70 7738.40 -8.79%
27954.86 25341.86 -9.35%
NSE
BSE
97.75 121.25 24.04%
98.00 121.00 23.47%
S & P CNX NIFTY
Sensex
5835.00 7738.40 32.62%
19463.11 25341.86 30.20%
117
Annual Report 2015-16
g.
•
Connect with every sip
Registrar & Transfer Agents: ed office:
Address TSR Darashaw Limited 6-10 Haji Moosa Patrawala Ind. Estate 20 Dr. E Moses Road, Mahalaxmi Mumbai – 400 011
details Telephone: 022-66568484 Fax: 022-66568494 Website: www.tsrdarashaw.com E-mail : [email protected]
TSR Darashaw Limited. 503, Barton Centre, 5th Floor 84, Mahatma Gandhi Road, Bangalore – 560 001 TSR Darashaw Limited. Tata Center, 43, J L Nehru Road, Kolkata – 700 071 TSR Darashaw Limited. Bungalow No. 1 ‘E’ Road, Northern Town, Bistupur Jamshedpur – 831 001 TSR Darashaw Limited. 2/42 Sant Vihar, Ansari Road, Daryaganj New Delhi – 110 002
Tel: 080-25320321 Fax: 080-25580019 E-mail: [email protected]
Branch Offices at : South
East
North
Tel: 033-22883087 Fax: 033-22883062 E-mail: [email protected]
Agent of the Registrar: Shah Consultancy Services Limited
Telefax : 079-26576038 3, Sumathinath Complex, Pritam Nagar, Akhada Road, Ellisbridge, E-mail:[email protected] Ahmedabad – 380 006 The Registrars can be ed between 10 a.m. and 3.30 p.m. on any working day (Monday to Friday, excluding bank holidays)
Shareholders’ Relation Cell: Person
h.
118
Address
details
Mr. V Madan, Vice-President Tata Global Beverages Limited & Company Secretary “Kirloskar Business Park”4th Floor, Block “C”, New Air Port Road, Hebbal, Bangalore – 560 024
Tel: 080-67171200 Fax: 080-67171201 Website: www.tataglobalbeverages.com E-mail:[email protected]
Ms. Deepika Srivastava Manger-Legal and Secretarial
Tata Global Beverages Limited “Kirloskar Business Park”4th Floor, Block “C”, New Air Port Road, Hebbal, Bangalore – 560 024
Tel: 080-67171200 Fax: 080-67171201 Website: www.tataglobalbeverages.com E-mail:[email protected]
Mr. Gautam Mukherjee
Tata Global Beverages Limited 1, Bishop Lefroy Road, Kolkata – 700 020
Tel: 033-22836917 Fax: 033-22833032
Share transfer system Shares in physical form for transfer, should be lodged with the office of the Company’s Registrar & Share Transfer Agent, TSR Darashaw Limited, Mumbai or at their branch offices at the addresses given above or at the ed office of the Company. The transfers are processed if technically found to be in order and complete in all respects. As per directives issued by SEBI, it is compulsory to trade in the Company’s equity shares in dematerialised form.
Corporate Overview 01-48
i.
Distribution of Shareholding Holding
Amount (Rs.)
% to Capital
No. of Holders
% to Total Holders
1 to 500
2,06,97,095
2,06,97,095
3.28
1,42,383
77.25
501 to 1000
1,33,07,848
1,33,07,848
2.11
16,251
8.82
1001 to 2000
1,58,61,782
1,58,61,782
2.51
10,365
5.62
2001 to 3000
1,18,99,948
1,18,99,948
1.89
4,694
2.55
3001 to 4000
88,96,334
88,96,334
1.41
2,509
1.36
4001 to 5000
88,22,688
88,22,688
1.40
1,893
1.03
2,42,60,834
2,42,60,834
3.84
3,395
1.84
5001 to 10000 Greater than 10000 Total
52,73,83,200
52,73,83,200
83.56
2,824
1.53
63,11,29,729
63,11,29,729
100.00
1,84,314
100.00
Categories of Shareholders as at 31st March 2016 Sl. No. Particulars
No. of s
Holdings/Shares held
% to Capital
1
Tata Group Companies
10
21,71,28,190
34.40
2
Indian Financial Institutions
26
7,71,74,450
12.23
3
State Government
1
5,850
0.00
4
Central Government
2
3,53,281
0.06
5
Nationalised Banks
24
30,32,024
0.48
6
Mutual Funds
94
4,15,14,686
6.58
7
Foreign Institutional Investors / Foreign Companies
153
8,36,08,772
13.25
8
GDS Depositories
1
2,34,19,020
3.71
9
Other Companies
10
Individuals & Others Total
Financial Statements 125-220
Distribution of Shareholding as at 31st March 2016: No. of Shares
Statutory Reports 49-124
2,391
2,63,66,504
4.18
1,81,612
15,85,26,952
25.11
1,84,314
63,11,29,729
100.00
The category-wise shareholding is also shown in the chart below: Tata Group Companies Indian Financial Institutions State Government Central Government Nationalised Banks Mutual Funds
21,71,28,190 7,71,74,450 5,850 3,53,281 30,32,024 4,15,14,686
Foreign Institutional Investors / Foreign Companies
8,36,08,772
GDS Depositories
2,34,19,020
Other Companies
2,63,66,504
Individuals & Others
15,85,26,952
119
Annual Report 2015-16
j.
•
Connect with every sip
Dematerialisation of shares and liquidity
The process of conversion of shares from physical form to electronic form is known as dematerialisation. For dematerialising the shares, the shareholders should open a demat with a Depository Participant (DP). The shareholder is required to fill in a Demat Request Form and submit the same along with the original share certificates to his DP. The DP will allocate a demat request number and shall forward the request physically and electronically through NSDL/CDSL to Registrar & Transfer Agent. On receipt of the demat request both physically and electronically and after verification, the shares are dematerialised and an electronic credit of the shares is given in the of the shareholder.
Outstanding GDRs/ADRs/Warrants or any convertible instruments, conversion date and likely impact on equity
k.
l.
As on 31st March, 2016, the outstanding Global Depository Shares were 2,34,19,020. The GDSs are convertible into fully paid equity shares on 1:1 basis. The underlying shares against the outstanding GDSs have been allotted in the name of the Depository. There is no ADR or convertible instrument outstanding as on 31st March, 2016.
Commodity price risk or foreign exchange risk and hedging activities
Tea is a multi harvest agricultural commodity and is sold through public auction or by private treaty. Price levels reflect supply/demand position and as an agricultural crop, supply/demand balance may change quickly when weather conditions are adverse. To manage supply risk the Company spreads its buying between public auction and private treaties.
Cyclical swings in coffee commodity markets are common and the most recent years have been especially volatile for the price of coffee. Increases in the cost of green coffee could reduce our gross margin and profit. Your Group has a robust framework in place to protect its interests from risks arising out of market volatility. Based on market intelligence and continuous monitoring, the sales and procurement teams take appropriate strategy to deal with such market volatility.
Volatility in currency exchange movements like RUB, CAD, USD, GBP and AUD can pose challenges to the Company’s operations through earnings dilution. The Company has established currency hedging policies and practices to manage these risks.
Plant locations
m.
1.
Bangalore Packeting centre
2 3 4
Periakanal Estate Pullivasal Estate & Packeting centre Instant Tea Operations (including Nullatani factory) Tetley (Tea Bag) Division Mineral Water Plant
5 6
n.
Survey No. 14/4, A2 & 14/5, NH 4, Bangalore Tumkur Road, Malonagathi Hally, T. Begur Post, Nelamangla Taluk, Bangalore Rural District, Karnataka – 562123 PO Munnar, Dist. Idukki, Kerala – 685612 PO Munnar, Dist. Idukki, Kerala – 685612 Post Box no. 3, Idukki district, Munnar, Kerala – 685612 73/74 KPK Menon Road; Willingdon Island, Kochi, Kerala – 682 003 Village Dhaula Kuan, District Sirmour, Himachal Pradesh – 173 025
In addition to the above locations, the Company also operates through third party contract manufacturers at several locations.
Address for correspondence Given against 10(g) above
11. Transfer of unclaimed / unpaid amounts to the Investor Education and Protection Fund (IEPF)
Pursuant to Sections 205A and 205C of the Companies Act, 1956 and other applicable provisions, if any, of the Companies Act, 2013, all unclaimed / unpaid dividend, application money, debenture interest and interest on deposits as well as the principal amount of debentures and deposits, as applicable, remaining unclaimed / unpaid for a period of 7 years from the date they became due for payment, have been transferred to the IEPF established by the Central Government. No claim shall lie against the IEPF or the Company for the amounts so transferred prior to 31st March, 2016, nor shall any payment be made in respect of such claims. Shareholders who have not yet encashed their dividend warrants pertaining to the dividend declared in the financial year 2008-09 and/or any subsequent years are requested to make their claims without any delay to the Registrars. 120
Corporate Overview 01-48
Financial Statements 125-220
Statutory Reports 49-124
The following table gives information relating to outstanding dividend s and the dates when due for transfer to IEPF: Financial year ended
Date of payment of dividend
Unpaid dividend to be claimed by
Transfer to IEP Fund in
31st March 2009
04.09.2009
September 2016
October 2016
31 March 2010
27.08.2010
August 2017
September 2017
31st March 2011
02.09.2011
September 2018
October 2018
31 March 2012
03.09.2012
September 2019
October 2019
31 March 2013
18.07.2013
July 2020
August 2020
31st March 2014
28.08.2014
August 2021
September 2021
31 March 2015
19.08.2015
August 2022
September 2022
st
st st
st
Following are the details of unpaid dividend which will be due for transfer to IEPF upto 31st March 2017: Nature of payment
Date of payment
Unpaid dividend to be claimed by
Transfer to IEP Fund in
Dividend
04.09.2009
September 2016
October 2016
While the Registrar of the Company has already written to the shareholders informing them about the due dates of transfer to IEPF for these payments, attention of the shareholders is again drawn to this matter through the Annual Report.
Top Ten Shareholders
As at 31st March 2016, the top ten shareholders of the Company were as follows:Sl. No Name of the Shareholder 1
Tata Sons Limited
No. of shares
%
14,28,54,570
22.63
2
Life Insurance Corporation of India
5,44,16,998
8.62
3
Tata Chemicals Limited
4,31,75,140
6.84
4
Tata Investment Corporation Limited
2,69,45,000
4.27
5
ICICI Prudential Mutual Fund
2,24,01,478
3.55
6
Deutsche Bank Trust Company Americas
2,34,19,020
3.71
7
Government Pension Fund Global
86,82,045
1.38
8
National Westminster Bank PLC as Depository of First State Asia Pacific Fund a sub fund of First State Investments ICVC
79,52,367
1.26
9
National Insurance Company Limited
72,64,780
1.15
10
Dimensional Emerging Markets Value Fund
66,32,236
1.05
121
Annual Report 2015-16
•
Connect with every sip
The Company is compliant with all the mandatory requirements of the Securities and Exchange Board of India (Listing Obligations and Disclosure Requirements) Regulations, 2015 and erstwhile Clause 49 of the Listing Agreement for 2015-16.
The following non-mandatory requirements under Part E of Schedule II of the Securities and Exchange Board of India (Listing Obligations and Disclosure Requirements) Regulations, 2015 to the extent they have been adopted are mentioned below:
Details of non-compliance by the Company, penalties, strictures imposed on the Company by Stock Exchanges or SEBI or any statutory authority, on any matter related to capital markets during the last three years:
•
The Statutory financial statements of the Company are unqualified.
•
The Company has separate posts of Chairman and CEO.
There was no such instance in the last three years.
•
Whistle-blower policy and affirmation that no personnel has been denied access to the Audit Committee:
The Internal Auditors of the Company make presentations to the Audit Committee on their reports.
e
Web link where policy for determining ‘material’ subsidiaries is disclosed:
12. Other disclosures
a
b
c
Disclosures on materially significant related party transactions that may have potential conflict with the interest of company at large: Details of transactions with the related parties as specified in ing Standard 18 have been reported in the Financial Statements. There was no transaction of a material nature with any of the related parties which was in conflict with the interest of the Company.
The Board has approved a whistle-blower policy/ vigil mechanism which have been communicated to the employees. The policy provides a mechanism for employees to report their concerns about unethical behaviour, actual or suspected fraud or violation of Company’s code of conduct and provides safeguards against victimisation of employees who avail the mechanism. The policy permits reporting any concern relating to financial/ing matters and employees at the levels of Vice-Presidents and above as also the Ethics counsellors directly to the Chairman of the Audit Committee. For all other matters the concern can be reported to the Ethics counsellor of the Company. The policy with the name and address of Chairman of the Audit Committee has been circulated to the employees. No employee has been denied access to the Chairman of the Audit Committee.
The whistle Blower policy can be accessed at http:// www.tataglobalbeverages.com/docs/defaultsource/Investor-Governance-Policy-/whistle-blowerpolicy-and-vigil-mechanism-.pdf?sfvrsn=0
Details of compliance with mandatory requirements and adoption of the non-mandatory requirements:
d
122
http://www.tataglobalbeverages.com/docs/defaultsource/Investor-Governance-Policy-/policy-onsubsidiary.pdf?sfvrsn=0
f
Web link where policy on dealing with related party transactions is disclosed:
http://www.tataglobalbeverages.com/docs/ default-source/default-document-library/policy-onrelated-party8b14b6881a2368caa65dff02001c5be1. pdf?sfvrsn=0
g
Disclosure of commodity price risks and commodity hedging activities: Given in 10 (l)
h
Compliance with ing Standard:
In the preparation of the financial statements, the Company has followed the ing Standards specified under section 133 of the Companies Act, 2013 read with Rule 7 of the Companies (s) Rules, 2014 and ing Standard 30 on Financial Instrument to the extent it does not contradict with any other ing Standard. The significant ing policies which are consistently applied have been set out in the notes to the financial statements.
Corporate Overview 01-48
i
Non-compliance of any requirement of corporate governance report of sub-paras (2) to (10) of Schedule V (c) of the Securities and Exchange Board of India (Listing Obligations and Disclosure Requirements) Regulations, 2015: NIL.
j
Extent to which the discretionary requirements specified in Part E of Schedule II of Securities and Exchange Board of India (Listing Obligations and Disclosure Requirements) Regulations, 2015 have been adopted: Covered in 12 (d).
k
Disclosure with respect to demat suspense / unclaimed suspense : Not Applicable.
l
Name of the Debenture Trustees (in respect of 3,250 Secured Redeemable Non-Convertible Debentures of Rs. 10,000 each) with their details:
Company website link http://www.tataglobalbeverages. com/docs/default-source/default-document-library/policyon-related-party8b14b6881a2368caa65dff02001c5be1. pdf?sfvrsn=0
14) Subsidiary Companies
(Pursuant to Regulation 53 of the Securities and Exchange Board of India (Listing Obligations and Disclosure Requirements) Regulations, 2015)
m
SBICAP Trustee Company Limited Apeejay House, 6th Floor 3, Dinshaw Wachha Road Churchgate, Mumbai 400 020 Tel: 022 4302 5555; Fax: 022- 2204 0465.
The Company has duly complied with the requirements specified in Regulation 17 to 27 and clauses (b) to (i) of sub-regulation (2) of Regulation 46 of the Securities and Exchange Board of India (Listing Obligations and Disclosure Requirements) Regulations, 2015.
All transactions entered in to with related parties as defined under the Companies Act, 2013, Regulation 23 of the Securities and Exchange Board of India (Listing Obligations and Disclosure Requirements) Regulations, 2015 and erstwhile Clause 49 of the Listing Agreement during the financial year 2015-16 were in the ordinary course of business and on arm’s length pricing basis and do not attract provisions of Section 188 of the Companies Act, 2013. There were no materially significant transactions with the related parties during the financial year which were in conflict with the interest of Company. Suitable disclosures as required by ing standard (AS 18) have been made in the notes to the Financial Statements. The Board has approved a policy for related party transactions which can be accessed at the
The Company does not have any material non-listed Indian subsidiary whose income or net worth exceeds 20% of the consolidated income or net worth respectively of the Company in the immediately preceding ing year. However, in line with the requirements of the Securities and Exchange Board of India (Listing Obligations and Disclosure Requirements) Regulations, 2015, a policy to determine a material subsidiary has been framed and the same may be accessed on the Company’s website at the link http://www. tataglobalbeverages.com/docs/default-source/InvestorGovernance-Policy-/policy-on-subsidiary.pdf?sfvrsn=0 . The minutes of the Board meetings of unlisted subsidiary companies are placed in the Board meetings of the Company.
15) Insider Trading Regulations
13) Related Party Transactions
Financial Statements 125-220
Statutory Reports 49-124
After the Securities and Exchange Board of India had amended the Insider Trading Regulations in January 2015, which came into effect from 14th May, 2015, the Company has suitably revised the Tata Code of Conduct for Prevention of Insider Trading and Code of Corporate Disclosure practices which your Company has adopted. This code of conduct is applicable to all Directors, such identified employees of the Company who are expected to have access to unpublished price sensitive information relating to the Company and other connected persons. Mr. John Jacob, Chief Financial Officer of the Company, is the compliance officer for the purpose of these regulations.
16) Certificate on Corporate Governance
A Compliance certificate from Dr. Asim Kumar Chattopadhyay, Practicing Company Secretary pursuant to Schedule V of Securities and Exchange Board of India (Listing Obligations and Disclosure Requirements) Regulations, 2015 regarding compliance of conditions of corporate governance is attached. On behalf of the Board of Directors
Mumbai 24th May 2016
Cyrus P Mistry Chairman
123
Annual Report 2015-16
•
Connect with every sip
Declaration by the CEO on Code of Conduct as required by Schedule V of Securities and Exchange Board of India (Listing Obligations and Disclosure Requirements) Regulations, 2015 I, Ajoy Misra, Chief Executive Officer and Managing Director of the Company hereby declare that all the of Board of Directors and Senior Management Personnel have affirmed compliance with Code of Conduct, as applicable to them, in respect of the financial year 2015-16. For Tata Global Beverages Limited
Mumbai 24th May 2016
(Ajoy Misra) Chief Executive Officer and Managing Director
PRACTISING COMPANY SECRETARY’S CERTIFICATE ON CORPORATE GOVERNANCE UNDER SCHEDULE V(E) OF REGULATION 34(3) AND 53(f) OF THE SECURITIES AND EXCHANGE BOARD OF INDIA (LISTING OBLIGATIONS AND DISCLOSURE REQUIREMENTS) REGULATIONS, 2015 To the of Tata Global Beverages Limited I have examined the compliance of the conditions of Corporate Governance by Tata Global Beverages Limited (‘the Company’) for the year ended on 31st March 2016, as stipulated in Schedule V(E) of Regulation 34(3) and 53(f ) of the Securities and Exchange Board of India (Listing Obligations and Disclosure Requirements) Regulations, 2015. The compliance of the conditions of Corporate Governance is the responsibility of the management. My examination was limited to a review of procedures and implementation thereof, adopted by the Company for ensuring the compliance of the conditions of Corporate Governance. It is neither an audit nor an expression of opinion on the financial statements of the Company. In my opinion and to the best of my information and according to the explanations given to me, and the representations made by the Directors and the management, I certify that the Company has complied with the conditions of Corporate Governance as stipulated in the above mentioned Listing Agreement. I state that such compliance is neither an assurance as to the future viability of the Company nor of the efficiency or effectiveness with which the management has conducted the affairs of the Company. Dr. Asim Kumar Chattopadhyay Practising Company Secretary FCS No. 2303 No. 880 24th May 2016
124
Corporate Overview 01-48
Statutory Reports 49-124
Financial Statements 125-220
Independent Auditors’ Report TO THE OF TATA GLOBAL BEVERAGES LIMITED
Report on the Standalone Financial Statements 1.
We conducted our audit in accordance with the Standards on Auditing specified under Section 143(10) of the Act and other applicable authoritative pronouncements issued by the Institute of Chartered ants of India. Those Standards and pronouncements require that we comply with ethical requirements and plan and perform the audit to obtain reasonable assurance about whether the financial statements are free from material misstatement.
6.
An audit involves performing procedures to obtain audit evidence about the amounts and the disclosures in the financial statements. The procedures selected depend on the auditors’ judgment, including the assessment of the risks of material misstatement of the financial statements, whether due to fraud or error. In making those risk assessments, the auditor considers internal financial control relevant to the Company’s preparation of the financial statements that give a true and fair view, in order to design audit procedures that are appropriate in the circumstances. An audit also includes evaluating the appropriateness of the ing policies used and the reasonableness of the ing estimates made by the Company’s Directors, as well as evaluating the overall presentation of the financial statements.
7.
We believe that the audit evidence we have obtained is sufficient and appropriate to provide a basis for our audit opinion on the standalone financial statements.
We have audited the accompanying standalone financial statements of Tata Global Beverages Limited (“the Company”), which comprise the Balance Sheet as at March 31, 2016, the Statement of Profit and Loss, the Cash Flow Statement for the year then ended, and a summary of the significant ing policies and other explanatory information.
Management’s Responsibility for the Standalone Financial Statements 2.
5.
The Company’s Board of Directors is responsible for the matters stated in Section 134(5) of the Companies Act, 2013 (“the Act”) with respect to the preparation of these standalone financial statements to give a true and fair view of the financial position, financial performance and cash flows of the Company in accordance with the ing principles generally accepted in India, including the ing Standards specified under Section 133 of the Act, read with Rule 7 of the Companies (s) Rules, 2014 and ing Standard 30, Financial Instruments: Recognition and Measurement issued by the Institute of Chartered ants of India to the extent it does not contradict any other ing standard referred to in Section 133 of the Act read with Rule 7 of Companies (s) Rules, 2014. This responsibility also includes maintenance of adequate ing records in accordance with the provisions of the Act for safeguarding of the assets of the Company and for preventing and detecting frauds and other irregularities; selection and application of appropriate ing policies; making judgments and estimates that are reasonable and prudent; and design, implementation and maintenance of adequate internal financial controls, that were operating effectively for ensuring the accuracy and completeness of the ing records, relevant to the preparation and presentation of the financial statements that give a true and fair view and are free from material misstatement, whether due to fraud or error.
Auditors’ Responsibility 3.
Our responsibility is to express an opinion on these standalone financial statements based on our audit.
4.
We have taken into the provisions of the Act and the Rules made thereunder including the ing standards and matters which are required to be included in the audit report.
Opinion 8.
In our opinion and to the best of our information and according to the explanations given to us, the aforesaid standalone financial statements give the information required by the Act in the manner so required and give a true and fair view in conformity with the ing principles generally accepted in India, of the state of affairs of the Company as at March 31, 2016, and its profit and its cash flows for the year ended on that date.
Report on Other Legal and Regulatory Requirements 9.
As required by ‘the Companies (Auditor’s Report) Order, 2016’, issued by the Central Government of India in of sub-section (11) of section 143 of the Act (hereinafter referred to as the “Order”), and on the basis of such checks of the books and records of the Company as we considered appropriate and according to the information and explanations given to us, we give in the Annexure B a statement on the matters specified in paragraphs 3 and 4 of the Order.
125
Annual Report 2015-16
10.
As required by Section 143 (3) of the Act, we report that:
(a)
We have sought and obtained all the information and explanations which to the best of our knowledge and belief were necessary for the purposes of our audit.
(b)
In our opinion, proper books of as required by law have been kept by the Company so far as it appears from our examination of those books.
(c)
The Balance Sheet, the Statement of Profit and Loss, and the Cash Flow Statement dealt with by this Report are in agreement with the books of .
(d)
In our opinion, the aforesaid standalone financial statements comply with the ing Standards specified under Section 133 of the Act, read with Rule 7 of the Companies (s) Rules, 2014 and ing Standard 30, Financial Instruments: Recognition and Measurement issued by the Institute of Chartered ants of India to the extent it does not contradict any other ing standard referred to in Section 133 of the Act read with Rule 7 of Companies (s) Rules, 2014.
(e)
(f )
126
Connect with every sip
Company and the operating effectiveness of such controls, refer to our separate Report in Annexure A.
(g)
With respect to the other matters to be included in the Auditors’ Report in accordance with Rule 11 of the Companies (Audit and Auditors) Rules, 2014, in our opinion and to the best of our knowledge and belief and according to the information and explanations given to us:
i.
The Company has disclosed the impact, if any, of pending litigations as at March 31, 2016 on its financial position in its standalone financial statements – Refer Note [31];
ii.
The Company has made provision as at March 31, 2016, as required under the applicable law or ing standards, for material foreseeable losses, if any, on long-term contracts including derivative contracts;
iii.
There has been no delay in transferring amounts, required to be transferred, to the Investor Education and Protection Fund by the Company during the year ended March 31, 2016.
On the basis of the written representations received from the directors as on March 31, 2016 taken on record by the Board of Directors, none of the directors is disqualified as on March 31, 2016 from being appointed as a director in of Section 164 (2) of the Act. With respect to the adequacy of the internal financial controls over financial reporting of the
•
For Lovelock & Lewes Firm Registration Number: 301056E Chartered ants
Place: Mumbai Date : May 24, 2016
Dibyendu Majumder Partner hip Number: 057687
Corporate Overview 01-48
Statutory Reports 49-124
Financial Statements 125-220
Annexure A to Independent Auditors’ Report Referred to in paragraph [10 (f )] of the Independent Auditors’ Report of even date to the of Tata Global Beverages Limited on the standalone financial statements for the year ended March 31, 2016
4.
Our audit involves performing procedures to obtain audit evidence about the adequacy of the internal financial controls system over financial reporting and their operating effectiveness. Our audit of internal financial controls over financial reporting included obtaining an understanding of internal financial controls over financial reporting, assessing the risk that a material weakness exists, and testing and evaluating the design and operating effectiveness of internal control based on the assessed risk. The procedures selected depend on the auditor’s judgement, including the assessment of the risks of material misstatement of the financial statements, whether due to fraud or error.
5.
We believe that the audit evidence we have obtained is sufficient and appropriate to provide a basis for our audit opinion on the Company’s internal financial controls system over financial reporting.
Report on the Internal Financial Controls under Clause (i) of Sub-section 3 of Section 143 of the Act 1.
We have audited the internal financial controls over financial reporting of Tata Global Beverages Limited (“the Company”) as of March 31, 2016 in conjunction with our audit of the standalone financial statements of the Company for the year ended on that date.
Management’s Responsibility for Internal Financial Controls 2.
The Company’s management is responsible for establishing and maintaining internal financial controls based on the internal control over financial reporting criteria established by the Company considering the essential components of internal control stated in the Guidance Note on Audit of Internal Financial Controls Over Financial Reporting issued by the Institute of Chartered ants of India (ICAI). These responsibilities include the design, implementation and maintenance of adequate internal financial controls that were operating effectively for ensuring the orderly and efficient conduct of its business, including adherence to company’s policies, the safeguarding of its assets, the prevention and detection of frauds and errors, the accuracy and completeness of the ing records, and the timely preparation of reliable financial information, as required under the Act.
Meaning of Internal Financial Controls Over Financial Reporting 6.
Auditors’ Responsibility 3.
Our responsibility is to express an opinion on the Company’s internal financial controls over financial reporting based on our audit. We conducted our audit in accordance with the Guidance Note on Audit of Internal Financial Controls Over Financial Reporting (the “Guidance Note”) and the Standards on Auditing deemed to be prescribed under section 143(10) of the Act to the extent applicable to an audit of internal financial controls, both applicable to an audit of internal financial controls and both issued by the ICAI. Those Standards and the Guidance Note require that we comply with ethical requirements and plan and perform the audit to obtain reasonable assurance about whether adequate internal financial controls over financial reporting was established and maintained and if such controls operated effectively in all material respects.
A company’s internal financial control over financial reporting is a process designed to provide reasonable assurance regarding the reliability of financial reporting and the preparation of financial statements for external purposes in accordance with generally accepted ing principles. A company’s internal financial control over financial reporting includes those policies and procedures that (1) pertain to the maintenance of records that, in reasonable detail, accurately and fairly reflect the transactions and dispositions of the assets of the company; (2) provide reasonable assurance that transactions are recorded as necessary to permit preparation of financial statements in accordance with generally accepted ing principles, and that receipts and expenditures of the company are being made only in accordance with authorisations of management and directors of the company; and (3) provide reasonable assurance regarding prevention or timely detection of unauthorised acquisition, use, or disposition of the company’s assets that could have a material effect on the financial statements.
Inherent Limitations of Internal Financial Controls Over Financial Reporting 7.
Because of the inherent limitations of internal financial controls over financial reporting, including the possibility of collusion or improper management override of controls, material misstatements due to error or fraud may occur and not be detected. Also, projections of any evaluation of the internal financial controls over financial reporting
127
Annual Report 2015-16
to future periods are subject to the risk that the internal financial control over financial reporting may become inadequate because of changes in conditions, or that the degree of compliance with the policies or procedures may deteriorate.
In our opinion, the Company has, in all material respects, an adequate internal financial controls system over financial reporting and such internal financial controls over financial reporting were operating effectively as at March 31, 2016, based on the internal control over financial reporting criteria established by the Company considering
128
Connect with every sip
the essential components of internal control stated in the Guidance Note on Audit of Internal Financial Controls Over Financial Reporting issued by the Institute of Chartered ants of India. For Lovelock & Lewes Firm Registration Number: 301056E Chartered ants
Opinion 8.
•
Place: Mumbai Date : May 24, 2016
Dibyendu Majumder Partner hip Number: 057687
Corporate Overview 01-48
Statutory Reports 49-124
Financial Statements 125-220
Annexure B to Independent Auditors’ Report Referred to in paragraph [9] of the Independent Auditors’ Report of even date to the of Tata Global Beverages Limited on the standalone financial statements as of and for the year ended March 31, 2016 i.
(a)
(b)
(c)
The Company is maintaining proper records showing full particulars, including quantitative details and situation, of fixed assets. The fixed assets are physically verified by the Management according to a phased programme designed to cover all the items over a period of 3 years which, in our opinion, is reasonable having regard to the size of the Company and the nature of its assets. Pursuant to the programme, a portion of the fixed assets has been physically verified by the Management during the year and no material discrepancies have been noticed on such verification. The title deeds of immovable properties, as disclosed in Note 12 on fixed assets to the financial statements, are held in the name of the Company.
ii.
The physical verification of inventory excluding stocks with third parties have been conducted at reasonable intervals by the Management during the year. In respect of inventory lying with third parties, these have substantially been confirmed by them. The discrepancies noticed on physical verification of inventory as compared to book records were not material.
iii.
The Company has not granted any loans, secured or unsecured, to companies, firms, Limited Liability Partnerships or other parties covered in the maintained under Section 189 of the Act. Therefore, the provisions of Clause 3(iii), (iii)(a), (iii)(b) and (iii)(c) of the said Order are not applicable to the Company.
iv.
In our opinion, and according to the information and explanations given to us, the Company has complied with the provisions of Section 185 and 186 of the Companies Act, 2013 in respect of the loans and investments made, and guarantees and security provided by it.
v.
The Company has not accepted any deposits from the public within the meaning of Sections 73, 74, 75 and 76 of the Act and the Rules framed there under to the extent notified.
vi.
Pursuant to the rules made by the Central Government of India, the Company is required to maintain cost records as specified under Section 148(1) of the Act in respect of its products. We have broadly reviewed the same, and are of the opinion that, prima facie, the prescribed s and records have been made and maintained. We have not, however, made a detailed examination of the records with a view to determine whether they are accurate or complete.
vii.
(a)
According to the information and explanations given to us and the records of the Company examined by us, in our opinion, the Company is generally regular in depositing undisputed statutory dues in respect of provident fund and service tax and is regular in depositing undisputed statutory dues, including employees’ state insurance, sales tax, income tax, duty of customs, duty of excise, value added tax, cess and other material statutory dues, as applicable, with the appropriate authorities.
(b)
According to the information and explanations given to us and the records of the Company examined by us, there are no dues of duty of customs, duty of excise which have not been deposited on of any dispute. The particulars of dues of income tax, sales tax, service tax, value added tax and cess as at March 31, 2016 which have not been deposited on of a dispute, are as follows:
129
Annual Report 2015-16
•
Connect with every sip
Name of the statute
Nature of dues
Amount Period to which Forum where the dispute is pending (In Crores) the amount relates
Income Tax Act, 1961
Income Tax
2.18 2004-05, 2007 - 08 and 2008-09
Commissioner of Income Tax (Appeals), Kochi
Income Tax Act, 1961
Income Tax
0.01 2009-10
Income Tax Appellate Tribunal, New Delhi
Kerala General Sales Tax Act, 1963
Sales Tax
0.12 1998-99
Sales Tax Appellate Tribunal, Ernakulam
Kerala General Sales Tax Act, 1963
Sales Tax
0.44 (*) 1996-97 to 2000-01, 2002-03
Deputy Commissioner (Appeals), Commercial Taxes, Ernakulam
Kerala Value Added Tax, 2003
Value Added Tax
0.31 (*) 2010-11
Deputy Commissioner (Appeals), Commercial Taxes, Ernakulam
West Bengal Sales Tax Act, 1994
Sales Tax
Central Sales Tax Act, 1956
Sales Tax
Central Sales Tax Act, 1956
Sales Tax
Central Sales Tax Act, 1956
Sales Tax
0.01 2010-11
t Commissioner of Sales Tax, Maharashtra
Karnataka Sales Tax Act,1957
Sales Tax
1.28 1997-98
The Supreme Court of India
Tamil Nadu General Sales Tax Act, 1959
Sales Tax
0.57 (*) 1998-99 to 2006-07
The High Court of Madras
Central Sales Tax Act, 1956
Sales Tax
2.08 (*) 2010-11 to 2013-14
Deputy Commissioner Indore, Madhya Pradesh
Central Sales Tax Act, 1956
Sales Tax
0.94 2012-13
Central Sales Tax Act, 1956
Sales Tax
1.69 (*) 2012-13
West Bengal Value Added Tax Act, 2003
Value Added Tax
1.36 2007-08 & 2008-09
The West Bengal Commercial Taxes Appellate and Revisional Board, Kolkata
Maharashtra Value Added Tax Act, 2002
Value Added Tax
0.02 2008-09
t Commissioner of Sales Tax, Maharashtra
Karnataka Value Added Tax Act, 2003
Value Added Tax
Goa Value Added Tax Act, 2005
Value Added Tax
Central Sales Tax Act, 1956
Sales Tax
0.02 1998-99 & 2000-01
The West Bengal Commercial Taxes Appellate and Revisional Board, Kolkata
0.12 1998-99
Sales Tax Appellate Tribunal, Ernakulam
0.50 (*) 1999-00, 2000-01, 2002-03, 2006-07 and 2011-12
0.06 (*) 2006-07, 2009-10 and 2012-13 0.01 2006-07 0.05 (*) 2012-13
Deputy Commissioner (Appeals), Commercial Taxes, Ernakulam
Assistant Commissioner, Andhra Pradesh Senior t Commissioner of Commercial tax, Kolkata, West Bengal
The t Commissioner (Appeals), Commercial Taxes, Karnataka Commissioner of commercial taxes, Goa. Deputy Commissioner Appeals, Coimbatore
Tamil Nadu Value Added Tax Act 2006 Value Added Tax
- (*) 2014-15
Additional Commissioner, Coimbatore
Andhra Pradesh Value Added Tax Act, Value Added 2005 Tax
- (*) 2005-06
Sales Tax Appellate Tribunal, Hyderabad
2.06 2010-11
The High Court of Madhya Pradesh
Madhya Pradesh Entry Tax Act, 1976
Entry Tax
Madhya Pradesh Entry Tax Act, 1976
Entry Tax
130
0.82 (*) 2003-04, 2005- 06 to 2011-12
The Supreme Court of India
Corporate Overview 01-48
Statutory Reports 49-124
Name of the statute
Nature of dues
Tamil Nadu Panchayat Act,1994
Cess on Land Revenue
Finance Act, 1994
Service Tax
1.46 (*) 2005-06
Financial Statements 125-220
Amount Period to which Forum where the dispute is pending (In Crores) the amount relates 0.05 2000-2001 to 2002-2003
The High Court of Madras Custom Excise & Service Tax Appellate Tribunal, Kolkata
Finance Act, 1994
Service Tax
0.19 (*) 2013-14 and 2014-15 Commissioner Appeals, Bangalore
Finance Act, 1994
Service Tax
0.01 2008-09 and 2009-10 Commissioner Appeals, Kolkata
Finance Act, 1994
Service Tax
- (*) April 2015 to June 2015
Assistant Commissioner- Central Excise and Customs- Kochi
(*) Net of amounts paid of Rs. 8.23 Crores.
viii.
According to the records of the Company examined by us and the information and explanation given to us, the Company has not defaulted in repayment of loans or borrowings to any financial institution or bank or Government or dues to debenture holders as at the balance sheet date.
ix.
The Company has not raised any moneys by way of initial public offer, further public offer (including debt instruments) and term loans. Accordingly, the provisions of Clause 3(ix) of the Order are not applicable to the Company.
x.
xi.
xii.
During the course of our examination of the books and records of the Company, carried out in accordance with the generally accepted auditing practices in India, and according to the information and explanations given to us, we have neither come across any instance of material fraud by the Company or on the Company by its officers or employees, noticed or reported during the year, nor have we been informed of any such case by the Management. The Company has paid/ provided for managerial remuneration in accordance with the requisite approvals mandated by the provisions of Section 197 read with Schedule V to the Act.
xiii.
The Company has entered into transactions with related parties in compliance with the provisions of Sections 177 and 188 of the Act. The details of such related party transactions have been disclosed in the financial statements as required under ing Standard (AS) 18, Related Party Disclosures specified under Section 133 of the Act, read with Rule 7 of the Companies (s) Rules, 2014.
xiv.
Company has not made any preferential allotment or private placement of shares or fully or partly convertible debentures during the year under review. Accordingly, the provisions of Clause 3(xiv) of the Order are not applicable to the Company.
xv.
The Company has not entered into any non-cash transactions with its directors or persons connected with him. Accordingly, the provisions of Clause 3(xv) of the Order are not applicable to the Company.
xvi.
The Company is not required to be ed under Section 45-IA of the Reserve Bank of India Act, 1934. Accordingly, the provisions of Clause 3(xvi) of the Order are not applicable to the Company. For Lovelock & Lewes Firm Registration Number: 301056E Chartered ants
As the Company is not a Nidhi Company and the Nidhi Rules, 2014 are not applicable to it, the provisions of Clause 3(xii) of the Order are not applicable to the Company. Place: Mumbai Date : May 24, 2016
Dibyendu Majumder Partner hip Number: 057687
131
Annual Report 2015-16
•
Connect with every sip
Balance Sheet As at March 31, 2016
Note Equity and Liabilities Shareholders' Funds Share Capital Reserves and Surplus Share Suspense Non-Current Liabilities Long-Term Borrowings Other Long-Term Liabilities Long-Term Provisions Current Liabilities Short-Term Borrowings Trade Payables (includes dues of Micro and Small enterprises Rs. 3.99 Crores (Rs. 1.42 Crores)) Other Current Liabilities Short-Term Provisions Total Assets Non-Current Assets Fixed Assets Tangible Assets Intangible Assets Capital work-in-progress Intangible Assets under development Non-Current Investments Deferred Tax Assets (net) Long-Term Loans and Advances Other Non-Current Assets Current Assets Inventories Trade Receivables Cash and Bank Balances Short-Term Loans and Advances Other Current Assets Total Summary of Significant ing Policies The Notes are an integral part of the Financial Statements.
3 4
63.11 2832.79
5 6 7
177.87
8 9
52.61 198.38
10 11
544.95 195.21
2895.90 -
177.87
991.15 4064.92
13 14 15 16
183.21 16.05 10.10 209.36 2264.34 39.48 120.50 70.50
17 18 19 20 21
889.71 124.09 239.20 104.47 3.27
2
-
2704.18
1360.74 4064.92
For Lovelock & Lewes Firm Registration No. 301056E Chartered ants
Cyrus P Mistry Chairman L Krishnakumar Executive Director V Leeladhar Director John Jacob Chief Financial Officer
132
325.00 72.54 114.02
2500.38 1.27
511.56
153.48 192.61
642.47 3655.68
12
For and on behalf of the Board
Mumbai May 24, 2016
61.84 2438.54
152.50 143.88
This is the Balance Sheet referred to in our Report of even date.
Dibyendu Majumder Partner hip No. 057687
Rs. in Crores 2015
2016
168.91 24.43 11.09 0.18 204.61 2231.86 45.75 71.79 70.50 819.27 93.62 21.01 93.36 3.91
2624.51
1031.17 3655.68
Ajoy Misra Managing Director Harish Bhat Director Darius Pandole Director V Madan Company Secretary
Corporate Overview 01-48
Financial Statements 125-220
Statutory Reports 49-124
Statement of Profit and Loss For the year ended March 31, 2016
Rs. in Crores Note
2016
2015
Income Revenue from Operations (Gross)
22
Less: Excise duty Revenue from Operations (Net) Other Income
23
3090.74
2884.76
(6.82)
(0.24)
3083.92
2884.52
106.57
155.16
Total Revenue
3190.49
3039.68
Expenses 24
1888.96 11.93
1.53
25
(3.95)
(27.99)
Employee Benefits Expense
26
186.88
161.92
Finance Costs
27
29.61
34.19
22.79
19.94
28
657.87
559.25
Cost of Materials Consumed Purchases of Stock in Trade Change in Inventories of Finished Goods/Stock-in-trade/Work-inprogress
Depreciaton and Amortization Expense Other Expenses Total Expenses
2794.09
Profit before Exceptional Items and Taxes Exceptional Items (Net)
1872.87
29
Profit before Tax
2621.71
396.40
417.97
264.57
(68.92)
660.97
349.05
Tax Expenses Current Tax (Refer Note 37)
130.03
55.91
Less: MAT Credit Entitlement
(39.00)
-
91.03
55.91
6.27
4.14
Net Current Tax Deferred Tax Profit for the year
97.30
60.05
563.67
289.00
8.93
4.58
Earning per Equity Share (Nominal Value per share Re. 1 each) Basic and Diluted (Refer Note 39) The Notes are an integral part of the Financial Statements. This is the Statement of Profit and Loss referred to in our Report of even date.
For and on behalf of the Board
For Lovelock & Lewes Firm Registration No. 301056E Chartered ants
Cyrus P Mistry Chairman L Krishnakumar Executive Director V Leeladhar Director John Jacob Chief Financial Officer
Dibyendu Majumder Partner hip No. 057687
Ajoy Misra Managing Director Harish Bhat Director Darius Pandole Director V Madan Company Secretary
Mumbai May 24, 2016
133
Annual Report 2015-16
•
Connect with every sip
Cash Flow Statement For the year ended March 31, 2016 Rs. in Crores A.
2016
2015
660.97
349.05
Cash Flow from Operating Activities Net Profit before Tax Adjusted for : Depreciation and Amortisation Dividend Income
22.79
19.94
(97.98)
(137.07)
Unrealised Exchange Loss / (Gain)
(0.23)
0.48
Finance Cost
29.61
34.19
Interest Income
(7.14)
(17.50)
Profit on sale of Current Investments (net)
(0.14)
(0.11)
Liabilities no longer required written back
(18.09)
(24.74)
1.78
-
(Profit)/Loss on sale / discard of Fixed Assets (net)
(0.94)
0.14
Exceptional item
10.97
6.99
-
38.24
52.25
23.69
Provision for Doubtful Debts/Advances
Provision on Investment Provision for obligations relating to a Overseas Subsidiary Company Profit on Sale of Long-Term Trade Investments
(327.79)
Operating Profit before working capital changes
(334.91)
(55.75)
326.06
293.30
Adjustments for : Trade Receivables
(32.12)
Other Receivables
(27.14)
(0.11)
Inventories
(70.44)
(181.58)
Trade Payables
24.33
76.64
21.03 (53.06) 273.00
Cash generated from Operations Direct Taxes paid (net)
(141.52)
Net Cash from / (used in) Operating Activities B.
(136.33) 156.97 (106.75)
(141.52)
(106.75)
131.48
50.22
Cash Flow from Investing Activities Purchase of Fixed Assets Sale of Fixed Assets
(37.07)
(47.23)
3.47
0.83
(0.31)
(2.09)
Sale/Redemption of Long-Term Investments
336.64
-
Investment in t Ventures
(41.00)
(75.00)
0.14
0.11
97.98
137.07
7.63
20.97
12.75
91.50
Purchase of Long-Term Investments
Placement / Redemption of Current Investments (net) Dividend Income Interest Income received Inter Corporate Deposits & Loans Redeemed Net Cash from / (used in) Investing Activities
134
380.23
126.16
Corporate Overview 01-48
Financial Statements 125-220
Statutory Reports 49-124
Rs. in Crores 2016 C.
2015
Cash Flow from Financing Activities (99.89)
20.98
(142.00)
(139.14)
Dividend Tax paid
(22.36)
(13.70)
Finance Cost
(29.52)
(34.22)
Working Capital Facilities (net) Dividend paid
Net Cash from / (used in) Financing Activities Net increase / (decrease) in Cash and Cash Equivalents D.
(293.77)
(166.08)
217.94
10.30
14.96
2.29
-
2.37
232.90
14.96
Cash and Cash Equivalents Opening Balance Cash & Bank balance acquired on amalgamation Balances at the end of the year Cash and Cash Equivalent comprises of: 0.02
0.02
Balances in Current and Mutual Funds
232.88
14.94
Balances at the end of the year
232.90
14.96
Cash and Cheques in hand
Notes: 1.
The above Cash Flow Statement has been prepared under the ‘ Indirect Method’ as set out in the ing Standard on ‘ Cash Flow Statements (AS-3) ‘ issued by Companies (ing Standards) Rules, 2006.
2.
Previous year’s figures have been rearranged/regrouped wherever necessary.
This is the Cash Flow Statement referred to in our Report of even date.
For and on behalf of the Board
For Lovelock & Lewes Firm Registration No. 301056E Chartered ants
Cyrus P Mistry Chairman L Krishnakumar Executive Director V Leeladhar Director John Jacob Chief Financial Officer
Dibyendu Majumder Partner hip No. 057687
Ajoy Misra Managing Director Harish Bhat Director Darius Pandole Director V Madan Company Secretary
Mumbai May 24, 2016
135
Annual Report 2015-16
•
Connect with every sip
Notes forming part of the Financial Statements 1.
General Information:
Tata Global Beverages Limited (“the holding company”) and its subsidiaries, t ventures and associates (together, “the Group”) is a global beverages company engaged in the trading, production and distribution of Tea, Coffee and Water. The group has branded beverage business operations mainly in India, Europe, US, Canada and Australia, plantation business in India/Sri Lanka and extraction business mainly in lndia, US and China.
2.
Subsidies receivable from government in respect of fixed assets are deducted from the cost of respective assets as and when they accrue.
Depreciation is provided on tangible asset including asset created on lands under lease on a monthly straight line basis over the estimated useful life of the asset or as prescribed in Schedule II to the Companies Act, 2013.
Renewal of land leases is assumed, consistent with past practice.
Management’s estimates of the useful lives of certain assets are as follows:
Significant ing Policies: (a) ing Convention
(b)
The financial statements have been prepared in accordance with the historical cost convention on an accrual basis and comply with the applicable ing Standards specified under section 133 of the Companies Act, 2013 read with Rule 7 of the Companies (s) Rules, 2014 and ing Standard 30 on Financial Instrument to the extent it does not contradict with any other ing Standard. These Financial Statements have been prepared as required under relevant provision of the Companies Act, 2013 and the presentation is based on the Schedule III of the Companies Act, 2013. All assets and liabilities are classified into current and noncurrent generally based on the criteria of realisation/ settlement within twelve months period from the balance sheet date.
Fixed Assets and Depreciation
i) Tangible: Tangible Assets are carried at cost of acquisition less accumulated depreciation and accumulated impairment loss, if any. Subsequent expenditure related to an item of fixed asset are added to its book value only if they increase the future benefits from the existing asset beyond its previously assessed standard of performance. The cost of extension planting of cultivable land including cost of development is capitalised.
136
Assets acquired on hire purchase, for which ownership will vest at a future date, are capitalised at cash cost.
Computers, Printers and Other Office Equipments
4 years
Air Conditioners
10 years
Plant and Machinery
20 - 25 years
Leasehold improvements
Over the life of lease
For the above class of assets, based on internal assessment and independent technical evaluation, management believes that the useful lives as given above best represents the period over which the asset would be used.
ii) Intangible: Intangible Assets are stated at acquisition cost, net of accumulated amortisation and accumulated impairment loss, if any.
Expenditure on software and related implementation costs are capitalized where it is expected to provide enduring economic benefits and are amortised on a monthly basis over a period of five years.
Non-compete fees paid on acquisition of business is being amortised on monthly basis over a period of ten years.
Corporate Overview 01-48
Statutory Reports 49-124
Financial Statements 125-220
Notes forming part of the Financial Statements
recognised in the statement of profit and loss on a straight- line basis over the period of lease.
(e)
At each balance sheet date, the management assess whether there is any indication that the assets are impaired. If any such indication exists, the recoverable amount of the asset is estimated in order to determine the extent of impairment loss. Recoverable amount is the higher of an asset’s net selling price and its value in use. In assessing value in use, the estimated future cash flows expected from the continuing use of the asset and from its disposal are discounted to their present value using a pretax discount rate that reflects the current market assessments of time value of money and the risks specific to the asset. Cash flows used to determine value in use are derived from the annual budgets and strategic plans of the cash generating units. For certain cash generating units, variable growth may be considered even beyond the period of five years, having regard to factors like maturity of the business and scope for geographical expansion.
Borrowing cost includes interest, ancillary costs incurred in connection with the arrangement of borrowings and exchange difference arising from foreign currency borrowings to the extent they are regarded as adjustment to the interest cost.
Borrowing costs that are directly attributable to the acquisition, construction or production of qualifying assets are capitalised. The other costs are charged to the statement of profit and loss. Discount on Commercial Paper is amortised on straight line basis over its tenure.
(f) Investments
Reversal of impairment loss is recognised as income in the statement of profit and loss.
Assets taken on lease by the Company in its capacity as lessee, where the Company has substantially assumed all risks and rewards of ownership are classified as finance lease. Such a lease is capitalised at the inception of the lease period at lower of fair value or present value of the minimum lease payments and a liability is recognised for an equivalent amount. Each lease rental paid is allocated between the liability and the interest cost, so as to obtain a constant periodic rate of interest on the outstanding liability for each year. Lease arrangements where the risks and rewards incidental to ownership of an asset substantially vests with the lessor, are recognised as operating leases. Lease rental under operating leases are
Investments of a long-term nature are stated at cost, less adjustment for any diminution, other than temporary, in the value thereof. Current investments are stated at lower of cost or fair value.
(g) Inventories
(d) Leases
Borrowing Costs
(c) Impairment
Product development cost incurred on new products having enduring benefits is recognised as Intangible Assets and are amortised on a monthly basis over a period of ten years.
(h)
Inventories are stated at lower of cost or net realisable value. Cost is determined on weighted average method for all categories of inventories other than for auction/privately bought teas in which case cost is considered as actual cost for each lot. Cost comprises expenditure incurred in the normal course of business in bringing such inventories to its present location and condition, where applicable, appropriate overheads based on normal level of activity. Provision is made for obsolescence and other anticipated losses wherever considered necessary.
Foreign Currency Transactions Transactions in foreign currencies are recorded at average fortnightly spot rates. The exchange difference resulting from settled transactions is recognised in the statement of profit and loss. Year end balances of monetary items are restated at the year end exchange rates and the resultant net gain or loss is recognised in the statement of profit and loss.
137
Annual Report 2015-16
•
Connect with every sip
Notes forming part of the Financial Statements
or discount on forward contracts where there are underlying assets /liabilities are amortised over the life of the contract. Such foreign exchange forward contracts are revalued at the balance sheet date and the exchange difference between the spot rate at the date of the contract and the spot rate on the balance sheet date is recognised as gain/loss in the statement of profit and loss.
Revenue Recognition
(i)
(i)
Sales are recognised when the significant risks and rewards of ownership in the goods are transferred to the buyer as per of the contract .
(ii)
Income and fees from services are ed as per of relevant contractual agreements/arrangements.
(iii)
Export incentives are ed on accrual basis.
Other Income
(j)
Interest income and income from investments are ed on accrual basis.
Dividend income is recognised when the right to receive dividend is established.
(l)
Post retirement defined benefits including gratuity, pension and medical benefits for qualifying executives / wholetime directors as provided by the Company are determined through independent actuarial valuation at year end and charge recognised in the statement of profit and loss. For schemes, where recognised funds have been set up, annual contributions determined as payable in the actuarial valuation report are contributed. Actuarial gains and losses are recognised in the statement of profit and loss.
The Company recognizes in the statement of profit and loss, gains or losses on settlement of a defined benefit plan as and when the settlement occurs.
ii)
Other Employee Benefits: Other employee benefits are ed for on accrual basis. Liabilities for compensated absences are determined based on independent actuarial valuation at year end and charge is recognised in the statement of profit and loss. Short term Employee Benefits are recognised on an undiscounted basis whereas Long Term Employee Benefits are recognised on a discounted basis.
iii)
Other Employee Termination Benefits: Payments to employees on termination along with additional liabilities towards retirement benefits arising pursuant to the termination are charged to the statement of profit and loss in the year in which it is incurred.
(k) Replanting/Rejuvenation
Plans. In respect of PF contribution made to a Self istered Trust, the Company is liable for annual contributions and any shortfall in the fund assets based on the government specified minimum rates of return, such contribution and shortfall, if any is recognized as an expense in the year incurred.
Cost of replanting/rejuvenating tea bushes/fuel trees is charged to revenue. Related Tea Board subsidies are accrued as Other Income on obtaining approval from Tea Board.
Compensation of Land Compensation, if any, in respect of land surrendered or incidental rights thereto/vested in Governments under various State Land Legislations is ed for as and when received.
(m) Employee Benefits
i)
138
Post retirement employee benefits: Post retirement benefits like Provident Fund which are in the nature of defined benefit plans and also Superannuation schemes, in the nature of defined contribution plans, are maintained by the Company and for certain categories contributions are made to State
(n)
Research and Development Research and Development expenditure of revenue nature is charged to revenue and capital expenditure is included under fixed assets.
Corporate Overview 01-48
Statutory Reports 49-124
Financial Statements 125-220
Notes forming part of the Financial Statements
(o) Taxes on Income
Current Income Tax is measured at the amount expected to be paid to the tax authorities in accordance with Income Tax Act, 1961.
Deferred tax is recognised for all the timing differences, subject to the consideration of prudence in respect of deferred tax assets.
Deferred tax assets are recognised and carried forward only to the extent that there is a reasonable certainty that sufficient future taxable income will be available against which such deferred tax assets can be realised.
(p)
Fair value hedges are marked to market on balance sheet date and gain or loss recognised in the statement of profit and loss.
(q)
(r) Provisions
Financial Instruments
The Company uses foreign currency forward contracts and options to hedge its risks associated with foreign currency fluctuations relating to certain firm commitments and highly probable transactions. The Company designates these hedging instruments as cash flow hedges.
Hedging instruments are initially measured at fair value and are remeasured at subsequent reporting dates. Gain or loss on of change in the fair value of hedging instruments in respect of effective portion of cash flow hedges are recognised in the hedging reserve . On occurrence of the underlying transactions the accumulated balance is transferred from hedging reserve and recognised in the statement of profit and loss. The portion of the gain or loss on the hedging instruments if determined to be an ineffective cash flow hedge is recognised in the statement of profit and loss.
Cash and Cash Equivalent Cash and Cash equivalents for the purpose of cash flow statement comprise of cash at bank and in hand and short term investments/bank deposits with an original maturity of three months or less.
(s)
Provisions are recognised when there is a present obligation as a result of past event and it is probable that an outflow of resources embodying economic benefits will be required to settle the obligation and a reliable estimate can be made of the amount of the obligation. Provisions are measured at the best estimate of the expenditure required to settle the obligation at the reporting date and are not discounted to its present value. These estimates are reviewed at each reporting date and adjusted to reflect the current best estimates.
Contingent Liabilities Contingent liabilities exist when there is a possible obligation arising from past events, the existence of which will be confirmed only by the occurrence or non occurrence of one or more uncertain future events not wholly within the control of the Company, or a present obligation that arises from past events where it is either not probable that an outflow of resources will be required or the amount cannot be reliably estimated. Contingent liabilities are appropriately disclosed unless the possibility of an outflow of resources embodying economic benefits is remote.
139
Annual Report 2015-16
•
Connect with every sip
Notes forming part of the Financial Statements Rs. in Crores 2016
2015
110.00
75.00
63.11
61.84
63.11
61.84
2016
2015
No. of shares
No. of shares
% of holding
% of holding
142854570
142854570
22.63%
23.10%
54416998
31213954
8.62%
5.05%
43175140
43175140
6.84%
6.98%
2016
2015
618398570
618398570
12731159
-
631129729
618398570
3. Share Capital AUTHORISED 110,00,00,000 (75,00,00,000) Equity Shares of Re. 1 each* ISSUED, SUBSCRIBED AND PAID-UP 63,11,29,729 (61,83,98,570) Equity Shares of Re. 1 each, fully paid-up*
a) The details of Shareholders holding more than 5% shares as at March 31, 2016 is set out below : Name of Shareholder
Tata Sons Limited Life Insurance Corporation of India Tata Chemicals Limited b)The reconciliation of the number of shares as at March 31, 2016 is set out below: Particulars Number of shares as at the beginning of the year Add: Shares issued during the year consequent to amalgamation Number of shares as at the end of the year c) Rights, preferences and restrictions attached to shares
The Company has one class of equity shares having a par value of Re. 1 each. Each shareholder is eligible for one vote per share held. The dividend proposed by the Board of Directors is subject to the approval of the shareholders in the ensuing Annual General Meeting, except in case of interim dividend. In the event of liquidation, the equity shareholders are eligible to receive the remaining assets of the Company after distribution of all preferential amounts, in proportion to their shareholding. *Consequent to and as part of the amalgamation of the erstwhile Mount Everest Mineral Water Limited with the Company ,the Authorised Share Capital of the Company stands increased to Rs. 110 Crores made up of 110,00,00,000 Equity Shares of Re. 1/- each with effect from May 18, 2015(effective date of Merger). Pursuant to this amalgamation, the Company during the year has issued 12731159 equity shares which was ed under Shares Suspense in the previous year (Refer Note 34a).
140
Corporate Overview 01-48
Statutory Reports 49-124
Financial Statements 125-220
Notes forming part of the Financial Statements 2016
Rs. in Crores 2015
4. Reserves and Surplus Capital Reserve Opening Balance 15.79 0.09 Add: Addition on Amalgamation (Refer Note 34a) 15.70 Closing Balance 15.79 15.79 Securities Opening Balance 333.79 552.93 Add: Addition on Amalgamation (Refer Note 34a) 86.89 Less: Deduction on Amalgamation (Refer Note 34a) (306.03) Closing Balance 333.79 333.79 Debenture Redemption Reserve Opening Balance 81.25 81.25 Closing Balance 81.25 81.25 Revaluation Reserve Opening Balance 21.86 21.86 Closing Balance 21.86 21.86 Contingency Reserve Opening Balance 1.00 1.00 Closing Balance 1.00 1.00 Hedging Reserve Opening Balance 5.16 3.50 Add: Movement during the year (net) (5.06) 1.66 Closing Balance 0.10 5.16 General Reserve Opening Balance 1059.34 1030.44 Add: Transferred from surplus in statement of profit and loss 56.37 28.90 Closing Balance 1115.71 1059.34 Surplus in the statement of profit and loss Opening Balance 920.35 820.35 Add: Profit for the year 563.67 289.00 Add: Profit of Amalgamating Company (Refer Note 34a) 2.39 Amount available for appropriation 1484.02 1111.74 Appropriations Adjustments on evaluation of useful life of Fixed Assets 0.72 Proposed Dividend 142.00 142.00 Provision for Dividend Distribution Tax * 22.36 19.77 Transferred to General Reserve 56.37 28.90 Net Surplus in the statement of profit and loss 1263.29 920.35 Total Reserves and Surplus 2832.79 2438.54 *For the purpose of computation of Dividend Distribution Tax (DDT) on the proposed dividend, the Company has reduced DDT on the dividend received from its Indian subsidiaries and foreign subsidiaries on which tax has been paid under section 115-O and section 115-BBD of the Income tax act,1961. Accordingly, provision for dividend distribution tax (DDT) for the current year is net of DDT credit/ writeback of Rs. 7.35 Crores (Rs. 9.94 Crores) relating to current/earlier years.
141
Annual Report 2015-16
•
Connect with every sip
Notes forming part of the Financial Statements Rs. in Crores 2016
2015
325.00
325.00
(325.00)
-
-
325.00
5. Long-Term Borrowings Secured Loans 3250 (3250), 3 % Non-Convertible, privately placed, Debentures of Rs. 10 Lakhs each. Less: Maturing in next 12 months Redeemable at of Rs. 223205 per debenture on 22.10.2016, at the end of 3 years from the date of allotment 22.10.2013. Secured by way of a first mortgage on certain immovable assets of the company and partly by pledge of shares of certain companies held as investments.
Rs. in Crores 2016
2015
72.54
72.54
(72.54)
-
-
72.54
6. Other Long-Term Liabilities Payable on Redemption of Debentures Less: Payable in next 12 months
Rs. in Crores 2016
2015
101.93
90.33
75.94
23.69
177.87
114.02
7. Long-Term Provisions Employee Benefits Other Provisions (Refer Note 35)
Rs. in Crores 2016
2015
52.61
80.26
8. Short-Term Borrowings Secured Loans From Banks Working Capital Facilities Secured by way of hypothecation of raw materials, finished products, stores and spares and book debts on pari u basis Unsecured Loans From Banks
142
-
72.24
52.61
152.50
Corporate Overview 01-48
Statutory Reports 49-124
Financial Statements 125-220
Notes forming part of the Financial Statements Rs. in Crores 2016
2015
194.39
142.46
3.99
1.42
198.38
143.88
9. Trade Payables Trade Payables* Due to Micro and Small Enterprises * Includes due to Related Parties - Rs. 16.85 Crores (Rs. 11.79 Crores) Rs. in Crores 2016
2015
6.30
6.05
10. Other Current Liabilities Unpaid Dividends*
4.42
4.33
Statutory Liabilities
13.60
11.25
Security Deposits from Customers
34.98
33.01
Interest Accrued but not due on borrowings
325.00
-
Payable on Redemption of Debentures (Refer Note 6)
72.54
-
Others
88.11
98.84
544.95
153.48
Current Maturities of Long-Term Debentures (Refer Note 5)
*There are no amounts due and outstanding to be credited to the Investor Education and Protection Fund. Rs. in Crores 2016
2015
15.74
15.35
0.29
0.42
11. Short-Term Provision Employee Benefits Wealth Tax less advance payment Rs. 3.81 Crores (Rs. 3.67 Crores)
142.00
142.00
Tax on Dividend (Net of Rs. 13.42 Crores (Rs. 13.42 Crores))
16.29
16.30
Other Provisions (Refer Note 35)
20.89
18.54
195.21
192.61
Proposed Dividend
143
Annual Report 2015-16
•
Connect with every sip
Notes forming part of the Financial Statements 12. Fixed Assets
Rs. in Crores Cost As at March 31, 2015
Depreciation
On Amalgamation (Note 34a)
Additions/ Adjustment
Deductions/ Adjustment
As at March 31, 2016
Net Book Value
As at March 31, 2015
On Amalgamation (Note 34a)
For the Year
Deductions/ Adjustment/ (Impairment)
As at March 31, 2016
As at March 31, 2016
As at March 31, 2015
1.82
TANGIBLE Owned : Land Tea Estate Land/Fuel Area (Including Development)
Buildings Bridges Plant & Equipment Furniture, Fixtures & Office Equipment Motor Vehicles Total
Previous year
1.82
-
-
-
1.82
@
-
-
-
-
-
1.82
(1.42)
(0.40)
-
-
(1.82)
@
-
-
-
-
-
(1.82)
5.55
-
-
-
5.55
-
-
-
-
-
5.55
(5.55)
-
-
-
(5.55)
-
-
-
-
-
(5.55)
48.86
-
4.38
1.40
51.84
@
14.10
-
1.04
0.53
14.61
37.23
(41.52)
(4.52)
(2.81)
-
(48.85)
@
(11.55)
(1.58)
(0.97)
-
(14.10)
(34.75)
0.00
-
-
-
0.00
*
0.00
-
-
-
0.00
*
0.00*
(0.00)
-
-
-
(0.00)
*
(0.00)
-
-
-
(0.00)
*
(0.00)*
215.44
-
26.48
15.23
226.69
@
113.94
-
12.50
13.59
112.85
113.84
(165.87)
(28.05)
(22.89)
(1.38)
(215.43)
@
(87.71)
(15.00)
(11.73)
(0.50)
(113.94)
(101.49)
40.28
-
2.73
0.27
42.74
17.06
-
3.39
0.26
20.19
22.55
(27.68)
(0.81)
(11.95)
(0.16)
(40.28)
(13.30)
(0.29)
(3.56)
(0.10)
(17.05)
(23.23)
4.43
-
0.40
0.08
4.75
2.36
-
0.24
0.07
2.53
2.22
(3.48)
(0.48)
(0.89)
(0.41)
(4.44)
(2.07)
(0.25)
(0.44)
(0.39)
(2.37)
(2.07)
316.38
-
33.99
16.98
333.39
147.46
-
17.17
14.45
150.18
183.21
245.53
34.26
38.54
1.95
316.38
114.63
17.12
16.70
0.99
147.46
168.91
-
5.55
34.75 0.00 101.49 23.23
2.07 168.91
INTANGIBLE Capitalised Software Patent/Knowhow (Refer Note 36 b) Non Compete Fee
24.60
-
4.25
-
28.85
13.04
-
3.56
-
16.60
12.25
(17.64)
(0.23)
(6.73)
-
(24.60)
(10.56)
(0.23)
(2.25)
-
(13.04)
(11.56)
17.63
-
-
-
17.63
5.42
-
1.76
(7.00)
14.18
+
3.45
(17.63)
-
-
-
(17.63)
(3.65)
-
(1.76)
-
(5.41)
3.00
-
-
-
3.00
2.35
-
0.30
-
2.65
(3.00)
-
-
-
(3.00)
(2.05)
-
(0.30)
-
(2.35)
(0.65)
20.81
-
5.62
(7.00)
33.43
16.05
16.27
0.23
4.31
-
20.81
24.43
Total
45.23
-
4.25
-
49.48
Previous Year
38.27
0.23
6.73
-
45.23
-
12.22
(12.22) +
0.35
1)
Cost of Land Includes a portion leased to an Associate.
2)
Cost of Buildings include Rs. 5.90 Crores (Rs. 5.90 Crores) represented by shares in Co-operative Housing Societies / a Company.
3)
(@) Includes amount of Rs. 1.26 Crores (Rs. 1.26 Crores), Rs. 0.62 Crores (Rs. 0.62 Crores), Rs. 0.08 Crores (Rs. 0.08 Crores),respectively, tly owned /held with a subsidiary company.
4)
(+) Unexpired period of amortisation for Patent/Knowhow is 71 months and Non Compete fees is 14 months.
5)
* Amount is below the rounding off norm adopted by the Company.
144
11.56
0.65 24.43
Corporate Overview 01-48
Financial Statements 125-220
Statutory Reports 49-124
Notes forming part of the Financial Statements Rs. in Crores Class
Nos.
Face Value of each
2016
2015
161.51
161.51
161.51
161.51
50.33
50.33
-
2.72
-
0.47
-
0.10
2.34
2.36
-
0.17
-
2.95
52.67
59.10
13. Non-Current Investments Long-Term Trade Investments (Fully paid up and valued at cost) (a) Quoted Equity Investments Investment in Subsidiaries : Tata Coffee Ltd. (Refer Foot Note 1) #
Equity Shares
107359820
Rs.
1
#Inclusive of Rs. 21.86 Crores (Rs. 21.86 Crores) kept in Revaluation Reserve Others: Tata Chemicals Ltd. (Refer Foot Note 1)
Equity Shares
11185522
The Indian Hotels Co Ltd. (Refer Foot Note 4)
Equity Shares
(1687742)
Tata Motors Ltd. (Refer Foot Note 4)
Equity Shares
Tata Investment Corporation Ltd. (Refer Foot Note 4)
"A" Ordinary Shares Equity Shares
10
Re.
(1)
Rs.
(2)
(116665)
Tata Motors Ltd. (Refer Foot Note 4)
Rs.
(16665)
Rs.
(2)
158469
Rs.
10
(160000) Tata Steel Ltd. (Refer Foot Note 4)
Equity Shares
Titan Company Ltd. (Refer Foot Note 4)
Equity Shares
(12021)
Rs.
(10)
(9248060)
Rs.
(1)
(b) Unquoted Equity Investments Investment in Subsidiaries : Tata Tea Extractions Inc.
Common Stock
14000000
US$
1
59.80
59.80
Tata Global Beverages Group Ltd.
Ordinary Shares
70666290
GBP
1
500.71
500.71
Tata Global Beverages Capital Ltd.
Ordinary Shares
89606732
GBP
1
763.89
763.89
Consolidated Coffee Inc.
Common Stock
199
US$
0.01
92.49
92.49
58.24
24.70
0.05
0.05
(58.24)
(24.70)
1416.94
1416.94
Zhejiang Tata Tea Extraction Company Ltd. @ ( Refer Foot Note 3) Tata Tea Holdings Private Limited
Equity Shares
50000
Rs.
Less: Provision for diminution in the value of investment (Refer Foot Note 3)
10
@ Amount of Investments is RMB 7.25 Crores (RMB 3.85 Crores) in the share capital of the company.
145
Annual Report 2015-16
•
Connect with every sip
Notes forming part of the Financial Statements Rs. in Crores Class
Nos.
Face Value of each
2016
2015
Investment in Associates : Estate Management Services (Pvt.) Ltd.
Ordinary Shares *
12078406
LKR
10
14.57
14.57
Amalgamated Plantations Pvt. Ltd.
Equity Shares
61024400
Rs.
10
61.02
61.02
Kanan Devan Hills Plantations Company (Pvt.) Ltd.
Equity Shares
3976563
Rs.
10
12.33
12.33
TRIL Constructions Limited
Equity Shares
11748148
Rs.
10
11.75
11.75
99.67
99.67
* Sale of these investments requires first offer of sale to the venture partners. Investment in t Ventures : NourishCo Beverages Limited (Refer Foot Note 2)
Equity Shares
Tata Starbucks Private Limited (Refer Foot Note 2)
Equity Shares
90500000
Rs.
10
90.50
77.50
Rs.
10
178.00
150.00
268.50
227.50
(77500000) 178000000 (150000000) Others: 1755
Rs.
1000
9.75
9.75
475
Rs.
1000
0.05
0.05
Equity Shares
613598
Rs.
10
0.95
0.95
Equity Shares
6519441
Rs.
100
115.82
115.82
Equity Shares
4200000
Rs.
10
4.20
4.20
130.77
130.77
Tata Sons Ltd.
Equity Shares
Tata Services Ltd.
Ordinary Shares
Tata Capital Ltd. Tata Industries Ltd. Taj Air Ltd. (c) Unquoted Preference Shares Investment in Associates : Amalgamated Plantations Pvt. Ltd.
0.01% Non Cum. Redeemable Preference Shares @
67000000
Rs.
10
67.00
67.00
TRIL Construction Limited
0.001% Non Cumulative, Non-redeemable and mandatorily fully convertible Preference Shares @@
66751852
Rs.
10
66.75
66.75
133.75
133.75
@ Redeemable with Special redemption within 7-9 years from the issue date and extension is being considered in line with the agreements. @@ Redeemable within six years from the issue date.
146
Corporate Overview 01-48
Financial Statements 125-220
Statutory Reports 49-124
Notes forming part of the Financial Statements Rs. in Crores Class
Nos.
Face Value of each
2016
2015
-
2.09
-
2.09
(d) Quoted Debentures The Indian Hotels Co. Ltd. (Refer Foot Note 4)
Compulsory Convertible Debenture
-
(379741)
Rs.
(55)
Other than Trade (Fully paid up and valued at cost) (a) Quoted Equity Investments SBI Home Finance Ltd.
Equity Shares
100000
Rs.
10
Less: Provision for diminution in the value of investment
0.10
0.10
(0.10)
(0.10)
-
-
(b) Unquoted Equity Investments The Annamallais Ropeways Co. Ltd.
Ordinary Shares
2092
Rs.
100
0.02
0.02
ABC Tea Workers Welfare Services
Ordinary Shares
20000
Rs.
10
0.02
0.02
Assam Hospitals Ltd.
Equity Shares
200000
Rs.
10
0.20
0.20
The Valparai Co-operative Wholesale Stores Ltd.
Ordinary Shares
350
Rs.
10
0.00*
0.00
Suryakiran Apartment Services Private Ltd
Equity Shares
2146
Rs.
10
0.00*
0.00
Jalpaiguri Club Ltd. (Cost Re. 1)
Ordinary Shares
60
Rs.
10
0.00
0.00
GNRC Ltd.
Equity Shares
50000
Rs.
10
0.05
0.05
IFCI Venture Capital Funds Ltd.
Equity Shares
250000
Rs.
10
0.25
0.25
Ritspin Synthetics Ltd.
Equity Shares
100000
Rs.
10
0.10
0.10
TEASERVE
Equity Shares
1
Rs.
5000
*
0.00
0.00
12280
Rs.
10
0.00*
0.00
(0.11)
(0.11)
0.53
0.53
*
(The Tamil Nadu Tea Manufacturers' Service Industrial Co-operative Society Ltd.) Woodlands Hospital & Medical Res. Centre Ltd.
Equity Shares
Less: Provision for diminution in the value of investment (c) Unquoted Debentures The Bengal Chamber of Commerce & Industry
6 1/2% Debentures
Shillong Club Ltd. (Cost Rs. 2)
5% Debentures
7
Rs.
1000
0.00*
0.00
31
Rs.
100
0.00*
0.00
0.00
*
0.00
0.00*
0.00
-
-
(d) Unquoted Preference Shares Thakurbari Club Ltd. (Cost Re. 1)
Preference Shares
26
Rs.
100
(e) Unquoted Government Securities
147
Annual Report 2015-16
•
Connect with every sip
Notes forming part of the Financial Statements Rs. in Crores Class W. B. Estates Acquisition Compensation Bond Total Aggregate Amount of Quoted investments Market Value of Quoted Investments Aggregate Amount of Unquoted investments Aggregate provision for diminution in value of investments
Nos.
Face Value of each
2016
2015
0.00* 0.00* 2264.34 214.18 1389.03 2050.16 58.45
0.00 0.00 2231.86 222.70 1875.27 2009.16 24.91
1.
3723648 shares of Tata Chemicals Ltd. and 31000400 shares of Tata Coffee Ltd. are pledged against outstanding 3% Non Convertible privately placed Debentures.
2.
During the year, the Company has invested an amount of Rs. 13 Crores towards issue of equity shares by NourishCo Beverages Limited and Rs. 28 Crores towards issue of equity shares by Tata Starbucks Private Limited. Both these Companies are 50:50 t ventures.
3.
During the year, the Company has converted the Shareholder loan to Zhejiang Tata Tea Extractions Company Limited (ZTTECL), with effect from 25th March 2016, to equivalent equity in that Company. The revised shareholding of the Company post this conversion in ZTTECL stands at 81.46%. Subsequent to year end, fresh equity infusion was made in ZTTECL amounting to Rs. 74.41 Crores.
4.
During the year, the Company has sold some of its investments and the resultant profit has been ed under exceptional item (Refer Note 29).
*
Investment costs are below Rs. 0.01 Crores. Rs. in Crores 2016
2015
15.90
17.39
15.90
17.39
3.12
2.51
35.45
31.17
14. Deferred Tax Assets (net) Deferred Tax Liability Depreciation Deferred Tax Asset
Provision for doubtful debts/advances
Employee Benefits
Employee Separation Schemes
3.75
4.11
on Redemption of Debentures
4.44
12.81
Other Assets
8.62
12.54
55.38
63.14
39.48
45.75
148
Corporate Overview 01-48
Financial Statements 125-220
Statutory Reports 49-124
Notes forming part of the Financial Statements Rs. in Crores 2016
2015
15. Long-Term Loans and Advances Unsecured and Considered Good unless other wise stated Capital Advances
1.15
1.83
Security Deposit
24.38
25.39
Advance Tax (net of provisions of Rs. 1406.99 Crores (Rs. 1315.96 Crores))
31.22
19.86
MAT Credit entitlement
39.00
-
Inter Corporate Loans (Secured)
24.00
24.00
Employee Loans and Advances
0.75
0.71
Other Advances
Loan to Subsidiary (Refer note 13, foot note 3)
-
Less: Provision for Impairment
-
33.54 -
33.54
-
Considered Doubtful Security Deposit
0.29
Less: Provision for Doubtful Deposits
0.29
0.29 -
0.29
120.50
71.79 Rs. in Crores
2016
2015
70.50
70.50
70.50
70.50
16. Other Non-Current Assets Property Rights Pending Development (Refer Note 34b)
Rs. in Crores 2016
2015
17. Inventories (At lower of cost or net realisable value) Raw Material
Tea (Includes in transit Rs. 2.32 Crores (Rs. 3.10 Crores))
Packing Materials
634.23
565.00
34.92
34.94 669.15
599.94
Finished Goods Tea Others
209.49
209.50
3.24
0.55 212.73
210.05
Traded Goods
Formulations and Others
2.14
0.87
Stores and Spare Parts
5.69
8.41
889.71
819.27
149
Annual Report 2015-16
•
Connect with every sip
Notes forming part of the Financial Statements Rs. in Crores 2016
2015
Considered Good
1.57
0.82
Considered Doubtful
6.98
5.20
122.52
92.80
131.07
98.82
18. Trade Receivables (Unsecured) Outstanding for a period exceeding six months from the date they are due for payment
Others Considered Good Less : Provision for Doubtful Debts
6.98
5.20
124.09
93.62 Rs. in Crores 2015
2016 19. Cash and Bank Balances Cash and Cash Equivalents Cash and Cheques in hand Fixed Deposit with Banks In Mutual Funds Bank Balances in Current Other Bank Balances Unclaimed Dividend s
0.02 50.00 173.33 9.55
232.90
0.02 10.83 4.11
6.30 239.20
14.96 6.05 21.01 Rs. in Crores
2016
2015
32.43
18.16
4.29
5.57
20. Short-Term Loans and Advances Unsecured and Considered Good unless other wise stated Due from Related Parties Insurance Claims Receivable Other Trade Advances
18.42
18.72
Taxes Receivable
16.55
9.33
Inter Corporate Deposits (Includes secured deposit of Rs. 4.75 Crores (Rs. 5.00 Crores))
13.75
26.50
Employee Loans and Advances Prepaid Expenses
0.33
0.52
18.70
14.56
Considered Doubtful Other Advances for Supply of Goods and Services
1.75
Less: Provision for Advances
1.75
1.75 104.47
150
1.75
93.36
Corporate Overview 01-48
Statutory Reports 49-124
Financial Statements 125-220
Notes forming part of the Financial Statements Rs. in Crores 2016
2015
Interest Accrued
1.52
2.01
Export Incentive Receivable
1.75
1.90
3.27
3.91
21. Other Current Assets
Rs. in Crores 2016
2015
22. Revenue from Operations 2953.43
2774.29
Others
25.94
19.03
Sales of Traded Goods
Sales of Tea
10.50
3.27
Service Income
1.44
1.36
Less: Excise duty
6.82
0.24 2984.49
2797.71
Other Operating Revenues 7.59
7.52
Liabilities no longer required written back
18.09
24.74
Management Service Fees
47.07
41.84
Miscellaneous Receipts
26.68
12.71
Export Incentive
99.43
86.81
3083.92
2884.52 Rs. in Crores
2016
2015
23. Other Income Dividend Income from Non Current Trade Investments Dividend from Mutual Funds Dividend from Investment in Subsidiaries
29.30
23.35
1.30
0.62
67.38
113.10 97.98
137.07
Profit on Sale of Current Investments
0.14
0.11
Rent Income
0.37
0.48
Profit on sale/discard of Fixed Assets (net)
0.94
-
Interest Income on Advances/Deposits etc.
7.14
17.50
106.57
155.16
151
Annual Report 2015-16
•
Connect with every sip
Notes forming part of the Financial Statements Rs. in Crores 2016
2015
24. Cost of Materials Consumed Tea
Opening Stock
565.00
420.62
Add: Purchases
1759.99
1827.94
Less: Closing Stock
634.23
565.00
Green Leaf
1690.76
1683.56
18.45
16.25
Packing Material
Opening Stock
34.95
25.90
Add: Purchases
170.70
171.37
Less: Closing Stock
34.92
34.95 170.73
Others
162.32
9.02
10.74
1888.96
1872.87 Rs. in Crores
2016 25. Change in Inventories of Finished Goods/Stock-in-trade/ Work-in-progress Stock as at March 31, 2015 Tea Others On Amalgamation Stock as at March 31, 2016 Tea Others
209.50 1.42
2015
179.93 2.61 210.92 -
209.49 5.38
182.54 0.39 209.50 1.42
214.87 (3.95)
210.92 (27.99) Rs. in Crores
26. Employee Benefits Expense Salaries, Wages and Bonus* (Refer Note 38) Contribution to Provident Fund and other Funds Workmen and Staff Welfare Expenses Others
2016
2015
132.78 18.89 28.56 6.65 186.88
119.62 17.92 17.70 6.68 161.92
* Includes net credit of earlier years Rs. 2.56 Crores (Rs. 1.70 Crores) and expense on Corporate Social Responsibility Rs. 1.51 Crores (Rs. 0.95 Crores).
152
Corporate Overview 01-48
Statutory Reports 49-124
Financial Statements 125-220
Notes forming part of the Financial Statements Rs. in Crores 2016
2015
27. Finance Costs Interest On Fixed Loans
10.33
17.88
On Debentures
9.75
9.75
On Other Loans
9.32
6.38 29.40
Bank Charges
34.01
0.21
0.18
29.61
34.19 Rs. in Crores 2016
2015
62.85
55.38
9.95
8.42
Power and Fuel (net of recovery)
26.76
27.84
Repairs to Plant and Machinery
4.27
3.56
Repairs to Buildings
5.48
4.66
45.64
38.77
8.23
6.75
279.64
207.65
45.79
55.49
6.54
3.43
21.81
18.89
28. Other Expenses Manufacturing and Contract Packing Expenses * Consumption of Stores and Spare Parts
Rent Rates and Taxes (net) ment and Sale Charges Freight Insurance Management Service Fees Loss on sale/discard of Fixed Assets (net) Provision for Doubtful debts/advances Miscellaneous Expenses ** ( Refer Note 38)
-
0.14
1.78
-
139.13
128.27
657.87
559.25
* Includes Contract Packing Expenses Rs. 38.15 Crores (Rs. 33.55 Crores). ** Includes exchange gain Rs. 7.00 Crores (Rs. 7.80 Crores) and expense on Corporate Social Responsibility Rs. 4.02 Crores (Rs. 2.96 Crores).
153
Annual Report 2015-16
•
Connect with every sip
Notes forming part of the Financial Statements Rs. in Crores 2016
2015
327.79
-
Levy relating to past demerged business
(3.00)
-
Provision for retrospective amendment of legislation relating to employee benefit
(0.97)
-
29. Exceptional Items (Net) Income Profit on sale of Non-Core Investment (Expenditure)
-
(6.99)
(52.25)
(61.93)
(7.00)
-
264.57
(68.92)
Cost of new Initiatives and restructuring activities Provision for Impairment/obligations relating to a Subsidiary (Refer Note 36a) Provision for impairment of Intangibles (Refer note 36b)
30. Estimated amount of contracts remaining to be executed on capital and not provided for as at March 31, 2016 aggregated Rs. 2.29 Crores (Rs. 7.70 Crores) (Capital Advances Rs. 1.15 Crores (Rs. 1.83 Crores)).
31. Contingent Liabilities not provided for in respect of:
(a)
Claims under adjudication not acknowledged as debts:
(i) (ii)
Taxes, Statutory Duties/ Levies etc. Commercial and other Claims
Gross Rs. in Crores
Net of Estimated Tax Rs. in Crores
25.18
19.39
(11.64)
(7.23)
2.33
1.42
(4.72)
(2.99)
(b)
Labour disputes under adjudication relating to some staff – amount not ascertainable.
(c)
Guarantees given to the lenders of subsidiary Rs. 75.94 Crores (Rs. 72.53 Crores). These corporate guarantees were issued against loans drawn by a Subsidiary Company from banks as working capital loans and term debts. Subsequent to year end, loans to the extent of Rs. 71.88 Crores have been repaid.
32. Micro enterprises and small enterprises under the Micro, Small and Medium Enterprises Development Act, 2006 have been determined based on the confirmations received in response to intimation in this regard sent by the Company to the suppliers. No interest in of Section 16 of Micro, Small and Medium Enterprises Development Act, 2006 or otherwise has either been paid or payable or accrued and remaining unpaid as at March 31, 2016.
33. The company had entered into a put option agreement with International Finance Corporation (IFC) in relation to their investment in Amalgamated Plantations Private Limited (APPL) under which IFC could exercise a put option by 29th April 2016, with an obligation on the Company to purchase a maximum of 300 Lakhs shares. This option was not exercised by IFC.
154
Corporate Overview 01-48
Statutory Reports 49-124
Financial Statements 125-220
Notes forming part of the Financial Statements 34. (a)
During the previous year, pursuant to a Scheme of Amalgamation of Mount Everest Mineral Water Limited (Subsidiary of the Company) with the Company as sanctioned by the Honorable High Courts of Himachal Pradesh and Calcutta, all assets and liabilities of the subsidiary had been transferred to and vested with the Company retrospectively with effect from 1st April 2013. The amalgamation has been ed for in the books of of the Company according to the “Pooling of Interests Method” of ing as per the ing Standard (AS) 14, ‘ing for Amalgamations’ specified under section 133 of the Companies Act, 2013 read with Rule 7 of the Companies (s) Rules, 2014. All assets and liabilities, reserves have been recorded in the books of of the Company at their existing carrying amounts and in the same form. Further, in accordance with the Scheme, the difference between carrying value of investments in the Amalgamating Company as reflected in the books of the Company and the corresponding paid up capital of the amalgamating Company along with the debit balance in the Statement of Profit and Loss as of April 1, 2013 of the Amalgamating Company had been adjusted against the securities of the Company. The application and reduction of the securities was effected as an integral part of the sanctioned Scheme under reference to section 391 and section 394 of the Companies Act, 1956 read with section 78 and section 100 of the Companies Act, 1956.
The company during 2013-14 had entered into a development agreement with Tata Reality and Infrastructure Limited for development of commercial /residential property through a special purpose vehicle TRIL Constructions Limited (TCL). The consideration for the transfer of land with buildings/structures in Yehswantpur, Bangalore was Rs. 195 Crores. The said consideration was discharged by combination of cash, investment in TCL through equity and compulsorily convertible preference shares (Refer Note 13 - Non-Current Investments) and constructed office space in the property to be developed.
(b)
35.
Other Provisions Rs. in Crores Description
Trade Obligations Restructuring Costs Obligations relating to a Overseas Subsidiary Company
Opening Balance
Provision during the year
Amount paid/ Adjusted during the year
Closing balance
Classification
13.09
6.04
-
19.13
Short-Term
5.46
-
3.70
1.76
Short-Term
23.69
52.25
-
75.94
Long-Term
36. (a)
During the year the Company has evaluated its exposure in its Chinese Subsidiary Company which is under t Venture Control. In view of delays in startup and stabilisation of technology for an enhanced product range and on considerations of ing prudence the Company has recognised a provision of Rs. 52.25 Crores (Rs. 23.69 Crores) on of obligations arising from bank loans availed by the Subsidiary. In previous year the Company had recognised a dimuntion, other than temporary, in its investment and convertible loans cumulating to Rs. 38.24 Crores.
The Company has recognised an impairment loss in the carrying value of its Patent/Knowhow. The impairment arose on of revision in the business plans with lower than expected economic benefits over its estimated useful life. A pre tax discounting rate of 22.3 % has been used for value in use evaluation (Refer Note 48).
(b)
37. The current tax charge is net of credit on of writebacks pertaining to earlier years of Rs. 18.10 Crores (Rs. 51.40 Crores). Prior year included one-time credit arising on amalgamation of Mount Everest Mineral Water Limited with the Company and credit relating to debenture redemption charged to Securities in an earlier year.
155
Annual Report 2015-16
•
Connect with every sip
Notes forming part of the Financial Statements 38. Corporate Social Responsibility (CSR)
As per Section 135 of the Companies Act, 2013, a CSR Committee has been formed by the Company.
(a)
Gross Amount required to be spent by the Company during the year Rs. 4.50 Crores
(b)
Amount spent during the year on: Rs. in Crores Particulars
In Cash
Yet to be paid in cash
Total
-
-
-
5.43
0.10
5.53
2016
2015
563.67
289.00
631129729
618398570
-
12731159
631129729
631129729
Basic
8.93
4.58
Diluted
8.93
4.58
(i) Construction/acquisition of any asset (ii) On purposes other than (i) above
39.
Earnings Per Share Profit after taxation (Rs. in Crores ) Numbers of Equity Shares Outstanding Add: Equity shares to be issued consequent to Amalgamation lying in Share Suspense Total Number of Shares Earnings Per Share (Rs.)
Rs. in Crores
40.
2016
2015
Capital Expenditure
0.71
0.34
Revenue Expenditure
5.50
4.99
6.21
5.33
Expenditure incurred in respect of the Company's Research and Development
41. The Company’s leasing arrangements are in respect of operating leases for premises (residential, office, godown etc.) and motor cars. These operating leasing arrangements which are cancellable ranges between 5 months to 5 years and are usually renewable on mutually agreeable . The aggregate lease rentals payable in respect of premises are charged as Rent and in respect of motor cars amounting to Rs. 4.59 Crores (Rs. 4.34 Crores) are charged under Miscellaneous expense under Note 29 of the Statement of Profit and Loss.
156
Corporate Overview 01-48
Statutory Reports 49-124
Financial Statements 125-220
Notes forming part of the Financial Statements 42. Value of Raw Materials and Stores and Spare Parts consumed - Gross Raw Materials Value % of total Rs. in Crores consumption Imported Indigenous
54.18 (54.48) 1834.78 (1818.39) 1888.96 (1872.87)
2.87 (2.91) 97.13 (97.09) 100.00 (100.00)
Stores and Spares Value % of total Rs. in Crores consumption 0.75 (0.80) 14.24 (13.65) 14.99 (14.45)
5.00 (5.54) 95.00 (94.46) 100.00 (100.00)
2016
Rs. in Crores 2015
190.82 1.32 57.76 47.07 17.87
166.13 1.24 103.60 41.84 1.41 8.96
2016
Rs. in Crores 2015
2.93 9.93 19.03 1.45
2.91 3.79 16.81 3.51
2016
Rs. in Crores 2015
55.85 1.97 0.72 5.76
55.46 1.32 0.56 1.69
2016
2015
1 2.37 5.33 2014-15
1 1.04 2.34 2013-14
43. Earnings in Foreign Exchange Value of Exports at F.O.B. Technical Service Fees - Gross Dividends - Gross Management Service Fees Interest Others (Freight, Insurance etc.)
44. Expenditure in Foreign Currency Foreign Travel Professional Fees Management Service Fees Other Expenses
45. Value of Imports on C.I.F. basis Raw Materials Finished Goods Stores & Spare Parts Capital Goods
46.
Dividend remitted in foreign currency No. of shareholders No. of shares held in Crores Dividend remitted (Rs. Crores) Year
157
Annual Report 2015-16
•
Connect with every sip
Notes forming part of the Financial Statements 47. A)
Related Party Disclosure
Subsidiaries (contd..)
Related Parties
OOO Tea Trade LLC
Promoter
OOO Sunty LLC
Tata Coffee Limited
Tata Sons Limited
Subsidiaries
Tata Global Beverages Group Limited
Tata Global Beverages Holdings
Tata Global Beverages Services Limited
Tata Global Beverages GB Limited
Tata Global Beverages Overseas Holdings Limited
Tata Global Beverages Overseas Limited
Lyons Tetley Limited
Tata Global Beverages U.S. Holdings, Inc.
Tetley USA Inc.
Tata Global Beverages Canada Inc.
Tata Global Beverages Australia Pty Limited
Stansand Limited Stansand (Brokers) Limited
Consolidated Coffee Inc. Eight ‘O Clock Coffee Company Eight ‘O Clock Holdings Inc. Tata Tea Extractions Inc.
Tata Global Beverages Capital Limited
Zhejiang Tata Tea Extraction Company Limited
Tata Tea Holdings Private Limited
Earth Rules Pty. Ltd.
Associates
Estate Management Services Pvt. Limited, Sri Lanka
Amalgamated Plantations Pvt. Limited
Kanan Devan Hills Plantation Company Private Limited TRIL Constructions Limited
Stansand (Africa) Limited
t Ventures
Stansand (Central Africa) Limited
NourishCo Beverages Limited
Tata Global Beverages Polska Sp.z.o.o
Tata Starbucks Private Limited
Drassington Limited, UK Good Earth Corporation
Associates of Subsidiaries
Good Earth Teas Inc.
Bjets Pte. Ltd.
Teapigs Limited Teapigs US LLC.
Tata Global Beverages Czech Republic a.s
Joekels Tea Packers (Proprietary) Limited (South Africa)
Tata Global Beverages Investments Limited
Campestres Holdings Limited Kahutara Holdings Limited Suntyco Holding Limited Onomento Co. Limited
158
t Venture of Subsidiaries
Tetley ACI (Bangladesh) Limited
Southern Tea LLC Empirical Group LLC
Tetley Clover (Private) Limited
Key Management Personnel
Mr. Ajoy Misra - CEO & Managing Director
Mr. L KrishnaKumar - Executive Director & Group CFO
Corporate Overview 01-48
Statutory Reports 49-124
Financial Statements 125-220
Notes forming part of the Financial Statements Particulars of transactions during the year ended March 31, 2016 Nature of Transactions Subsidiaries Associates
Sale of Goods & Services Other Operating Income # Rent Paid Purchase of Goods & Services Fees for Marketing Other Expenses (Net) Reimbursement of Expenditure/(Income) Dividend/Interest received Dividend Paid Sale of Investments Deposits Redemmed Investments Made Guarantee Given Directors Remuneration *
t Ventures
Promoter
193.70 (170.77) 51.84 (41.84) 56.30 (37.27) 2.66 ((0.93)) 67.38 (114.50) 33.54 3.41 (72.53) -
0.60 (0.04) (1.09) 1.84 (1.34) 289.53 (266.50) 3.25 (2.83) 3.92 (1.16 ) 10.44 (12.02) -
20.35 (19.62) 0.30 (0.31) 7.57 (13.82) (1.51) ((1.23)) 41.00 (75.00) -
(0.32) 9.20 (8.47) 0.41 ((0.01)) 4.21 (1.40) 32.14 (32.14) 312.31 (1.00) -
Key Management Personnel 6.18 (5.14)
83.35 (43.71) 1.36 (1.96)
25.18 (24.09) 6.75 (2.14)
5.11 (2.32) 0.36 -
8.38 (7.69)
-
Rs. in Crores Total
214.65 (190.43) 52.14 (43.24) 1.84 (1.66) 345.83 (303.77) 7.57 (13.82) 12.45 (11.30) 5.48 ((1.01)) 82.03 (127.92) 32.14 (32.14) 312.31 (1.00) 74.54 (75.00) 3.41 (72.53) 6.18 (5.14)
Outstanding at the year end : Debit Credit
-
* Provision for employee benefits, which are based on actuarial valuation done on an overall Company basis, is excluded. # Includes amount recovered for expenditure incurred on Tata Coffee Grand which is an Instant Coffee product, tly developed by the Company with its Subsidiary under a provisional agreement. The Company is in the process of finalising the definitive agreements pertaining to “ Tata Coffee Grand”. The above does not include share of recurring benefits payable to former Managing Directors. In respect of Royalty agreements, moratorium period are prescribed and such transactions are not disclosed above to the extent there are no outflows/inflows.
159
Annual Report 2015-16
•
Connect with every sip
Notes forming part of the Financial Statements 47. B) Disclosures in respect of transactions in excess of 10% of the total related party transactions of the same type: Rs. in Crores 1
Sale of Goods and Services
2016
2015
Tata Global Beverages Group Limited
106.58
94.80
Tata Global Beverages Polska Sp.z.o.o
-
16.39
58.70
45.65
-
19.62
47.07
41.84
Tata Tea Extractions US Inc. NourishCo Beverages Limited 2
Other Operating Income
3
Purchase of Goods & Services
Tata Global Beverages Services Ltd. Kanan Devan Hills Plantation Company Private Limited Amalgamated Plantations Pvt. Ltd. Kanan Devan Hills Plantation Company Private Limited Tata Global Beverages Services Ltd.
4
Rent Paid
-
1.09
206.89
180.29
82.64
86.21
-
18.06
-
0.32
Amalgamated Plantations Pvt. Ltd.
1.35
0.85
Kanan Devan Hills Plantation Company Private Limited
0.49
0.49
Tata Sons Ltd.
5
Fees for Marketing
NourishCo Beverages Limited
7.57
13.82
6
Other Expenses (Net)
Tata Sons Ltd.
9.20
8.47
Amalgamated Plantations Pvt. Ltd.
3.25
2.83
7
Reimbursement of Expenditure (Net)
Consolidated Coffee Inc.
1.51
0.51
Tata Global Beverages Services Ltd.
0.33
(1.50)
Amalgamated Plantations Pvt. Ltd.
3.95
1.14
Kanan Devan Hills Plantation Company Private Limited
(0.04)
0.03
NourishCo Beverages Limited
(1.44)
(1.21)
Tata Starbucks Private Limited
(0.07)
(0.03)
Tata Sons Ltd.
0.41
(0.01)
Tata Coffee Ltd.
0.80
-
0.07
-
Tata Tea Extractions US Inc.
(0.03)
-
Tetley USA Inc. 8
Dividend and Interest Received
Tata Global Beverages Group Limited
18.44
34.04
Tata Global Beverages Capital Limited
12.27
32.94
Tata Coffee Ltd.
13.96
13.96
Consolidated Coffee Inc.
16.79
20.54
-
11.62
Tata Tea Extractions US Inc. 9
Dividend Paid
Tata Sons Ltd.
32.14
32.14
10
Sale of Investments
Tata Sons Ltd.
312.31
-
11
Deposits Redeemed
Tata Sons Ltd.
-
1.00
12
Investments Made
NourishCo Beverages Limited
13.00
15.00
Tata Starbucks Private Limited
28.00
60.00
Zhejiang Tata Tea Extraction Company Limited*
33.54
-
Zhejiang Tata Tea Extraction Company Limited
3.41
43.59
13
Guarantee Given
*Converted into Equity during the year
160
Corporate Overview 01-48
Statutory Reports 49-124
Financial Statements 125-220
Notes forming part of the Financial Statements 47. C) Disclosure under Regulation 34(3) of the SEBI (Listing Obligations and disclsoure requirements) Regulations, 2015. Amount of Loans and Advances in nature of loans outstanding from subsidiaries and associates as at March 31, 2016: Rs. in Crores Outstanding
Maximum
March 31, 2016
during the year
Subsidiary Company -
33.54
(33.54)
(37.33)
Zhejiang Tata Tea Extraction Company Limited* Associate Company Kanan Devan Hills Plantation Company Private Limited
24.00
24.00
(24.00)
(24.00)
*Converted into Equity during the year
48. The Company is primarily engaged in tea with some presence in coffee and water. As per the threshold limits prescribed under ing Standard (AS-17) on “Segment Reporting” specified under section 133 of the Companies Act, 2013 read with Rule 7 of the Companies (s) Rules, 2014, the Company’s reportable activity falls within a single business segment, viz “Buying / Blending and Sale of tea in bulk and value added form” and hence the disclosure requirements are not applicable. It has identified Geographical segment as the secondary segment. During the year and previous year, the value of export sales made by the Company did not exceed the quantitative threshold provided for the relevant ing Standards. Accordingly no disclosures in the secondary format of geographical segment is required.
49.
Interest in t Venture i)
The Company's interest, as a venturer, in tly controlled entities (incorporated t Venture) is : Country of Incorporation
% Ownership interests as at March 31, 2016
% Ownership interests as at March 31, 2015
NourishCo Beverages limited
India
50%
50%
Tata Starbucks Private Limited
India
50%
50%
Name
161
Annual Report 2015-16
•
Connect with every sip
Notes forming part of the Financial Statements
ii)
The Company’s interest in these t Ventures is reported as Non-Current Trade Investments (Note - 13) and stated at cost. However, the Company’s share of each of the assets, liabilities, income and expenses, etc. (each without elimination of the effect of transactions between the Company and the t Venture) relating to its interests in these t Ventures are : Rs. in Crores 2016
2015
Balance Sheet SOURCES OF FUNDS
(a)
Share Capital
(b)
Reserves and Surplus
Shareholder's Funds
268.50
227.50
(161.69)
(125.61)
106.81
101.89
-
0.04
1.18
1.03
1.18
1.07
22.22
17.88
Non-current liabilities
(a)
Other long-term liabilities
(b)
Long-term provisions
Sub-total - Non-current liabilities Current Liabilities
(a)
Trade Payables
(b)
Other current liabilities
9.94
11.33
(c)
Short-term provisions
0.27
0.28
Sub-total - Current liabilities
32.43
29.49
TOTAL SOURCES OF FUNDS
140.42
132.45
79.44
81.00
Assets Non-current assets
(a)
Fixed Assets
(b)
Long-term loans and advances
Sub-total - Non-current assets
14.65
12.92
94.09
93.92
Current assets
(a)
(b) Inventories
Current investments
(c)
Trade Receivables
(d)
Cash & Bank balance
(e)
Short-term loans and advances
(f )
Other current assets
Sub-total - Current assets TOTAL APPLICATION OF FUNDS
162
8.59
3.37
17.09
15.30
4.03
1.29
4.54
11.92
12.01
6.58
0.07
0.07
46.33
38.53
140.42
132.45
Corporate Overview 01-48
Statutory Reports 49-124
Financial Statements 125-220
Notes forming part of the Financial Statements Rs. in Crores 2016
2015
184.56
137.63
2.01
1.49
186.57
139.12
Material Cost
96.56
72.51
Employee Benefits Expense
26.93
22.97
0.04
0.18
Statement of Profit and Loss Income Revenue from Operations Other Income Total Revenue Expenses
Finance Costs Depreciaton and Amortization expense
13.63
9.17
Other Expenses
85.49
75.94
Total Expenses
222.65
180.77
Profit before exceptional items
(36.08)
(41.65)
-
-
(36.08)
(41.65)
Exceptional items (net) Profit before tax Provision for tax Profit after tax
-
0.00*
(36.08)
(41.65)
* Amount is below the rounding off norm adopted by the Company.
50. Post Retirement Employee Benefits:
The Company operates defined benefit schemes like provident fund and defined contribution superannuation schemes. For these schemes, contributions are made by the Company, based on current salaries, to recognized funds maintained by the Company and for certain categories contributions are made to State Plans. In case of provident fund schemes, contributions are also made by the employees. An amount of Rs. 10.03 Crores (Rs. 9.35 Crores) has been charged to the statement of profit & loss on of defined contribution schemes.
The Company also operates defined benefit schemes like retirement gratuity, defined superannuation benefits and post retirement medical benefits. The superannuation benefits and medical benefits are restricted to certain categories of employees and qualifying employee/directors in the form of pension, medical and other benefits in of a specific policy related to the same (others). The defined benefit schemes offer specified benefits to the employees on retirement. Annual actuarial valuations are carried out by an independent actuary in compliance with ing Standard 15 (revised 2005) on Employee Benefits. Wherever recognized funds have been set up, annual contributions are also made by the Company. Employees are not required to make any contribution.
163
Annual Report 2015-16
•
Connect with every sip
Notes forming part of the Financial Statements
Amounts recognized in the statement of profit and loss and charged to Contribution to Provident Fund and other Funds, Workmen and Staff: Rs. in Crores Pension
Gratuity
Medical
Others
2016
2015
2016
2015
2016
2015
2016
2015
-
-
2.58
1.65
1.97
1.31
1.50
1.16
Current Service Cost
0.77
1.10
2.95
2.85
2.44
2.82
3.51
3.43
Expected Return on plan assets
(0.57)
(0.86)
(2.17)
(2.06)
-
-
-
-
Net actuarial loss/(gain) recognized during the year
(0.25)
0.16
4.31
5.22
0.62
(4.44)
6.65
3.15
Interest on obligation
-
-
-
(0.01)
-
-
-
-
Effects of the limit in Para 59(b)
(0.27)
(0.09)
-
-
-
-
-
-
Total recognized in statement of profit and loss
(0.32)
0.31
7.67
7.65
5.03
(0.31)
11.66
7.74
Losses/(Gains) on Acquistion/Divestiture
Reconciliation of opening and closing balances of the present value of the obligations: Pension Opening defined benefit obligation On amalgamation (Refer Note 34a ) Current Service Cost Interest Cost Actuarial loss/ (gain) Liabilities assumed on Acquisition / (settled on Divestiture) etc. Benefit Paid Closing Defined Benefit Obligation
Gratuity
Rs. in Crores Others
Medical
2016 10.61 0.77
2015 10.53 1.10
2016 38.69 2.58 2.95
2015 30.84 0.63 1.65 2.85
2016 29.88 1.97 2.44
2015 31.11 1.31 2.82
2016 43.83 1.50 3.51
2015 39.08 1.16 3.43
(0.48) -
(0.01) -
4.82 -
5.16 (0.70)
0.62 -
(4.44) -
6.65 -
3.15 -
(1.26) 9.64
(1.01) 10.61
(3.40) 45.64
(1.74) 38.69
(0.64) 34.27
(0.92) 29.88
(3.27) 52.22
(2.99) 43.83
Reconciliation of opening and closing balances of the fair value of plan assets: Rs. in Crores Pension Opening fair value of plan assets On amalgamation (Refer Note 34a )
Gratuity
2016
2015
2016
2015
8.50
8.39
31.51
26.50
-
-
-
0.81
0.57
0.86
2.17
2.06
Actuarial gain/ (loss)
(0.22)
(0.16)
0.51
(0.06)
Contribution/ ( Withdrawal) by employer
(1.00)
0.00
7.18
4.64
Expected Return on plan assets
-
-
-
(0.70)
(0.87)
(0.59)
(3.40)
(1.74)
Closing Fair value of Plan Assets
6.98
8.50
37.97
31.51
Actual Return on Plan Assets
0.35
0.70
2.68
2.00
Assets acquired on Acquisition / (settled on Divestiture) Benefits Paid
164
Corporate Overview 01-48
Financial Statements 125-220
Statutory Reports 49-124
Notes forming part of the Financial Statements
Major Categories of Plan Assets as a percentage of fair value of the total plan assets: 2016
2015
Govt of India Securities
3.6%
5.0%
PSU bonds
2.6%
3.3%
93.5%
91.5%
0.4%
0.2%
100.0%
100.0%
Insurance managed Funds Others Total
Effect of increase / decrease of one percentage point in the assumed medical inflation rates: Rs. in Crores Increase
Decrease
2016
2015
2016
2015
Effect on aggregate of interest cost and current service cost
0.68
0.53
(0.54)
(0.56)
Effect on defined benefit obligation
5.85
4.47
(4.67)
(4.01)
2016 7.80% 7.50% 8% LIC 1994-96 mortality tables
2015 8.00% 7.50% 8% LIC 1994-96 mortality tables
Principal Actuarial assumptions used:
Discount rates Expected rate of return on plan assets Medical inflation rate Mortality rates
The estimates of future salary increases considered in the actuarial valuation takes into factors like inflation, future salary increases, supply and demand in the employment market etc. The expected return on plan assets is based on actuarial expectation of the average long term rate of return expected on investments of the Funds during the estimated term of the obligations. Amounts recognized in the Balance Sheet are as follows: Rs. in Crores Pension Present value of funded obligation Fair Value of Plan Assets Present Value of Unfunded Obligation Amount not recognized as an asset (limit in Para 59 (b) of AS -15) Contribution adjustment Net Liability
Gratuity
2016 5.75 6.98 (1.23) 3.89 0.42
2015 6.47 8.50 (2.03) 4.14 0.69
2014 6.11 8.39 (2.28) 4.42 0.77
2013 6.42 8.37 (1.95) 4.63 0.66
2012 8.41 10.01 (1.60) 4.83 0.71
2016 45.64 37.97 7.67 0.00*
2015 38.69 31.51 7.18 -
2014 30.84 26.50 4.34 -
2013 26.36 21.20 5.16 -
2012 21.09 20.52 0.57 -
(0.99) 2.09
2.80
2.91
3.34
3.94
7.67
7.18
4.34
5.16
0.57
* Amount is below the rounding off norm adopted by the Company
165
Annual Report 2015-16
•
Connect with every sip
Notes forming part of the Financial Statements Rs. in Crores Medical
Others
2016
2015
2014
2013
2012
2016
2015
2014
2013
Present value of funded obligation
-
-
-
-
-
-
-
-
-
Fair Value of Plan Assets
-
-
-
-
-
-
-
-
-
34.27
29.88
31.11
32.79
27.95
52.22
43.83
39.08
26.56
-
-
-
-
-
-
-
-
-
34.27
29.88
31.11
32.79 27.95
52.22
43.83
39.08
26.56
2016
2015
2014
2013
2012
Experience adjustment on Plan Liability
10.09
(4.59)
7.51
(0.06)
3.14
Experience adjustment on Plan Assets
0.76
0.42
0.03
1.03
0.13
Present Value of Unfunded Obligation Amount not recognized as an asset (limit in Para 59 (b) of AS -15) Net Liability
Rs. in Crores
The contribution expected to be made by the Company for the year ending March 31, 2017 is not readily ascertainable.
The Guidance on Implementing AS15, Employee Benefits (revised 2005) issued by ing Standards Board (ASB) states that benefits involving employer established provident funds, which require interest shortfalls to be recompensed are to be considered as defined benefit plans. The Actuarial Society of India has issued the final guidance for measurement of provident fund liabilities during the quarter ended December 31, 2011.
The actuary has accordingly provided a valuation and based on the below provided assumptions there is no shortfall as at March 31, 2016. Rs. in Crores Particulars
2016
2015
Plan Assets as at period end
98.42
95.00
Present Value of Funded Obligations at period end
98.42
95.00
-
-
Amount Recognised in the Balance Sheet
Provident Fund
Assumptions used in determining the present value obligation of the interest rate guarantee under the Deterministic Approach: Particulars
Provident Fund 2016
2015
Guaranteed Rate of Return
8.75%
8.75%
Discount Rate for remaining term to Maturity of Investment
7.77%
7.95%
Expected Rate of Return on Investment
8.97%
8.94%
166
Corporate Overview 01-48
Financial Statements 125-220
Statutory Reports 49-124
Notes forming part of the Financial Statements 51. Disclosure requirement for Derivatives Instruments
The Company uses foreign currency hedges to manage its risks associated with foreign currency fluctuations relating to certain firm commitments and highly probable transactions. The Company does not use derivative contracts for trading or for speculative purposes.
a)
The outstanding forward exchange contracts for sale of foreign currency as at March 31, 2016 are: Type of Contract
2016
2015
No. of Contract
Foreign Currency in Crores
INR in Crores
No. of Contract
Foreign Currency in Crores
INR in Crores
USD
41
0.59
41.04
73
1.01
66.30
AUD
35
0.61
31.00
62
0.92
49.41
Forward Contract
b)
The foreign currency exposures of monetary items that have not been hedged are: 2016
2015
Foreign Currency in Crores
INR in Crores
Foreign Currency in Crores
INR in Crores
AUD
0.41
20.67
0.23
10.92
EUR
0.04
3.19
0.01
0.70
SGD
0.00*
0.04
-
-
USD
0.50
33.35
0.43
27.35
USD
0.06
4.13
0.04
2.44
GBP
0.01
1.02
0.02
1.85
Amounts receivable in foreign currency
Amounts payable in foreign currency
* Amount is below the rounding off norm adopted by the Company.
167
Annual Report 2015-16
•
Connect with every sip
Notes forming part of the Financial Statements Rs. in Crores
52.
2016
2015
Statutory Audit
0.60
0.53
Tax Audit
0.13
0.11
Arrears for Previous year
0.14
-
Other Services
0.69
0.48
Reimbursement of Expenses (including Service tax)
0.27
0.21
a) Auditors Remuneration and expenses
53. Unless otherwise stated, figures in brackets relate to previous year and have been rearranged / regrouped wherever necessary. For Lovelock & Lewes Firm Registration No. 301056E Chartered ants Dibyendu Majumder Partner hip No. 057687 Mumbai May 24, 2016
168
Cyrus P Mistry Chairman L Krishnakumar Executive Director V Leeladhar Director John Jacob Chief Financial Officer
Ajoy Misra Managing Director Harish Bhat Director Darius Pandole Director V Madan Company Secretary
Corporate Overview 01-48
Statutory Reports 49-124
Financial Statements 125-220
Independent Auditors’ Report To the of Tata Global Beverages Limited
implementation and maintenance of adequate internal financial controls, that were operating effectively for ensuring the accuracy and completeness of the ing records, relevant to the preparation and presentation of the financial statements that give a true and fair view and are free from material misstatement, whether due to fraud or error, which has been used for the purpose of preparation of the consolidated financial statements by the Directors of the Holding Company, as aforesaid.
Report on the Consolidated Financial Statements 1.
We have audited the accompanying consolidated financial statements of Tata Global Beverages Limited (“hereinafter referred to as the Holding Company”) and its subsidiaries (the Holding Company and its subsidiaries together referred to as “the Group”), its tly controlled entities and associate companies; (refer Note 2 (b)(i) to the attached consolidated financial statements), comprising of the consolidated Balance Sheet as at March 31, 2016, the consolidated Statement of Profit and Loss, the consolidated Cash Flow Statement for the year then ended, and a summary of significant ing policies and other explanatory information prepared based on the relevant records (hereinafter referred to as “the Consolidated Financial Statements”).
Management’s Responsibility for the Consolidated Financial Statements 2.
The Holding Company’s Board of Directors is responsible for the preparation of these consolidated financial statements in of the requirements of the Companies Act, 2013 (hereinafter referred to as “the Act”) that give a true and fair view of the consolidated financial position, consolidated financial performance and consolidated cash flows of the Group including its associates and tly controlled entities in accordance with ing principles generally accepted in India including the ing Standards specified under Section 133 of the Act read with Rule 7 of the Companies (s) Rules, 2014 and ing Standard 30, Financial Instruments: Recognition and Measurement issued by the Institute of Chartered ants of India to the extent it does not contradict any other ing standard referred to in Section 133 of the Act read with Rule 7 of Companies (s) Rules, 2014. The Holding Company’s Board of Directors is also responsible for ensuring accuracy of records including financial information considered necessary for the preparation of Consolidated Financial Statements. The respective Board of Directors of the companies included in the Group and of its associates and tly controlled entities are responsible for maintenance of adequate ing records in accordance with the provisions of the Act for safeguarding the assets of the Group and its associates and tly controlled entities respectively and for preventing and detecting frauds and other irregularities; the selection and application of appropriate ing policies; making judgements and estimates that are reasonable and prudent; and the design,
Auditors’ Responsibility 3.
Our responsibility is to express an opinion on these consolidated financial statements based on our audit. While conducting the audit, we have taken into the provisions of the Act and the Rules made thereunder including the ing standards and matters which are required to be included in the audit report.
4.
We conducted our audit in accordance with the Standards on Auditing specified under Section 143(10) of the Act and other applicable authoritative pronouncements issued by the Institute of Chartered ants of India. Those Standards and pronouncements require that we comply with ethical requirements and plan and perform the audit to obtain reasonable assurance about whether the consolidated financial statements are free from material misstatement.
5.
An audit involves performing procedures to obtain audit evidence about the amounts and disclosures in the consolidated financial statements. The procedures selected depend on the auditors’ judgement, including the assessment of the risks of material misstatement of the consolidated financial statements, whether due to fraud or error. In making those risk assessments, the auditor considers internal financial control relevant to the Holding Company’s preparation of the consolidated financial statements that give a true and fair view, in order to design audit procedures that are appropriate in the circumstances. An audit also includes evaluating the appropriateness of the ing policies used and the reasonableness of the ing estimates made by the Holding Company’s Board of Directors, as well as evaluating the overall presentation of the consolidated financial statements.
6.
We believe that the audit evidence obtained by us and the audit evidence obtained by the other auditors in of their reports referred to in sub-paragraph 9 of the Other Matters paragraph below, is sufficient and appropriate to 169
Annual Report 2015-16
Opinion In our opinion and to the best of our information and according to the explanations given to us, read with the proviso and the effect of the matter referred in the paragraph 8, below the aforesaid consolidated financial statements give the information required by the Act in the manner so required and give a true and fair view in conformity with the ing principles generally accepted in India of the consolidated state of affairs of the Group, its associates and tly controlled entities as at March 31, 2016, and their consolidated profit and their consolidated cash flows for the year ended on that date.
Emphasis of Matter 8.
As mentioned in Note 48 (c) to the consolidated financial statements, the overseas subsidiaries of the group have defined benefit schemes relating to which the actuarial losses or gains are allowed to be recognized in the Reserves as per the local generally accepted ing practices followed in those respective jurisdictions. For the purpose of consolidated financial statements the holding company has adopted the ing policy in respect of actuarial gains or losses for its overseas defined benefit schemes to reflect the applicable ing framework of the respective jurisdictions and consequently ed it in the Reserves instead of in the Statement of Profit and Loss. Had the Company followed the practice of recognition of actuarial gains/losses on the aforesaid defined benefit plans in the Statement of Profit and Loss as per ing Standard (AS 15) on Employee Benefits, the charge to employee benefits expense would have been higher by Rs. 53.15 Crores, the deferred tax charge would have been lower by Rs. 10.54 Crores, the consolidated profit before taxes and minority interest would have been lower by Rs. 53.15 Crores and the consolidated profit after taxes and minority interest would have been lower by Rs. 37.77 Crores.
Our opinion on the consolidated financial statements and our report on Other Legal and Regulatory Requirements below, is not modified in respect of the above matters with respect to our reliance on the work done and the reports of the other auditors.
Report on Other Legal and Regulatory Requirements 10.
As required by Section 143(3) of the Act, we report, to the extent applicable, that:
(a)
We have sought and obtained all the information and explanations which to the best of our knowledge and belief were necessary for the purposes of our audit of the aforesaid consolidated financial statements.
(b)
In our opinion, proper books of as required by law maintained by the Holding Company, its subsidiaries included in the Group, associate companies and tly controlled entities incorporated in India including relevant records relating to preparation of the aforesaid consolidated financial statements have been kept so far as it appears from our examination of those books and records of the Holding Company and the reports of the other auditors.
(c)
The Consolidated Balance Sheet, the Consolidated Statement of Profit and Loss, and the Consolidated Cash Flow Statement dealt with by this Report are in agreement with the relevant books of
Other Matter 9.
We did not audit the financial statements/financial information of 39 subsidiaries, and 6 tly controlled entities whose financial statements/ financial information reflect total assets of Rs. 7,397.35 Crores and net assets of Rs. 5,469.71 Crores as at March 31, 2016, total revenue of Rs. 5,319.66 Crores, net loss of Rs. 160.22 Crores and net decrease in cash flows amounting to Rs. 242.28 170
Connect with every sip
Crores for the year ended on that date, as considered in the consolidated financial statements. The consolidated financial statements also include the Group’s share of net loss of Rs. 1.41 Crores for the year ended March 31, 2016 as considered in the consolidated financial statements, in respect of 4 associate companies whose financial statements/ financial information have not been audited by us. These financial statements/ financial information have been audited by other auditors whose reports have been furnished to us by the Management, and our opinion on the consolidated financial statements insofar as it relates to the amounts and disclosures included in respect of these subsidiaries, tly controlled entities and associate companies and our report in of sub-section (3) of Section 143 of the Act insofar as it relates to the aforesaid subsidiaries, tly controlled entities and associates, is based solely on the reports of the other auditors.
provide a basis for our audit opinion on the consolidated financial statements.
7.
•
Corporate Overview 01-48
(d)
(e)
(f )
Statutory Reports 49-124
maintained by the Holding Company, its subsidiaries included in the Group, associate companies and tly controlled entities incorporated in India including relevant records relating to the preparation of the consolidated financial statements.
In our opinion, the aforesaid consolidated financial statements comply with the ing Standards specified under Section 133 of the Act, read with Rule 7 of the Companies (s) Rules, 2014 and ing Standard 30, Financial Instruments: Recognition and Measurement issued by the Institute of Chartered ants of India to the extent it does not contradict any other ing standard referred to in Section 133 of the Act read with Rule 7 of Companies (s) Rules, 2014.
i.
The consolidated financial statements disclose the impact, if any, of pending litigations as at March 31, 2016 on the consolidated financial position of the Group, its associates and tly controlled entities– Refer Note 34 and 35 to the consolidated financial statements.
ii.
Provision has been made in the consolidated financial statements, as required under the applicable law or ing standards, for material foreseeable losses, if any, on longterm contracts including derivative contracts as at March 31, 2016.
iii.
There were no amounts which were required to be transferred to the Investor Education and Protection Fund by the Holding Company, and its subsidiary companies, associate companies and tly controlled companies incorporated in India during the year ended March 31, 2016.
On the basis of the written representations received from the directors of the Holding Company as on March 31, 2016 taken on record by the Board of Directors of the Holding Company and the reports of the statutory auditors of its subsidiary companies, associate companies and tly controlled companies incorporated in India, none of the directors of the Group companies, its associate companies and tly controlled companies incorporated in India is disqualified as on March 31, 2016 from being appointed as a director in of Section 164 (2) of the Act. With respect to the adequacy of the internal financial controls over financial reporting of the Holding Company, its subsidiary companies, associate companies and tly controlled companies incorporated in India and the operating effectiveness of such controls, refer to our separate Report in Annexure A.
(g)
Financial Statements 125-220
With respect to the other matters to be included in the Auditors’ Report in accordance with Rule 11 of the Companies (Audit and Auditors) Rules, 2014, in our opinion and to the best of our information and according to the explanations given to us:
For Lovelock & Lewes Firm Registration Number: 301056E Chartered ants
Place: Mumbai Date : May 24, 2016
Dibyendu Majumder Partner hip Number: 057687
171
Annual Report 2015-16
•
Connect with every sip
Annexure A to Independent Auditors’ Report Referred to in paragraph 10 (f ) of the Independent Auditors’ Report of even date to the of Tata Global Beverages Limited on the consolidated financial statements for the year ended March 31, 2016
Those Standards and the Guidance Note require that we comply with ethical requirements and plan and perform the audit to obtain reasonable assurance about whether adequate internal financial controls over financial reporting was established and maintained and if such controls operated effectively in all material respects.
Report on the Internal Financial Controls under Clause (i) of Sub-section 3 of Section 143 of the Act 1.
In conjunction with our audit of the consolidated financial statements of the Company as of and for the year ended March 31, 2016, we have audited the internal financial controls over financial reporting of Tata Global Beverages Limited (hereinafter referred to as “the Holding Company”) and its subsidiary companies, its associate companies and tly controlled companies, which are companies incorporated in India, as of that date.
4.
Our audit involves performing procedures to obtain audit evidence about the adequacy of the internal financial controls system over financial reporting and their operating effectiveness. Our audit of internal financial controls over financial reporting included obtaining an understanding of internal financial controls over financial reporting, assessing the risk that a material weakness exists, and testing and evaluating the design and operating effectiveness of internal control based on the assessed risk. The procedures selected depend on the auditor’s judgement, including the assessment of the risks of material misstatement of the financial statements, whether due to fraud or error.
5.
We believe that the audit evidence we have obtained and the audit evidence obtained by the other auditors in of their reports referred to in the Other Matters paragraph below, is sufficient and appropriate to provide a basis for our audit opinion on the Company’s internal financial controls system over financial reporting.
Management’s Responsibility for Internal Financial Controls 2.
The respective Board of Directors of the Holding company, its subsidiary companies, its associate companies and tly controlled companies, which are companies incorporated in India, are responsible for establishing and maintaining internal financial controls based on internal control over financial reporting criteria established by the Company considering the essential components of internal control stated in the Guidance Note on Audit of Internal Financial Controls Over Financial Reporting issued by the Institute of Chartered ants of India (ICAI). These responsibilities include the design, implementation and maintenance of adequate internal financial controls that were operating effectively for ensuring the orderly and efficient conduct of its business, including adherence to the respective company’s policies, the safeguarding of its assets, the prevention and detection of frauds and errors, the accuracy and completeness of the ing records, and the timely preparation of reliable financial information, as required under the Act.
Auditor’s Responsibility 3.
Our responsibility is to express an opinion on the Company’s internal financial controls over financial reporting based on our audit. We conducted our audit in accordance with the Guidance Note on Audit of Internal Financial Controls Over Financial Reporting (the “Guidance Note”) issued by the ICAI and the Standards on Auditing deemed to be prescribed under section 143(10) of the Companies Act, 2013, to the extent applicable to an audit of internal financial controls, both applicable to an audit of internal financial controls and both issued by the ICAI. 172
Meaning of Internal Financial Controls Over Financial Reporting 6.
A company’s internal financial control over financial reporting is a process designed to provide reasonable assurance regarding the reliability of financial reporting and the preparation of financial statements for external purposes in accordance with generally accepted ing principles. A company’s internal financial control over financial reporting includes those policies and procedures that (1) pertain to the maintenance of records that, in reasonable detail, accurately and fairly reflect the transactions and dispositions of the assets of the company; (2) provide reasonable assurance that transactions are recorded as necessary to permit preparation of financial statements in accordance with generally accepted ing principles, and that receipts and expenditures of the company are being made only in accordance with authorisations of management and directors of the company; and (3) provide reasonable assurance regarding prevention or timely detection of unauthorised acquisition, use, or disposition of the company’s assets that could have a material effect on the financial statements.
Corporate Overview 01-48
Inherent Limitations of Internal Financial Controls Over Financial Reporting 7.
Because of the inherent limitations of internal financial controls over financial reporting, including the possibility of collusion or improper management override of controls, material misstatements due to error or fraud may occur and not be detected. Also, projections of any evaluation of the internal financial controls over financial reporting to future periods are subject to the risk that the internal financial control over financial reporting may become inadequate because of changes in conditions, or that the degree of compliance with the policies or procedures may deteriorate.
Statutory Reports 49-124
Financial Statements 125-220
Company considering the essential components of internal control stated in the Guidance Note on Audit of Internal Financial Controls Over Financial Reporting issued by the Institute of Chartered ants of India.
Other Matters 9.
Our aforesaid reports under Section 143(3)(i) of the Act on the adequacy and operating effectiveness of the internal financial controls over financial reporting insofar as it relates to 2 subsidiary companies, 3 associate companies and 2 tly controlled companies, which are companies incorporated in India, is based on the corresponding reports of the auditors of such companies incorporated in India. Our opinion is not qualified in respect of this matter.
Opinion 8.
In our opinion, the Holding Company, its subsidiary companies, its associate companies and tly controlled companies, which are companies incorporated in India, have, in all material respects, an adequate internal financial controls system over financial reporting and such internal financial controls over financial reporting were operating effectively as at March 31, 2016, based on the internal control over financial reporting criteria established by the
For Lovelock & Lewes Firm Registration Number: 301056E Chartered ants
Place: Mumbai Date : May 24, 2016
Dibyendu Majumder Partner hip Number: 057687
173
Annual Report 2015-16
•
Connect with every sip
Consolidated Balance Sheet As At March 31, 2016
Equity and Liabilities Shareholders' Funds Share Capital Reserves and Surplus Share Suspense Minority Interest Non-Current Liabilities Long Term Borrowings Deferred Tax Liabilities (Net) Other Long Term Liabilities Long Term Provisions Current Liabilities Short Term Borrowings Trade Payables Other Current Liabilities Short Term Provisions Total Assets Non-Current Assets Fixed Assets Tangible Assets Intangible Assets Goodwill on Consolidation Capital Work in Progress Intangible Assets under Development
Note 4 5
63.11 5655.81
6 7 8 9
505.53 179.81 6.09 260.28
10
293.07 758.22 741.27 273.86
11 12
5718.92 880.69
951.71
2066.42 9617.74
854.79 202.50 3791.79 43.89 4892.97 600.57 42.28 240.40 70.50 8.59 1728.11 632.08 538.93 819.17 44.14
5846.72
3771.02 9617.74
This is the Consolidated Balance Sheet referred to in our Report of even date.
For and on behalf of the Board
For Lovelock & Lewes Firm Registration No. 301056E Chartered ants
Cyrus P Mistry Chairman L KrishnaKumar Executive Director V Leeladhar Director John Jacob Chief Financial Officer
Mumbai 24th May, 2016 174
61.84 5429.68
883.94 156.42 79.58 224.99 382.03 759.37 387.32 269.18
5491.52 1.27 876.21
1344.93
1797.90 9511.83
13
Non-current Investments 14 Deferred Tax Assets (Net) 15 Long Term Loans and Advances 16 Other non-current Assets 17 Current Assets Current Investments 18 Inventories 19 Trade Receivables 20 Cash and Bank Balances 21 Short Term Loans and Advances 22 Other Current Assets 23 Total Summary of Significant ing Policies 3 The Notes are an integral part of the Consolidated Financial Statements
Dibyendu Majumder Partner hip No. 057687
Rs in Crores 2015
2016
779.81 249.76 3892.12 46.98 0.19 4968.86 617.76 54.25 189.32 70.50 4.26 1625.30 616.09 544.24 791.59 29.66
5900.69
3611.14 9511.83
Ajoy Misra Managing Director Harish Bhat Director Darius Pandole Director V Madan Company Secretary
Corporate Overview 01-48
Statutory Reports 49-124
Financial Statements 125-220
Consolidated Statement of Profit and Loss For The Year Ended March 31, 2016
Note Income Revenue from Operations-Net 24 Other Income 25 Total Revenue Expenses Cost of Materials Consumed 26 Purchase of Stock in Trade 27 Change in Inventories of Finished Goods/Work-in-progress/ 28 Stock in Trade Employee Benefits Expense 29 Finance Costs 30 Depreciaton and Amortisation Expense Less : Amount drawn from Revaluation Reserve Other Expenses 31 Total Expenses Profit before Exceptional Items and Taxes Exceptional Items 32 Profit before Tax Tax expenses Current tax (Refer Note 38) Less : MAT Credit Entitlement Net Current tax Deferred tax Profit after Taxation before Share of results of Associates and Minority Interest Share of net profit/(loss) in Associates Minority Interest Profit for the year Earnings Per Share 42 Equity share of nominal value of Re. 1 each Basic and Diluted (Rs.) The Notes are an integral part of the Consolidated Financial Statements
Rs in Crores 2015
2016 8110.51 70.60
7993.39 69.98 8181.11
8063.37
3605.00 330.54 (10.13)
3625.12 263.47 (51.25)
902.01 68.77 142.93 2608.43
857.67 81.86 135.77 (2.67) 2523.53 7647.55 533.56 11.88 545.44
219.86 39.00 180.86 29.54
7433.50 629.87 (129.99) 499.88 168.36 168.36 47.16
210.40 335.04 (1.41) (7.72) 325.91
(10.88) (25.66) 247.82
5.16
3.93
This is the Consolidated Statement of Profit and Loss referred to in our Report of even date.
For and on behalf of the Board
For Lovelock & Lewes Firm Registration No. 301056E Chartered ants
Cyrus P Mistry Chairman L KrishnaKumar Executive Director V Leeladhar Director John Jacob Chief Financial Officer
Dibyendu Majumder Partner hip No. 057687
215.52 284.36
Ajoy Misra Managing Director Harish Bhat Director Darius Pandole Director V Madan Company Secretary
Mumbai 24th May, 2016 175
Annual Report 2015-16
•
Connect with every sip
Consolidated Cash Flow Statement For The Year Ended March 31, 2016
A.
B.
Cash Flow from Operating Activities Net Profit before Tax Adjusted for : Depreciation and Amortisation (net of withdrawals from Revaluation Reserve) Dividend Income Profit on Sale of Long Term Trade Investments Profit on sale of current investments (net) Unrealised foreign exchange (gain) / loss Finance Cost Interest Income Provision for doubtful debts and advances Liabilities no longer required written back Debts and advances written off Provision for doubtful debts and advances no longer required written back (Profit) / loss on sale / discard of fixed assets (net) Other Exceptional Expense / (Income) (net) Operating Profit before working capital changes Adjustments for: Trade and other receivables Inventories Trade payables Cash generated from operations before Exceptionals Outflow on of Exceptional Items Direct taxes paid Net Cash from Operating Activities Cash Flow from Investing Activities Purchase of fixed assets Sale of fixed assets Purchase of Long Term Investments Sale of Long Term Investments Additional Investments in Subsidiaries (Purchase) / Sale of Current Investments (net) Dividend Income (including dividend from associates) Interest received Redemption of Bank Deposits (net) Inter Corporate Loans and Deposits (net) Net cash from / (used in) Investing Activities
176
2016
Rs in Crores 2015
545.44
499.88
142.93 (22.43) (327.79) (1.32) 1.05 68.77 (43.52) 2.39 (20.69) 5.59
133.11 (15.70) (0.75) 0.48 81.86 (52.02) 0.34 (50.43) 0.42
(0.07) (2.18) 315.91
(0.04) 1.02 120.33
(71.76) (102.54) (103.27)
118.64 664.08
(277.57) 386.51 (28.05) (246.94) 111.52
(166.24) 9.66 (0.31) 336.64 (3.37) 30.82 17.76 (0.25) 68.44
(19.28) (135.88) 23.12
218.62 718.50
(132.04) 586.46 (168.65) 417.81
(179.23) 0.37 (72.55) (93.19) (2.63) 24.17 36.97 111.24 293.15
(174.85)
Corporate Overview 01-48
Statutory Reports 49-124
Financial Statements 125-220
Rs in Crores 2015
2016 C.
D.
Cash Flow from Financing Activities Repayment of long term borrowings Working capital facilities (net) Dividend paid Dividend tax paid Interest paid Net Cash used in Financing Activities Net increase / (decrease) in Cash and Cash Equivalents Cash and Cash Equivalents Balances at the beginning of the year Exchange Gain/ (Loss) on translation of foreign currency cash/ cash equivalents Balances at the end of the year Cash and Cash Equivalents comprises of: Cash, Bank Balances in Current and Mutual Funds Short-Term Bank Deposits Balances at the end of the year
(80.38) (95.89) (159.09) (28.04) (65.62)
(180.86) 49.78 (161.46) (17.83) (82.01) (429.02) (24.35)
(392.38) (149.42)
536.53 18.59
718.15 (32.20)
530.77
536.53
255.19 275.58 530.77
85.12 451.41 536.53
Notes: 1 The above Cash Flow Statement has been prepared under the ' Indirect Method' as set out in the ing Standard on Cash Flow Statements (AS-3) specified under Section 133 of the Companies Act, 2013 read with Rule 7 of the Companies (s) Rules, 2014 2 Previous year's figures have been rearranged/regrouped wherever necessary. This is the Cash Flow statement referred to in our Report of even date. This is the Cash Flow statement referred to in our Report of even date.
For and on behalf of the Board
For Lovelock & Lewes Firm Registration No. 301056E Chartered ants
Cyrus P Mistry Chairman L KrishnaKumar Executive Director V Leeladhar Director John Jacob Chief Financial Officer
Dibyendu Majumder Partner hip No. 057687
Ajoy Misra Managing Director Harish Bhat Director Darius Pandole Director V Madan Company Secretary
Mumbai 24th May, 2016
177
Annual Report 2015-16
•
Connect with every sip
Notes to Consolidated Financial Statements
1.
General Information
Tata Global Beverages Limited (“the Holding Company”) and its subsidiaries, t ventures and associates (together, “the Group”) is a global beverages company engaged in the trading, production and distribution of Tea, Coffee and Water. The group has branded beverage business operations mainly in India, Europe, US, Canada and Australia, plantation business in India /Sri Lanka and extraction business mainly in lndia, US and China.
2.
(a) Basis of Consolidation
The consolidated financial statements comprises of the financial statements of the Group. The consolidated financial statements are prepared in accordance with ing Standard 21 on “Consolidated Financial Statements”, ing Standard 23 on “ing for Associates in Consolidated Financial Statements” and ing Standard 27 on “Financial Reporting of Interests in t Ventures” as required under Companies Act, 2013. The consolidated financial statements are prepared on the following basis:
(i) Investment in Subsidiaries The financial statements of the Holding Company and its subsidiary companies have been combined on a line by line basis by adding together like items of assets, liabilities, income and expenses. The intra-group balances, intra-group transactions and unrealised profits or losses thereon have been fully eliminated.
178
The financial statements of the subsidiaries used in the consolidation are drawn up to the same reporting date as that of the Holding Company.
The value of the consideration given over / below the net value of the identifiable assets acquired in the subsidiary companies are recognised as goodwill / capital reserve. Goodwill on consolidation disclosed under fixed assets is not amortised but is, however, tested for impairment.
(ii) Investment in Associates Investments in associates have been ed for using the equity method whereby the investment is initially recorded at cost and adjusted thereafter for post acquisition change in the Holding Company’s share of net assets. On acquisition of an associate, the goodwill/capital reserve from such acquisition is included in the carrying value of the investment and also disclosed separately. (iii) Investment in t Ventures t Venture of Holding Company as well as subsidiaries has been ed in the consolidated financial statements using the proportionate consolidation method whereby a venturer’s share of each of the assets, liabilities, income and expenses of the tly controlled entity is ed for on a pro-rata basis.
Corporate Overview 01-48
Financial Statements 125-220
Statutory Reports 49-124
Notes to Consolidated Financial Statements
b)
i) The subsidiaries, t ventures and associates considered in the consolidated financial statements are: Name of the Companies
Effective Voting Effective Country of Voting Incorporation power voting power power voting power held by the held held by the held Holding Holding Company Company (%)
(%)
(%) 2016
A)
(%) 2015
SUBSIDIARIES
Tata Global Beverages Group Ltd. [58.59% through subsidiaries]
UK
88.65
88.65
88.65
88.65
Tata Global Beverages Holdings Ltd.
UK
100.00
88.65
100.00
88.65
Tata Global Beverages Services Ltd.
UK
100.00
88.65
100.00
88.65
Tata Global Beverages GB Ltd.
UK
100.00
88.65
100.00
88.65
Tata Global Beverages Overseas Holdings Ltd.
UK
100.00
88.65
100.00
88.65
Tata Global Beverages Overseas Ltd.
UK
100.00
88.65
100.00
88.65
Lyons Tetley Ltd.
UK
100.00
88.65
100.00
88.65
Drassington Ltd.
UK
100.00
88.65
100.00
88.65
Teapigs Ltd.
UK
100.00
88.65
100.00
88.65
Teapigs US LLC
USA
100.00
88.65
100.00
88.65
Stansand Ltd.
UK
100.00
88.65
100.00
88.65
Stansand (Brokers) Ltd.
UK
100.00
88.65
100.00
88.65
Stansand (Africa) Ltd.
Kenya
100.00
88.65
100.00
88.65
Stansand (Central Africa) Ltd.
Malawi
100.00
88.65
100.00
88.65
South Africa
51.00
45.21
51.00
45.21
Subsidiaries of Tata Global Beverages Group Ltd.
Joekels Tea Packers (Proprietary) Ltd.
Poland
100.00
88.65
100.00
88.65
Czech Republic
100.00
88.65
100.00
88.65
Tata Global Beverages US Holdings Inc.
USA
100.00
88.65
100.00
88.65
Tetley USA Inc.
USA
100.00
88.65
100.00
88.65
Good Earth Corporation.
USA
100.00
88.65
100.00
88.65
Good Earth Teas Inc.
USA
100.00
88.65
100.00
88.65
Tata Global Beverages Canada Inc.
Canada
100.00
88.65
100.00
88.65
Tata Global Beverages Australia Pty Ltd.
Australia
100.00
88.65
100.00
88.65
Earth Rules Pty Ltd.
Australia
100.00
88.65
100.00
88.65
UK
100.00
88.65
100.00
88.65
Campestres Holdings Ltd.
Cyprus
100.00
88.65
100.00
88.65
Kahutara Holdings Ltd.
Cyprus
65.00
57.62
65.00
57.62
Suntyco Holding Ltd.
Cyprus
100.00
57.62
100.00
57.62
Onomento Co Ltd.
Cyprus
100.00
57.62
100.00
57.62
Tata Global Beverages Polska sp.zo.o Tata Global Beverages Czech Republic a.s.
Tata Global Beverages Investments Ltd.
179
Annual Report 2015-16
•
Connect with every sip
Notes to Consolidated Financial Statements
Name of the Companies
Effective Voting Effective Country of Voting Incorporation power voting power power voting power held by the held held by the held Holding Holding Company Company (%)
(%)
(%) 2016
(%) 2015
OOO Tea Trade LLC
Russia
100.00
57.62
100.00
57.62
OOO Sunty LLC
Russia
100.00
57.62
100.00
57.62
Empirical Group LLC
USA
56.00
49.64
56.00
49.64
Southern Tea LLC
USA
50.00
44.33
50.00
44.33
Bangladesh
50.00
44.33
50.00
44.33
Pakistan
50.00
44.33
50.00
44.33
USA
-
-
32.80
29.08
UK
100.00
100.00
100.00
100.00
India
57.48
57.48
57.48
57.48
USA
100.00
78.70
100.00
78.70
Eight O’Clock Holdings Inc.
USA
100.00
78.70
100.00
78.70
Eight O’Clock Coffee Inc.
USA
100.00
78.70
100.00
78.70
USA
-
-
27.09
21.32
USA
100.00
100.00
100.00
100.00
China
81.46
81.46
70.00
70.00
India
100.00
100.00
100.00
100.00
India
41.03
41.03
41.03
41.03
Sri Lanka
31.85
31.85
31.85
31.85
Kanan Devan Hills Plantations Co. Pvt. Ltd.
India
28.52
28.52
28.52
28.52
TRIL Constructions Ltd.
India
32.50
32.50
32.50
32.50
NourishCo Beverages Ltd.
India
50.00
50.00
50.00
50.00
Tata Starbucks Pvt. Ltd.
India
50.00
50.00
50.00
50.00
t ventures of Tata Global Beverages Group Ltd.
Tetley ACI (Bangladesh) Ltd. Tetley Clover (Pvt.) Ltd. Associates of Tata Global Beverages Group Ltd. RBC HoldCo. LLC (Refer Note (ii) below) Tata Global Beverages Capital Ltd. Tata Coffee Ltd. Subsidiaries of Tata Coffee Ltd. Consolidated Coffee Inc. Subsidiary of Consolidated Coffee Inc.
Associates of Consolidated Coffee Inc. RBC HoldCo LLC (Refer Note (ii) below) Tata Tea Extractions Inc. Zhejiang Tata Tea Extraction Company Ltd. (Refer Note (iii) below) Tata Tea Holdings Pvt. Ltd. B)
ASSOCIATES
Amalgamated Plantations Pvt. Ltd. Estate Management Services Pvt. Ltd.
C)
180
T VENTURES
Corporate Overview 01-48
Statutory Reports 49-124
Financial Statements 125-220
Notes to Consolidated Financial Statements
ii)
The entity formed post sale of the entire stake in a US based functional beverage company has been dissolved during the year, the same has not been consolidated for part of the year as the control was intended to be temporary.
iii)
With effect from March 25, 2016 the Holding Company converted the shareholder loan into equity in Zhejiang Tata Tea Extraction Company Ltd.
iv)
v)
vi)
The Holding Company during previous year amalgamated, pursuant to a Scheme of Amalgamation, Mount Everest Mineral Water Limited (subsidiary of the Holding Company) with the Holding Company as sanctioned by Honorable High Courts of Himachal Pradesh and Calcutta, retrospectively with effect from April 1, 2013. European Bank of Reconstruction and Development (EBRD) has entered into a put option agreement with Campestres Holdings Ltd. (CHL) and Tata Global Beverages Investments Ltd. (TGBIL), overseas subsidiaries of the holding company, in relation to their investment in Kahutara Holdings Ltd. In of the said agreement, EBRD has the right to exercise a put option whereby CHL and TGBIL are obliged to purchase the shares held by EBRD at fair market value after 6 years from the subscription date. Conversely, CHL has the right to exercise a call option on all the shares held by EBRD at the end of the stipulated 8 years at fair market value. The stipulated time period of 8 years may be bought forward if certain events as per the agreement are triggered. The Holding Company had entered into a put option agreement with International Finance Corporation (IFC) in relation to their investment in Amalgamated Plantations Private Limited (APPL) under which IFC could exercise a put option, by April 28, 2016, with an obligation on the Holding Company to purchase a maximum of 300 Lakh shares in APPL. This option was not exercised by IFC.
3. Significant ing Policies a) ing Convention
The financial statements have been prepared in accordance with the historical cost convention on an accrual basis and comply with the applicable
ing Standards specified under section 133 of the Companies Act, 2013 read with Rule 7 of the Companies (s) Rules, 2014 and ing Standard – 30 on Financial Instruments to the extent it does not contradict any other ing Standard.
These Financial Statements have been prepared as required under relevant provision of the Companies Act, 2013 and the presentation is based on the Schedule III of the Companies Act, 2013. All assets and liabilities are classified into current and noncurrent generally based on the criteria of realisation/settlement within twelve months period from the balance sheet date.
b. Fixed Assets and Depreciation
i) Tangible Tangible Assets are carried at cost of acquisition less accumulated depreciation and accumulated impairment losses, if any. Cost of extension planting of cultivable land including cost of development is capitalised. Assets acquired on hire purchase, for which ownership will vest at a future date, are capitalised at cash cost. Subsidies receivable from government in respect of fixed assets are deducted from the cost of respective assets as and when they accrue.
Depreciation is provided on assets, including assets created on land under lease, on a straight-line basis over the estimated useful life of fixed assets as stipulated by Schedule II of Companies Act, 2013 or as appropriate based on technical evaluation of the asset. Renewal of land leases is assumed, consistent with past practice. Estimated useful lives of assets are as follows: Leasehold buildings Leasehold Improvements Buildings Plant and Machinery Furniture and Fixtures Office Equipments Motor Vehicles
- Over the life of lease - Over the life of lease -
30 to 60 years 3 to 25 years 7 to 16 years 2 to 16 years 4 to 10 years
181
Annual Report 2015-16
•
Connect with every sip
Notes to Consolidated Financial Statements
ii) Intangible
Intangibles assets are stated at acquisition cost, net of accumulated amortisation and accumulated impairment loss, if any. Expenditure on software and related implementation cost, product development cost on new products, non-compete fee and other intangibles items, qualifying for recognition as intangibles assets and which provide enduring benefits are recognized as such.
interest cost so as to achieve a constant periodic rate of interest on the outstanding liability for each year.
e) Borrowing Costs
Intangible assets are amortised over their estimated useful life on a straight line basis. Estimated useful lives are as follows:
-
10 years
Trademark
-
25 years
Computer Software
-
5 to 10 years
f) Investments
Non-Compete Fees
-
10 years
At each balance sheet date, the management assesses whether there are any indications that the assets are impaired. If any such indication exists, the recoverable amount of the asset is estimated in order to determine the extent of impairment loss. Recoverable amount is the higher of an asset’s net selling price and its value in use. Value in use is the present value of estimated future cash flows expected from the continuing use of the asset and from its disposal at the end of its useful life. For certain cash generating units, variable growth is considered even beyond five years, given the potential of the business. Reversal of impairment loss is recognised as income in the statement of profit and loss.
182
Lease of assets where the Group, as a lessee, has substantially assumed all the risks and rewards of ownership are classified as finance leases. Finance leases are capitalised at the inception of the lease at lower of the fair value or the present value of the minimum lease payments and a liability is recognised for an equivalent amount. Each lease rental is allocated between the liability and the
Investments of a long-term nature are stated at cost, less adjustment for any diminution, other than temporary, in the value thereof. Current investments are stated at lower of cost or fair value.
g) Inventories
Inventories, other than stores and spares are stated at cost or net realisable value whichever is lower. Stores and spares are carried at cost, provision is made for obsolete, slow-moving and defective stocks, where necessary.
Cost is determined on weighted-average/FIFO method for all categories of inventories other than for auction / privately bought teas in which case cost is considered as actual cost for each lot. Cost comprises expenditure incurred in the normal course of business in bringing such inventories to its present location and condition, where applicable, includes, appropriate overheads based on the normal level of activity.
d) Leases
Borrowing costs that are directly attributable to the acquisition, construction or production of qualifying assets are capitalised as part of such assets. Borrowing costs include amortisation of issue / ancillary costs relating to the borrowings which are appropriately amortised over the expected term of the borrowing.
Patent /Knowhow
c) Impairment
Lease arrangements where the risks and rewards incidental to ownership of an asset substantially vest with the lessor, are recognised as operating leases. Lease rental under operating leases are recognised in the statement of profit and loss on a straight line basis over the period of lease.
h) Foreign Currency Transactions / Translation
i) Foreign Currency Transactions Transactions in foreign currency are recorded at a rate that approximates the prevalent exchange rate on the transaction date. Exchange differences resulting from settled transactions are adjusted in the statement of
Corporate Overview 01-48
Statutory Reports 49-124
Financial Statements 125-220
Notes to Consolidated Financial Statements
profit and loss. Year-end balances of monetary items are restated at the year-end exchange rates and the resultant net gain or loss is recognised in the statement of profit and loss.
or discount on forward contracts where there are underlying assets/liabilities are amortised over the life of the contract. Such foreign exchange forward contracts are revalued at the balance sheet date and the exchange differences between the spot rate at the date of the contract and the spot rate on the balance sheet date is recognised as gain/loss in the statement of profit and loss.
ii) Foreign Currency Translation In relation to non-integral overseas subsidiaries/t ventures all assets and liabilities are translated at the yearend exchange rates, where as income and expenditure are translated at an exchange rate that approximates the prevalent exchange rate on the transaction date. All resulting exchange differences are cumulated in Foreign Currency Translation Reserve until the disposal of net investment. On disposal of the net investment, the amount accumulated in Foreign Currency Translation Reserve is recognized in the statement of profit and loss.
Dividend income are recognised when the right to receive dividend is established
k) Replanting/Rejuvenation
Cost of replanting / rejuvenating tea / coffee bushes / fuel trees is charged to revenue.
Related Tea / Coffee Board subsidies are accrued as other income on obtaining approval from Tea / Coffee Board.
Compensation for Land
l)
Compensation, if any, in respect of land surrendered or incidental rights thereon vested in Governments under various State Land Legislations in India is ed for as and when received.
m) Employee Benefits
i)
Post retirement employee benefits: Contribution to post retirement defined benefit and contribution schemes like Provident Fund (PF), Superannuation Schemes and other such schemes are ed for on accrual basis by the Group. With regard to PF contribution made by the holding company to a Self istered Trust, holding company is generally liable for annual contributions and any shortfall in the fund assets based on the government specified minimum rates of return and recognises such contribution and shortfall, if any, as an expense in the year incurred.
Post retirement defined benefits including gratuity, pension and medical benefits for qualifying executives/wholetime directors as provided by the Group are determined through independent actuarial valuation at year end and charge recognised in the statement of profit and loss. For schemes, where recognised funds have been set up, annual contributions determined as payable in the actuarial valuation report are contributed. Actuarial gains and losses are recognised in the statement of profit and loss.
The Group recognises in the statement of profit and loss, gains or losses on curtailment
i) Revenue Recognition
In respect of integral foreign operations, the financial statements are translated as if the transactions of the foreign operations are those of the Holding Company.
Sales are recognised when significant risks and rewards of ownership in the goods are transferred to the buyer as per the of contract. Provisions for sales returns and other off invoice allowances relating to that year’s sale are offset from sales. Income and fees from services are ed as per of relevant agreements /arrangements. Export incentives are ed on an accrual basis.
j) Other Income
Interest income and income from investments are ed on an accrual basis.
183
Annual Report 2015-16
•
Connect with every sip
Notes to Consolidated Financial Statements
management’s expectation of future profits for set off with reasonable or virtual certainty, as applicable, deferred tax assets pertaining to business loss are recognised. Deferred tax assets and liabilities are offset when legal right exist. The resultant net balances are reported, as appropriate.
or settlement of a defined benefit plan as and when the curtailment or settlement occurs.
ii)
iii)
iv)
Other Employee Benefits: Other employee benefits are ed for on accrual basis. Liabilities for compensated absences are determined based on independent actuarial valuation at year end and charge is recognised in the statement of profit and loss. Short Term Employee Benefits are recognised on an undiscounted basis whereas Long Term Employee Benefits are recognised on a discounted basis. Employee Termination Benefits: Payments to employees on termination along with additional liabilities towards retirement benefits arising pursuant to the termination are charged to the statement of profit and loss in the year in which it is incurred.
p) Financial Instruments
Foreign currency forward contracts, interest rate swaps and options relating to commodities and foreign currencies are used to hedge associated risk relating to certain firm commitments and forecasted transactions. The Group designates these hedging instruments as cash flow hedges.
Hedging instruments are initially measured at fair value and are re-measured at subsequent reporting dates. Gain or loss on of change in the fair value of hedging instrument in respect of effective portion of the cash flow hedges are recognised in the hedging reserve . On occurrence of the underlying transactions the accumulated balance is transferred from hedging reserve and recognised in the statement of profit and loss. The portion of the gain or loss on the hedging instruments if determined to be an ineffective cash flow hedge is recognised in the statement of profit and loss. Fair value hedges are marked to market on the balance sheet date and gain or loss recognised in the statement of profit and loss.
Cash and Cash Equivalent
With regard to overseas subsidiaries and associates, liabilities for retirement benefits are determined as per the regulations and principles followed in the respective countries. Defined benefit obligation of overseas subsidiaries ed for in the reserves in its financial statements, in compliance with the local generally accepted ing principles, are recognised in Group’s Reserve and Surplus (Refer Note 48(c).
n) Research and Development
q)
Research and Development expenditure of revenue nature is charged to revenue and capital expenditure is treated as fixed assets.
Taxes on Income
Current Income Tax is measured at the amount expected to be paid to the tax authorities in accordance with local laws of various jurisdiction where the Group operates.
Deferred tax is recognized on all timing differences to the extent that it is probable that a liability or asset will crystallize in accordance with local practices of various jurisdictions where the Group operates. As at the balance sheet date, unless there is evidence to the contrary, based on
o)
184
Cash and Cash equivalents for the purpose of cash flow statement comprise of cash at bank and in hand and short term investments with an original maturity of three months or less.
r)
Provision Provisions are recognised when there is a present obligation as a result of past event and it is probable that an outflow of resources embodying economic benefits will be required to settle the obligation and a reliable estimate can be made of the amount of the obligation. Provisions are measured at the best estimate of the expenditure required to settle the obligation at the reporting date and are not discounted to its present value. These estimates are reviewed at each reporting date and adjusted to reflect the current best estimates.
Corporate Overview 01-48
Statutory Reports 49-124
Financial Statements 125-220
Notes to Consolidated Financial Statements
s)
Contingent Liabilities Contingent liabilities exist when there is a possible obligation arising from past events, the existence of which will be confirmed only by the occurrence or non occurrence of one or more uncertain future events not wholly within the control of the Group,
or a present obligation that arises from past events where it is either not probable that an outflow of resources will be required or the amount cannot be reliably estimated. Contingent liabilities are appropriately disclosed unless the possibility of an outflow of resources embodying economic benefits is remote.
2016
Rs in Crores 2015
110.00
75.00
63.11 63.11
61.84 61.84
2016
2015
No of shares
No of shares
% of holding
% of holding
142854570
142854570
22.63%
23.10%
54416998
31213954
8.62%
5.05%
43175140
43175140
6.84%
6.98%
2016
2015
618398570
618398570
12731159
-
631129729
618398570
4. Share Capital AUTHORISED 1100000000 (750000000) Equity Shares of Re.1 each* ISSUED, SUBSCRIBED AND PAID-UP 631129729 (618398570) Equity Shares of Re.1 each, fully paid-up a) Details of Shareholders holding more than 5% shares as at March 31, 2016 is set out as below : Particulars
Name of Share holder
Tata Sons Limited
Life Insurance Corporation of India Tata Chemicals Limited
b) Reconciliation of the number of shares as at March 31, 2016 is set out below : Particulars
Number of shares as at the beginning of the year
Add: Shares issued during the year *
Number of shares as at the end of the year
c) Rights, preferences and restrictions of equity shares :
The Holding Company has one class of equity shares having a par value of Re 1 each. Each shareholder is eligible for one vote per share held. The dividend proposed by the Board of Directors is subject to the approval of the shareholders in the ensuing Annual General Meeting, except in case of interim dividend. In the event of liquidation, the equity shareholders are eligible to receive the remaining assets of the Holding Company after distribution of all preferential amounts, in proportion to their shareholding.
*Consequent to and as part of the amalgamation of the esrtwhile Mount Everest Mineral Water Limited with the Holding Company ,the Authorised Share Capital of the Holding Company stand increased to Rs 110 Crores made up of 1100000000 Equity Shares of Re. 1/- each with effect from May 18, 2015 (effective date of amalgamation). Pursuant to this amalgamation, the Holding Company during the year has issued 12731159 equity shares which was ed under Shares Suspense in the previous year (Refer Note 2b(iv). 185
Annual Report 2015-16
•
Connect with every sip
Notes to Consolidated Financial Statements
Rs in Crores 2016
2015
15.79
0.09
5. Reserves and Surplus Capital Reserves Opening Balance Add: Addition on amalgamation (Refer Note 2b(iv) Closing Balance Capital Redemption Reserve
-
15.70
15.79
15.79
0.10
0.10
333.79
552.93
-
(219.14)
333.79
333.79
81.25
81.25
Securities Opening Balance Less: Deduction on amalgamation (Refer Note 2b(iv) Closing Balance Debenture Redemption Reserve Revaluation Reserve 41.23
42.07
Add: Other Adjustments
-
1.83
Less: Amount transferred to Statement of Profit and Loss
-
(2.67)
Opening Balance
41.23
41.23
Contingency Reserve
Closing Balance
1.00
1.00
Amalgamation Reserves
8.33
8.33
Foreign Currency Translation Reserve Opening Balance
678.88
926.35
Add: Movements during the year (net)
129.17
(236.63)
-
(10.84)
808.05
678.88
22.89
(9.79)
Less: Amount transferred to Statement of Profit and Loss * Closing Balance Hedging Reserve Opening Balance Add/(Less): Movement during the year (net) Closing Balance
(26.35)
32.68
(3.46)
22.89
(135.19)
(92.54)
(37.77)
(42.65)
(172.96)
(135.19)
1051.06
1001.57
67.35
49.49
1118.41
1051.06
Actuarial Gain/(Loss) Reserve Opening Balance Add/(Less): Movement during the year (net) Closing Balance General Reserves Opening Balance Add: Transferred from Surplus Closing Balance * Repesents reversal on disposal of an overseas associate
186
Corporate Overview 01-48
Financial Statements 125-220
Statutory Reports 49-124
Notes to Consolidated Financial Statements
Rs in Crores 2016
2015
3330.55
3275.64
325.91
247.82
Surplus in the Statement of Profit and Loss Opening Balance Add: Profit for the year Add: Adjustment on Amalgamation (Refer Note 2b(iv) Amount available for appropriation
-
20.64
3656.46
3544.10
Less : Appropriation (142.00)
(142.00)
Provision for Dividend Distribution Tax
(22.83)
(21.24)
Transfer to General Reserve
(67.35)
(49.49)
Proposed Dividend
-
(0.82)
Net Surplus in the Statement of Profit and Loss
3424.28
3330.55
Total Reserve and Surplus
5655.81
5429.68
Adjustment on evaluation of useful life of Fixed Assets
Rs in Crores 2016
2015
6. Long Term Borrowings Secured (unless otherwise stated) Debentures 3250, 3% Non-convertible, privately placed, Debentures of Rs10 Lakhs each. (Refer Note a) Less : Maturing within the next 12 months
325.00
325.00
(325.00)
-
325.00
Loan From Banks Term Loan (Refer Note b)
19.78
34.66
Less : Maturing within the next 12 months
(9.01)
(11.18) 10.77
External Commercial Borrowing (Refer Note c) Less : Maturing within the next 12 months
23.48
20.71
35.16
(16.57)
(15.63) 4.14
19.53
Senior Debt (Refer Note d)
523.74
547.18
Less : Maturing within the next 12 months
(33.12)
(31.25) 490.62
Total Long Term Borrowings Total Long Term Borrowings (Gross) Less: Total Maturing within the next 12 months
515.93
505.53
883.94
889.23
942.00
(383.70)
(58.06) 505.53
883.94
187
Annual Report 2015-16
•
Connect with every sip
Notes to Consolidated Financial Statements a.
Redeemable at of Rs.223205 per debenture on October 22, 2016, at the end of 3 years from the date of allotment October 22, 2013. Secured by way of a first mortgage on certain immovable assets and partly by pledge of shares of certain companies held as investments by the Holding Company.
b.
Debt amounting to Rs 3.62 Crores (Rs 10.68 Crores) is repayable in quarterly installments, last installment due in September 2016, secured by way of mortgage of certain immovable and movable properties of an overseas subsidiary and guarantee given by the Holding Company. Debts amounting to Rs 16.16 Crores (Rs 23.98 Crores) is repayable in equal installments and is secured by way of mortgage on certain immovable property of an overseas subsidiary.
c.
Repayable in sixteen equal quarterly installments commencing from September 3, 2013.The borrowing is secured by deposit of title deeds of a immovable property and a charge over the machinery of an expansion project of an Indian subsidiary.
d.
Debt is repayable within March 28, 2018 and is secured over assets of certain overseas subsidiaries. Rs in Crores 2016
2015
195.68
178.22
7. Deferred Tax Liabilities (net) Deferred Tax Liability Depreciation Others
2.66
1.29
198.34
179.51
Deferred Tax Asset
Provision for Doubtful Debts/Advances
0.25
1.22
Employee Benefits
4.66
4.73
13.62
17.14
Others Net Deferred Tax Liabilities
18.53
23.09
179.81
156.42 Rs in Crores
2016
2015
-
72.54
2.89
3.02
8. Other Long Term Liabilities payable on Redemption of Debentures Deposits Others
3.20
4.02
6.09
79.58 Rs in Crores
2016
2015
260.28
224.99
260.28
224.99
9. Long Term Provisions Employee Benefits
188
Corporate Overview 01-48
Statutory Reports 49-124
Financial Statements 125-220
Notes to Consolidated Financial Statements
Rs in Crores 2016
2015
248.07
289.79
10. Short Term Borrowings From Banks Secured Working Capital Facilities (Refer below) Unsecured Working Capital Facilities
45.00
92.24
293.07
382.03
Secured by way of hypothecation of inventories, book debts of the holding company. For an Indian subsidiary, working capital facility is secured by hypothecation of coffee crop, stocks and receivables, whilst a part of the working capital facilities is also secured by deposit of title deeds of a coffee estate. For overseas subsidiaries working capital facilities are secured by specific security over certain assets and in an instance by a guarantee given by the Holding Company. Rs in Crores 2016
2015
383.70
58.05
11. Other Current Liabilties Current Maturities of Long Term Borrowings (Refer Note 6)
38.03
35.74
Unpaid Dividends*
8.16
7.71
Interest Accrued but not due
5.02
5.53
Security Deposits from Customers
payable on Redemption of Debentures Other Payables
72.54
-
233.82
280.29
741.27
387.32
* There are no amounts due to and ourstanding to be credited to the Investor Education and Protection Fund. Rs in Crores 2016
2015
Employee Benefits
53.35
52.18
Taxation less advance payment
15.17
19.97
142.00
142.00
Tax on Dividend [Net of Rs 13.42 Crores (Rs 13.42 Crores)]
21.24
21.24
Other Provisions (Refer Note 37)
42.10
33.79
273.86
269.18
12. Short Term Provisions
Proposed Dividend
189
Annual Report 2015-16
•
Connect with every sip
Notes to Consolidated Financial Statements 13. Fixed Assets
Rs in Crores Cost
Depreciation/Amortisation
As at Additions Deductions/ Translation March 31 Adjustment Exchange 2015 difference
As at March 31 2016
As at March 31 2015
Net Book Value
Depreciation/ Deductions/ Translation Amortisation Adjustment/ Exchange for the year Impairment difference
As at March 31 2016
As at March 31 2016
TANGIBLE Land (including Development)
60.09
0.15
(0.52)
0.30
60.02*
0.97
0.13
-
0.02
1.12
58.90
Previous Year
60.11
0.03
-
(0.05)
60.09
0.81
0.13
-
0.03
0.97
59.12
Tea / Coffee Estate Land / Fuel Area (including Development)
7.56
-
-
-
7.56
-
-
-
-
-
7.56
7.56
-
-
-
-
-
7.56
251.16
13.81
(2.19)
5.41
268.19
92.82
9.69
(8.74)
2.14
95.91
172.28
Previous Year Buildings
Previous Year
7.56 237.81
16.42
(0.10)
(2.97)
251.16
81.03
9.66
3.34
(1.21)
92.82
158.34
Bridges
0.16
-
-
-
0.16
0.02
-
-
-
0.02
0.14
Previous Year
0.16
-
-
-
0.16
0.02
-
-
-
0.02
0.14
1365.91
123.54
(48.93)
27.65
1468.17
938.89
69.29
(55.47)
23.80
976.51
491.66
Previous Year
1313.43
121.11
(16.14)
(52.49)
1365.91
896.15
62.99
24.01
(44.26)
938.89
427.02
Furniture and Fixtures
283.29
25.41
(16.48)
6.32
298.54
170.36
28.24
(13.84)
4.63
189.39
109.15
Plant and Machinery
Previous Year
254.63
46.77
(3.54)
(14.57)
283.29
152.65
27.38
1.01
(10.68)
170.36
112.93
Office Equipment
9.12
0.55
(1.17)
0.24
8.74
6.26
0.53
(0.48)
0.17
6.48
2.26
Previous Year
7.12
2.06
(0.13)
0.07
9.12
4.65
0.80
0.75
0.06
6.26
2.86
27.05
2.49
(5.97)
0.17
23.74
15.21
2.16
(6.62)
0.15
10.90
12.84
Motor Vehicles
Previous Year
26.21
5.98
(3.61)
(1.53)
27.05
14.75
2.96
(1.50)
(1.00)
15.21
11.84
2004.34
165.95
(75.26)
40.09
2135.12
1224.53
110.04
(85.15)
30.91
1280.33
854.79
1907.03
192.37
(23.52)
(71.54)
2004.34
1150.06
103.92
27.61
(57.06)
1224.53
779.81
Intangibles ^
312.14
-
-
19.07
331.21
102.23
13.56
43.53 &
Previous Year
305.24
-
-
6.90
312.14
87.08
12.89
-
2.26
102.23
209.91
Capitalised Software
70.91
6.36
-
1.90
79.17
31.71
11.05
-
0.23
42.99
36.18
Previous Year
39.96
29.80
(0.01)
1.16
70.91
23.27
11.12
-
(2.68)
31.71
39.20
Non Compete Fee
3.00
-
-
-
3.00
2.35
0.30
-
-
2.65
0.35
Previous Year
3.00
-
-
-
3.00
2.05
0.30
-
-
2.35
0.65
386.05
6.36
-
20.97
413.38
136.29
24.91
43.53
6.15
210.88
202.50
348.20
29.80
(0.01)
8.06
386.05
112.40
24.31
-
(0.42)
136.29
249.76
4026.97
-
-
140.02
4166.99
134.85
5.74
375.20
3791.79
Total Tangibles
Previous Year INTANGIBLE
Total Intangibles
Previous Year Goodwill on Consolidation
Previous Year Total
Previous Year
7.98 $
226.63 &
5.92
165.24 @
165.97
4243.07
77.38
(203.51)
(89.97)
4026.97
54.82
7.54
70.54
1.95
134.85
3892.12
6417.36
172.31
(75.26)
201.08
6715.49
1495.67
142.93
185.01
42.80
1866.41
4849.08
6498.30
299.55
(227.04)
(153.45)
6417.36
1317.28
135.77
98.15
(55.53)
1495.67
4921.69
Notes: 1.
(*) Includes leasehold land of Rs. 2.02 Crores (Rs. 2.02 Crores) belonging to two Indian subsidiaries and also includes a portion of land leased to an Associate.
2.
Cost of Buildings include Rs. 5.90 Crores (Rs. 5.90 Crores) represented by shares in Co-operative Housing Societies / a Company.
3.
($) Represents amortisation of certain intangible assets included as goodwill under India GAAP by an overseas subsidiary.
4.
(@) Unexpired period of amortisation for certain intangibles 184 months and 71 months.
5.
(^) Includes Trademark, Brands and Patents/Knowhow.
6.
(&) Adjustment in Goodwill and Intangibles includes impairment charge of Rs 226.64 Crores and Rs 43.53 Crores respectively (Refer Note 40).
7.
During the year, an Indian subsidiary of the Holding Company has revised its policy of providing depreciation on fixed assets with effect from April 1, 2015. Depreciation is now provided on a straight line basis for all assets as against the policy of providing on written down value basis for certain assets and straight line basis for others. As prescribed by Para 21 of ing Standard 6 - ‘Depreciation ing’, depreciation has been recomputed from the date the asset came into use. The adoption of new policy resulted in depreciation for the year 2015-16 being lower by Rs 2.61 Crores and the write back of depreciation amounting to Rs. 16.97 Crores relating to earlier years. In the previous year, the gross block and accumulated depreciation of assets under written down value method amounted to Rs 143.20 Crores and Rs 53.63 Crores respectively.
190
Corporate Overview 01-48
Financial Statements 125-220
Statutory Reports 49-124
Notes to Consolidated Financial Statements
Face Value of each
Nos
2016
Rs in Crores 2015
54.57 -
54.57 2.72
-
0.47
-
0.10
2.34
2.36
-
0.17
-
2.95
0.07 56.98
0.07 63.41
14. Non - Current Investments TRADE INVESTMENT (fully paid and valued at cost) (a) Quoted Equity Investments Tata Chemicals Ltd. (Refer Note (a)) The Indian Hotels Co Ltd. (Refer Note (e))
Rs. Re.
10 1
Tata Motors Ltd. (Refer Note (e))
Rs.
2
Tata Motors Ltd. - 'A' Ordinary Shares (Refer Note (e))
Rs.
2
Tata Investment Corporation Ltd. (Refer Note (e))
Rs.
10
Tata Steel Ltd. (Refer Note (e))
Rs.
10
Titan Industries Ltd. (Refer Note (e))
Re.
1
Joonktolle Tea & Industries Ltd.
Rs.
10
11345522 (1687742) (116665) (16665) 158469 (160000) (12021) (9248060) 12602
Rs.
10
61024400
61.02
61.02
LKR
10
12078406
14.57
14.57
Rs.
10
3976563
12.33
12.33
Rs.
10
11748148
11.75
11.75
99.67
99.67
9.75 0.95 0.05 115.82 29.29 0.01 0.01 0.07 0.00 0.00
9.75 0.95 0.05 115.82 28.50 0.01 0.01 0.07 -
155.96
155.16
(b) Unquoted Equity Investments Investment in Associates (Refer Note (f ) below) Amalgamated Plantations Pvt. Ltd. [Cumulative Group share of profits /(losses) - Rs 69.31 Crores (Rs 79.31 Crores)] Estate Management Services Pvt. Ltd. [Cumulative Group share of profits /(losses) - Rs 15.69 Crores (Rs 9.77 Crores)] Kanan Devan Hills Plantations Company Pvt. Ltd. [Cumulative Group share of profits /(losses) - (Rs 1.62 Crores) (Rs 4.05 Crores)] TRIL Constructions Limited [Cumulative Group share of profits /(losses) - (Rs 0.62 Crores) ((Rs 0.56 Crores))] Others Tata Sons Ltd. Tata Capital Ltd. Tata Services Ltd. Tata Industries Ltd. Taj Air Ltd. Chembra Peak Estates Ltd. Wartyhully Estates Ltd. Southern Scribe Instruments Pvt. Ltd. # Armstrong Power Private Limited # (Refer Note (d)) Armstrong Power Systems Private Limited # (Refer Note (d)) # relatings to power purchase agreement entered by an Indian subsidiary
Rs. Rs. Rs. Rs. Rs. Rs. Rs. Rs. Rs. Rs.
1000 10 1000 100 10 10 10 100 100 100
1755 613598 475 6519441 22200000 3481 24748 7280 375 460
191
Annual Report 2015-16
•
Connect with every sip
Notes to Consolidated Financial Statements
Face Value of each (c) Unquoted Preference Shares Investment in Associates Amalgamated Plantations Pvt. Ltd. 0.01% Non Cum Redeemable Preference Shares (Redeemable with special redemption within 7 - 9 years from issue date and extension is being considered in line with the agreements) TRIL Constructions Limited 0.001% Non Cumulative Non redeemable, mandatorily and fully convertible Preference Shares (Redeemable within 6 years from issue date ) (d) Quoted Debentures The Indian Hotels Co Ltd. Compulsory Convertible Debenture
Nos
2016
Rs in Crores 2015
Rs.
10
67000000
67.00
67.00
Rs.
10
66751852
66.75
66.75
133.75
133.75
-
2.09
-
2.09
Rs.
55
(379741)
OTHERS INVESTMENT (fully paid and valued at cost) (a) Quoted Equity Investments SBI Home Finance Ltd. (Refer Note (c)) Industrial Development Bank of India
Rs. Rs.
10 10
100000 16160
0.13 0.13
0.13 0.13
Rs. Rs. Rs. Rs.
100 10 10 10
2092 20000 200000 350
0.02 0.20 -
0.02 0.20 -
(b) Unquoted Equity Investments The Annamallais Ropeways Company Ltd. - Ordinary Shares (Refer Note (c)) ABC Tea Workers Welfare Services - Ordinary Shares Assam Hospitals Ltd. The Valparai Co-operative Wholesale Stores Ltd. - Ordinary Shares (Refer Note (c)) Suryakiran Apartment Services Pvt. Ltd. (Refer Note (d)) Jalpaiguri Club Ltd.- Ordinary Shares (Cost Re 1) GNRC Ltd. IFCI Venture Capital Funds Ltd. Ritspin Synthetics Ltd. (Refer Note (c)) Coorg Orange Growers Co-operative Society Ltd. Tata Coffee Co-operative Stores Limited Coorg Cardamom Co-operative Marketing Society Ltd. TEASERVE (Refer Note (d)) (The Tamil Nadu Tea Manufacturers' Service Industrial Co-op Society Ltd.) Woodlands Hospital & Medical Res. Centre Ltd. - Equity Shares
Rs. Rs. Rs. Rs. Rs. Rs. Rs. Rs. Rs.
10 10 10 10 10 100 5 100 5000
2146 60 50000 250000 200000 4 20 1 1
0.00 0.05 0.25 0.00
0.00 0.05 0.25 0.00
Rs.
10
12280
0.00 0.53
0.00 0.53
(c) Unquoted Preference Shares Thakurbari Club Ltd. (Cost Re 1)
Rs.
100
26
-
-
192
Corporate Overview 01-48
Financial Statements 125-220
Statutory Reports 49-124
Notes to Consolidated Financial Statements
Face Value of each
Nos
(d) Unquoted Government Securities: W.B. Estates Acquisition Compensation Bond (Refer Note (d)) (e) Unquoted Debentures The Bengal Chamber of Commerce & Industry - 6 1/2% Debentures (Refer Note (d)) Shillong Club Ltd. - 5% Debentures - (Cost Rs 2)
0.00 0.00
0.00 0.00
1000
7
0.00
0.00
Rs.
100
31
0.00
0.00
70.80 70.80 517.81 82.76
70.45 70.45 525.19 92.57
600.57
617.76
57.11 472.66 70.80 600.57 431.22
65.63 481.68 70.45 617.76 903.97
Total
Total of Investments Quoted Unquoted Investment Properties Aggregate Amount Market value of quoted investments
Rs in Crores 2015
Rs.
INVESTMENT PROPERTIES Commercial Property Net appreciation in investments in associates under equity method (Refer Note (f ))
2016
Notes : (a) (b) (c) (d) (e) (f )
3723648 shares of Tata Chemicals Ltd. is pledged against outstanding 3% Non Convertible privately placed Debentures. Cost of investments in Amalgamated Plantations Pvt. Ltd. and Kanan Devan Hills Plantations Co. Pvt. Ltd. includes capital reserve of Rs 15.60 Crores and Rs 11.80 Crores respectively. Fully provided (Original Cost Rs 0.32 Crores). Investment costs are below Rs 0.01 Crores. During the year, the Holding Company has sold some of its investments and the resultant profit has been ed under exceptional item (Refer Note 32). Includes the following adjustments on of Associate Companies:
Pre-acquisition share of profit / (loss) Post acquisition profit Current year profit / (loss) Dividend received
2016 (1.52) 122.72 (1.41) (37.03) 82.76
Rs in Crores 2015 (1.52) 133.60 (10.88) (28.63) 92.57
193
Annual Report 2015-16
•
Connect with every sip
Notes to Consolidated Financial Statements
Rs in Crores 2016
2015
15. Deferred Tax Assets (net) Deferred Tax Asset
Provision for Doubtful Debts/Advances
Employee Benefits
on redemption of Debentures
3.12
2.51
39.20
35.28
4.44
12.81
11.42
18.32
58.18
68.92
Depreciation
15.90
14.67
15.90
14.67
Net Deferred Tax Assets
42.28
54.25
Others Deferred Tax Liability
Rs in Crores 2016
2015
57.13
102.11
2.12
2.13
17.96
12.39
16. Long Term Loans and Advances (unsecured and considered good unless otherwise stated) Inter Corporate Loans - Secured Capital Advances Deposits Security Deposit
Considered Good
Considered Doubtful
Less: Provision for Doubtful Deposits
37.18
37.60
0.28
0.28
37.46
37.88
(0.28)
(0.28) 37.18
37.60
Other Advances
Considered Good
Considered Doubtful
Less: Provision for Doubtful Advances
15.97
15.23
0.07
0.12
16.04
15.35
(0.07)
(0.12) 15.97
15.23
Advance Tax [net of provisions of Rs 1406.99 Crores (Rs 1315.96 Crores)]
31.22
19.86
MAT Credit Entitlement
39.00
-
Advance for purchase of shares in a subsidiary
39.82
-
240.40
189.32
194
Corporate Overview 01-48
Financial Statements 125-220
Statutory Reports 49-124
Notes to Consolidated Financial Statements
Rs in Crores 2016
2015
70.50
70.50
70.50
70.50
17. Other Non current Assets Property rights pending development
Rs in Crores Face Value of each
Nos
2016
2015
-
18. Current Investments (At lower of cost and fair value) Unquoted Mutual Fund Tata Liquid Fund
Rs. 1000
17590.5
4.90
JM Financial Mutual Fund
Rs. 10
900768
3.69
-
ICICI Prudential Liquid - Units of Regular Plan - Growth
Rs. 100
-
-
1.42
-
1.89
-
0.06
-
0.89
Total Current Investments
8.59
4.26
Net fair value of investment in Mutual Fund
8.63
4.43
(72313.5) Kotak Floater Short Term - Units of Regular Plan - Growth
Rs. 1000
(8657.5)
Sundaram Money Fund - Units of Regular Plan - Growth
Rs. 10
HSBC Ultra Short Term Fund - Weekly Dividend
Rs. 10
(21554.5) (887448)
Rs in Crores 2016
2015
19. Inventories (At lower of cost and net realisable value) 84.03
89.01
Raw Material*
982.42
866.64
Finished Goods**
647.20
656.73
6.60
4.37
Stores, Spare Parts and Packing Materials
Stock in Trade Work in Progress
7.86
8.55
1728.11
1625.30
*includes intransit of Rs. 13.79 Crores (Rs. 19.41 Crores) **includes intransit of Rs. 6.54 Crores (Rs. 5.61 Crores)
195
Annual Report 2015-16
•
Connect with every sip
Notes to Consolidated Financial Statements
Rs in Crores 2016
2015
20. Trade Receivables Receivables outstanding for a period exceeding six months from due date
Considered Good
Doubtful
Less : Provision for Doubtful Debts
2.51
1.69
6.98
8.11
9.49
9.80
(6.98)
(8.11) 2.51
1.69
Other Receivables
Considered Good*
Doubtful
Less : Provision for Doubtful Debts
629.57
614.40
0.85
0.62
630.42
615.02
(0.85)
(0.62) 629.57
614.40
632.08
616.09
*Other Receivable includes secured receivable of Rs. 20.79 Crores (Rs. 20.04 Crores) Rs in Crores 2016
2015
21. Cash and Bank Balances Cash and Cash Equivalents
Cash/Cheques in hand
Others - Investment in Mutual Fund
0.62
0.66
173.33
10.83
Balances with Bank Current *
Deposit ^
81.24
73.63
275.58
451.41 530.77
536.53
Other Bank Balances
Unclaimed Dividend
8.16
7.71 8.16
7.71
538.93
544.24
* Includes remittance in transit - Rs 14.78 Crores (Nil). ^ The cash held in bank deposits includes Nil (Rs 0.62 Crores) of restricted cash which may only be used to service the external debt.
196
Corporate Overview 01-48
Statutory Reports 49-124
Financial Statements 125-220
Notes to Consolidated Financial Statements
Rs in Crores 2016
2015
601.69
579.75
22. Short Term Loans and Advances (unsecured and considered good unless otherwise stated) Inter Corporate Loans (including secured loan amounting to Rs. 170.37 Crores (Rs. 165.24 Crores)) Deposits
Considered Good
5.63
5.00
Considered Doubtful
0.38
0.38
6.01
5.38
(0.38)
(0.38)
Less : Provision for Doubtful Deposits
5.63
5.00
Other Advances
Considered Good
Considered Doubtful
Less : Provision for Doubtful Advances
152.41
165.05
2.67
2.67
155.08
167.72
(2.67)
(2.67) 152.41
165.05
Prepaid Expenses
43.16
32.09
Advance Tax
16.28
9.70
819.17
791.59 Rs in Crores 2016
2015
23. Other Current Assets Interest Accrued
14.10
3.62
Export Incentive receivable
18.42
14.79
Others receivables
11.62
11.25
44.14
29.66
197
Annual Report 2015-16
•
Connect with every sip
Notes to Consolidated Financial Statements
Rs in Crores 2016
2015
Sale of Products
7979.23
7827.17
Sale of Services
9.66
6.05
24. Revenue from Operations
Other Operating Revenues
Miscellaneous Receipts
32.47
34.07
Liabilities no longer required written back
20.69
50.43
Provision for debts and advances written back
0.07
0.04
Royalty Income
48.08
49.21
Export Incentive
27.50
26.97
Less: Excise Duty
128.81
160.72
8117.70
7993.94
(7.19)
(0.55)
8110.51
7993.39 Rs in Crores
2016
2015
43.52
52.02
25. Other Income Interest Income - on advances and deposits Dividend income
Long-term Investments
Current Investments
21.13
15.07
1.30
0.62 22.43
15.69
Profit on sale of Current Investments (net)
1.32
0.75
Profit on sale of Fixed Asset (net)
2.18
-
Rent Income
0.93
1.02
Other non operating income
0.22
0.50
70.60
69.98 Rs in Crores
2016
2015
26. Cost of Materials Consumed Raw Materials Consumed 2459.51
2459.48
Coffee
630.83
668.69
Others
34.01
Tea
24.41 3124.35
Consumption of Packing Materials
198
3152.58
480.65
472.54
3605.00
3625.12
Corporate Overview 01-48
Statutory Reports 49-124
Financial Statements 125-220
Notes to Consolidated Financial Statements
Rs in Crores 2016
2015
171.98
156.50
Coffee
89.59
48.20
Others
68.97
58.77
330.54
263.47
27. Purchase of Stock in Trade Tea
Rs in Crores 2016
2015
28. Changes in Inventories of Finished Goods/Work in progress/ Stock in Trade Stock as at 1st April 656.73
606.05
Stock-in-Trade
4.37
3.58
Work-in-Progress
8.55
Finished Goods
8.77 669.65
618.40
Stock as at 31st March 647.20
656.73
Stock-in-Trade
6.60
4.37
Work-in-Progress
7.86
8.55
Finished Goods
Less: Partial diminution in the value of Inventory ed in Exceptional Items (Refer Note 32)
29. Employee Benefits Expense Salaries, Wages and Bonus (Refer Note 39) Contribution to Provident Fund and other Funds Workmen and Staff Welfare Expenses
30. Finance Costs Interest Expense Other Borrowing Cost Exchange loss (net)
661.66
669.65
7.99
(51.25)
18.12
-
(10.13)
(51.25)
2016
Rs in Crores 2015
800.78 59.94 41.29 902.01
775.89 53.86 27.92 857.67
2016
Rs in Crores 2015
64.21 0.96 3.60 68.77
77.90 0.92 3.04 81.86 199
Annual Report 2015-16
•
Connect with every sip
Notes to Consolidated Financial Statements
31. Other Expenses Manufacturing and Contract Packing Expenses Consumption of Stores and Spare Parts Power and Fuel Repairs to Plant and Machinery Repairs to Buildings General Repairs Rent Rates and Taxes ment and Sale Charges Commission on Sales Freight Insurance Legal and Professional Expenses Miscellaneous Expenses* (Refer Note 39) Provision for Doubtful Debts and Advances Debts and Advances written off (net) Loss on sale of fixed assets
2016
Rs in Crores 2015
130.25 50.14 81.43 27.20 17.02 22.82 108.97 20.51 1368.77 116.27 187.18 28.10 126.88 314.91 2.39 5.59 2608.43
111.39 47.52 84.78 23.03 15.21 21.52 96.94 18.78 1325.57 137.63 199.94 24.82 115.67 298.96 0.34 0.42 1.01 2523.53
*Includes Exchange gain - Rs. 6.36 Crores (Rs. 9.77 Crores) Rs in Crores 2015
2016 32. Exceptional Items Income Profit on sale of Non-Core Investments Write back on Change in ing Policy [Refer Note 13] Exchange Gain
327.79 16.97 -
0.87 344.76
Expenditure Impairment of Intangible / Other Assets* Re-organisation/Business Restructure costs Disposal of an Associate Acquisition related Expenditure Provision for retrospective amendment of legislation relating to employee benefits Levy relating to past demerged business Others **
(288.28) (18.48) (13.07) (5.13)
0.87 (95.38) (17.52) (17.96) -
(3.00) (4.92)
(332.88)
(130.86)
11.88
(129.99)
* includes impairment of intangible assets (Refer Note 40) and partial diminution in the value of inventory - Rs 18.12 Crores (Nil). ** includes settlement of legal claims - Rs 2.51 Crores (Nil).
200
Corporate Overview 01-48
Statutory Reports 49-124
Financial Statements 125-220
Notes to Consolidated Financial Statements
33. Estimated amount of contracts remaining to be executed on capital and not provided for as at March 31, 2016 aggregated Rs 12.45 Crores (Rs 10.83 Crores).
34. Contingent Liabilities not provided for in respect of :
a)
Claims under adjudication not acknowledged as debts:
Rs in Crores Particulars
2016
2015
i
Taxes, Statutory Duties/ Levies etc
53.33
35.88
ii
Commercial and other Claims
9.27
11.41
b)
Labour disputes under adjudication relating to some staff – amount not ascertainable for holding company and Rs 0.90 Crores (Rs 0.80 Crores) for an Indian subsidiary.
c)
In the case of overseas subsidiaries there are contingent liabilities in respect of outstanding letters of credit and financing arrangements of t ventures. All of these arrangements have been undertaken in the normal course of trade and are centrally managed by the central treasury team of the overseas subsidiary. Because the value of many of these liabilities is dependent on future events, the directors believe that it is not practically possible to provide an estimate of the Group’s potential liability under such arrangements.
d)
Bank and other guarantees - Rs 9.73 Crores (Rs 9.23 Crores).
35. Litigations
i)
Stamp duty claim yet to be reassessed – amount not ascertainable
ii)
Product / commercial liability claims not established – amounts not ascertainable
iii)
Holding Company’s overseas subsidiary in US alongwith several other coffee companies that roast, package, market and/ or sell coffee in the State of California are defendants in a public interest litigation filed by an organisation named Council of Education and Research on Toxics (CERT). The litigation contends that since coffee contains the chemical acrylamide, warning have to be included for coffee sold in that state pursuant to California state law. Acrylamide is not added to coffee but forms in trace amounts as part of a chemical reaction that occurs in coffee beans when it is roasted. The subsidiary is part of a t Defense Group that is arguing the case on behalf of several leading coffee companies as defendants. The outcome and potential liability, if any, to the subsidiary on of their sales in the state of California is not determinable at present.
36. Research & Development Expenditure: Rs in Crores Particulars
2016
2015
Capital
0.71
0.34
Revenue
9.59
8.59
10.30
8.93
Total
201
Annual Report 2015-16
•
Connect with every sip
Notes to Consolidated Financial Statements
37. Details of provision: Rs in Crores Particulars
Reorganisation Cost
#
Others
&
2016
2015
2016
2015
20.69
27.90
13.09
6.92
9.96
11.47
6.03
6.94
Amount paid / adjusted during the year
(7.67)
(18.68)
-
(0.77)
Closing Balance
22.98
20.69
19.12
13.09
Opening Balance Provision made during the year
#
relates to restructure costs and is expected to be paid in near future .
&
relates to provision for trade obligations.
38. The current tax charge is net of credit pertaining to earlier year Rs 20.11 Crores (Rs 53.35 Crores). Prior year included onetime credit arising on amalgamation of Mount Everest Mineral Water Limited with the Holding Company and credit relating to debenture redemption charged to Securities in an earlier year.
39. As per Section 135 of the Companies Act 2013, the amount contributed for Corporate Social Responsibility causes are as follows: Rs in Crores Particulars Employee Benefit Expenses incurred on specific CSR activities
2016
2015
1.51
0.95
Others Expenses - Miscellaneous
6.50
5.50
Total
8.01
6.45
40. During the year, the Group recognized a non-cash impairment loss mainly on goodwill relating to its branded businesses in Eastern Europe and US. While the Company is actively pursuing various growth opportunities, the ing impairment has been recognised due to underperformances as compared to plans mainly arising out of factors like macro-economic instability in Russia and category decline in every day black tea / competitive intensity in other markets. Accordingly, impairment of Rs 157.03 Crores has been recognized in Eastern European markets [Russia (coffee segment), Poland (tea segment) and Czech (tea segment)] wherein the pre-tax discount rate is within the range of 7.1% to 14.9% and Rs 106.13 Crores in the US tea business primarily within the specialty tea segment after applying a pre-tax discount rate of 8.0%. Additionally, an impairment loss of Rs 7.00 Crores has been recognised on Patent/Knowhow (water segment) which arose on of revision in the business plans with lower than expected economic benefits over its estimated useful life. A pre-tax discounting rate of 22.3 % was used for evaluation of value in use.
The impact of impairment has been ed under exceptional items and is disclosed as unallocated items in the segment report.
202
Corporate Overview 01-48
Statutory Reports 49-124
Financial Statements 125-220
Notes to Consolidated Financial Statements
41. Leases Operating Lease
Group’s leasing arrangements are for premises (residential, office, factory, godown and Stores), equipments and vehicles, these ranges between 5 months to 15 years and are usually renewable on mutually agreed .
Disclosure in respect of operating leases: Rs in Crores Particulars
2016
2015
Minimum lease payments under Non-cancellable operating lease 50.70
52.26
128.53
124.27
67.45
24.11
Total
246.68
200.64
Lease payments recognised in the Statement of Profit and Loss
121.39
104.26
Within one year
Later than one year and not later than five years
Later than five years
42. Earning Per Share Rs in Crores Particulars
2016
2015
325.91
247.82
631129729
618398570
-
12731159
631129729
631129729
Basic
5.16
3.93
Diluted
5.16
3.93
Group Net Profit (Rs in Crores) Numbers of Equity Shares Outstanding Add: Equity shares to be issued consequent to amalgamation lying in share suspense Total number of Shares (No.) Earnings Per Share (Rs.)
203
Annual Report 2015-16
•
Connect with every sip
Notes to Consolidated Financial Statements
43. The proportionate share of the assets, liabilities, income and expenditure of the t venture of Holding Company and its subsidiary companies (refer note 2(b) above) are given below: JV’s Balance Sheet as at March 31, 2016 Particulars
Rs in Crores 2016
2015
326.16
275.38
Reserves and Surplus
(165.92)
(133.09)
Shareholders Funds
160.24
142.29
-
(0.73)
Equity and Liabilities Share Capital
Non Current Liabilities: Deferred Tax (net)
-
0.05
Long Term Provisions
1.18
1.03
Total Non Current Liabilities
1.18
0.35
Short Term Borrowings
24.05
34.66
Trade Payables
55.40
54.72
9.94
11.34
Other Long Term Liabilities
Current Liabilities:
Other Current Liabilities
1.19
1.56
90.58
102.28
252.00
244.92
Tangible Assets
75.38
77.83
Intangible assets
4.69
4.38
Capital work in progress
9.98
9.06
Short Term Provisions Total Current Liabilities Total Assets Non-Current Assets Fixed Assets
-
0.01
14.65
12.92
104.70
104.20
8.59
3.37
Inventories
91.16
88.73
Trade Receivables
18.65
18.84
Cash and Bank Balance
10.79
17.93
Short Term Loans and Advances
18.05
11.78
0.06
0.07
Total Current Assets
147.30
140.72
Total
252.00
244.92
Intangible assets under development Long Term Loans and Advances Total Non Current Assets Current Assets Current investments
Other Current Assets
204
Corporate Overview 01-48
Statutory Reports 49-124
Financial Statements 125-220
Notes to Consolidated Financial Statements
JV’s Statement of Profit and Loss for the year ended March 31, 2016 Particulars
Rs in Crores 2016
2015
618.98
560.36
2.57
1.63
621.55
561.99
388.90
366.58
54.87
49.57
1.60
2.53
16.24
11.49
Other Expenses
174.71
161.49
Total Expenses
636.32
591.66
Profit before Exceptional Items and Taxes
(14.77)
(29.67)
-
-
(14.77)
(29.67)
0.88
0.33
(15.65)
(30.00)
Income Revenue from Operations Other Income Total Revenue Expenses Material Cost Employee Benefits Expense Finance Costs Depreciaton and Amortisation Expense
Exceptional Items (net) Profit before tax Tax Expenses Profit after Taxation
205
Annual Report 2015-16
•
Connect with every sip
Notes to Consolidated Financial Statements
44 a.
Consolidated Related Party Disclosure as per ing Standard - 18 Particulars of transactions during the year ended March 31, 2016 Rs in Crores Nature of Transactions
t Ventures Associates
Sale of Goods and Services Other Operating Income Purchase of Goods and Services
Promoter
Key Management Personnel
19.53
0.59
20.12
(23.24)
(0.04)
(23.28)
0.15
-
0.15
(0.16)
(1.09)
(1.25)
74.30
298.43
372.73
(72.44)
(273.97)
(346.41)
Rent Paid
1.84
-
1.84
(1.34)
(0.32)
(1.66) 3.79
3.79
Fees paid for Product Development
(6.91)
(6.91) Other Expenses (Net)
3.25
12.52
15.77
(2.83)
(12.80)
(15.63)
-
Deposits Redeemed
(1.00)
(1.00) Directors Remuneration * Dividend Paid Sale of Investment Reimbursement of Expenditure/(Income) Dividend/Interest Received Balances Outstanding
Debit Credit
206
Total
7.01
7.01
(5.74)
(5.74)
32.14
32.14
(32.14)
(32.14)
312.31
312.31
-
-
(0.75)
3.91
0.41
3.57
((0.62))
(1.17)
((0.01))
(0.54)
-
10.44
4.21
14.65
-
(12.02)
(1.40)
(13.42)
5.05
25.18
-
30.23
(4.28)
(30.08)
-
(34.36)
1.88
6.75
11.70
20.33
(1.57)
(2.14)
(12.02)
(15.73)
* Provision for employee benefits, which are based on actuarial valuation done on an overall basis, is excluded. The above does not include share of recurring/special benefits payables to former Directors.
Corporate Overview 01-48
Statutory Reports 49-124
Financial Statements 125-220
Notes to Consolidated Financial Statements Related Parties Promoter
Key Management Personnel
Tata Sons Ltd.
Mr. Ajoy Misra - CEO & Managing Director Mr. L Krishna Kumar - Executive Director & Group CFO
Associates
t Ventures
Estate Management Services Pvt. Ltd.
NourishCo Beverages Ltd.
Amalgamated Plantations Pvt. Ltd.
Tata Starbucks Pvt. Ltd.
Kanan Devan Hills Plantations Co. Pvt. Ltd. TRIL Constructions Ltd. t Ventures of Subsidiary
Associate of Subsidiary
Tetley ACI (Bangladesh) Ltd.
Bjets Pte. Ltd. Singapore
Empirical Group LLC, USA Southern Tea LLC, USA Tetley Clover Pvt. Ltd., Pakistan
207
Annual Report 2015-16
•
Connect with every sip
Notes to Consolidated Financial Statements
b) Disclosures in respect of transactions in excess of 10% of the total related party transactions of the same type : Rs. in Crores 1
Sale of Goods and Services
Southern Tea LLC. NourishCo Beverages Ltd. Tetley Clover Pvt. Ltd. Tata Starbucks Pvt. Ltd.
2
Other Operating Income
3
Purchase of Goods & Services
Kanan Devan Hills Plantations Co. Pvt. Ltd.
Rent Paid
2.65
10.18
9.81
-
8.60
3.58
-
-
1.09
0.15
0.16 180.29
Kanan Devan Hills Plantations Co. Pvt. Ltd.
91.54
93.68
Southern Tea LLC.
74.03
72.30
Amalgamated Plantations Pvt. Ltd.
-
0.32
Amalgamated Plantations Pvt. Ltd.
1.35
0.85
Kanan Devan Hills Plantations Co. Pvt. Ltd.
0.49
0.49
Tata Sons Ltd.
5
Fees paid for Product Development
NourishCo Beverages Ltd.
6
Other Expenses (Net)
Tata Sons Ltd. Amalgamated Plantations Pvt. Ltd.
208
2015
4.30
206.89
NourishCo Beverages Ltd.
4
2016
3.79
6.91
12.62
12.80
3.25
2.83
7
Dividend Paid
Tata Sons Ltd.
32.14
32.14
8
Sale of Investment
Tata Sons Ltd.
312.31
-
9
Reimbursement of Expenses/ (Income)
Amalgamated Plantations Pvt. Ltd.
3.95
1.14
NourishCo Beverages Ltd.
(0.72)
(0.61)
Tata Starbucks Pvt. Ltd.
(0.04)
(0.01)
Kanan Devan Hills Plantations Co. Pvt. Ltd.
(0.04)
0.03
Tata Sons Ltd.
0.41
(0.01)
10
Deposits Reedeemed
Tata Sons Ltd.
-
1.00
11
Dividend and Interest Received
Amalgamated Plantations Pvt. Ltd.
3.67
3.42
Estate Management Services Pvt. Ltd.
4.34
4.46
Kanan Devan Hills Plantations Co. Pvt. Ltd.
2.44
4.14
Tata Sons Ltd.
4.21
1.40
Corporate Overview 01-48
Financial Statements 125-220
Statutory Reports 49-124
Notes to Consolidated Financial Statements
45. Disclosure requirement for Derivatives Instruments A. The Group uses forward exchange contracts to hedge its exposures in foreign currency. All the derivative contracts entered by the Company were for hedging purposes and not for any speculative purpose.
a)
The outstanding forward exchange contracts of foreign currency are: 2016 Type of Contract
Currency Pair
No of Notional Contract Amount in FCY Mn
2015 No of Notional Contract Amount in FCY Mn
Equivalent Amount in Rs Crores *
Equivalent Amount in Rs Crores *
Forward Contracts Outstanding i) Exports
ii) Payables
GBP / EUR
1
0.74
5.58
2
1.10
7.39
GBP / CAD
16
25.27
129.45
-
-
-
USD / INR
188
28.95
191.79
184
32.30
201.86
AUD / INR
35
6.05
30.83
62
9.20
43.72
EUR / INR
1
0.10
0.64 223.11
GBP / USD
12
20.99
139.06
25
35.70
USD / RUB
34
5.30
35.11
23
4.55
28.44
iii)
Loans given
GBP / USD
7
80.93
536.15
8
93.83
586.37
iv)
Loan to subsidiary
GBP / USD
5
60.67
401.95
6
55.57
347.31
v)
Loan from subsidiary USD / RUB
1
4.35
28.82
vi) Receivables from Subsidiary
GBP / PLN
1
16.00
28.32
1
12.80
21.03
GBP / CZK
1
64.89
18.09
2
160.11
39.11
GBP / AUD
1
13.30
67.78
2
6.10
28.99
GBP / CAD
3
3.73
19.13
1
1.50
7.35
GBP / USD
1
9.63
63.83
1
9.40
58.75
GBP / RUB
1
94.42
9.34
-
-
* converted at the year exchange rates
b)
The foreign currency exposures not hedged as at the year end are as under : 2016 Currency Pair a)
Amounts receivable in foreign currency
Foreign Currency in Mn
2015
Equivalent Foreign Equivalent Amount in Currency Amount in in Mn Rs Crores * Rs Crores *
USD/INR
1.76
11.67
9.57
59.81
USD/RUB
0.07
0.48
2.21
13.80
EUR/INR
0.52
3.93
0.11
0.71
b)
Amounts payable in foreign currency
USD/INR
1.63
10.81
1.88
11.74
c)
Outstanding Loan in Foreign Currency ^
USD/INR
3.13
20.71
14.60
91.22
* converted at the year exchange rates ^ This includes Long Term Borrowing of USD 3.13 mn (PY - USD 5.63 mn)
209
Annual Report 2015-16
•
Connect with every sip
Notes to Consolidated Financial Statements B.
Details of Interest rate swap which the Group has entered into for hedging its interest rate exposure on borrowing: 2016 2015 Details of Borrowings Foreign Equivalent Foreign Equivalent Currency Currency Amount in Currency Amount in in Mn Rs Crores * in Mn Rs Crores * Senior Debts / External Commercial Borrowings ** USD 48.13 318.88 53.13 332.01 * converted at the year exchange rates ** to the extent of swap entered
C.
Outstanding position of various commodity derivatives financial instruments. Commodity
Coffee a) b) Coffee * converted at the year exchange rates
Futures & Options Futures Options
Notional Value in USD Mn 18.19 4.46
2016 2015 Equivalent Notional Equivalent Amount in Value in Amount in Rs Crores * USD Mn Rs Crores * 120.55 9.06 56.64 29.55 14.44 90.26
46. Consolidated Segment Reporting
a) By Business Segments: Rs. in Crores Particulars
Sales Revenue from External Customers Other Operating Revenue Total Segment Revenue Add : Other Income Total Income Segment result Add : Other Income Add : Unallocable (expenditure) net of income Less: Finance Cost
210
Tea
Coffee and Other Produce
Others
Unallocated
Total
7981.70
5870.79
2002.03
108.88
(5824.92)
(1909.78)
(97.97)
-
(7832.67)
60.64
66.22
1.95
-
128.81
(55.32)
(100.55)
(4.85)
-
(160.72)
5931.43
2068.25
110.83
-
8110.51
(5880.24)
(2010.33)
(102.82)
-
(7993.39)
-
-
-
70.60
70.60
(69.98)
(69.98)
5931.43
2068.25
110.83
70.60
8181.11
(5880.24)
(2010.33)
(102.82)
(69.98)
(8063.37)
580.05
214.40
(41.42)
-
753.03
(614.97)
(264.38)
((44.26))
-
(835.09)
-
-
-
70.60
70.60
-
-
-
(69.98)
(69.98)
-
-
-
(221.30)
(221.30)
-
-
-
((193.34))
((193.34))
-
-
-
(68.77)
(68.77)
((81.86))
((81.86))
Corporate Overview 01-48
Financial Statements 125-220
Statutory Reports 49-124
Notes to Consolidated Financial Statements
Rs. in Crores Particulars
Profit before Exceptional Items and Taxes Exceptional Income / (Expenditure) Profit before Tax Provision for Taxation Profit after Taxation before Share of Results of Associates and Minority Interest Share of Results of Associates Profit after Taxation before Minority Interest Segment Assets Investments Unallocated Assets Total Assets Segment Liabilities Unallocated liabilities Total Liabilities Capital Expenditure Depreciation & Amortisation Non Cash Expenditure other than depreciation and amortisation
Tea
Coffee and Other Produce
Others
Unallocated
Total
580.05
214.40
(41.42)
(219.47)
533.56
(614.97)
(264.38)
((44.26))
((205.22))
(629.87)
-
-
-
11.88
11.88
((129.99))
((129.99))
580.05
214.40
(41.42)
(207.59)
545.44
(614.97)
(264.38)
((44.26))
((335.21))
(499.88)
-
-
-
(210.40)
(210.40)
((215.52))
((215.52))
580.05
214.40
(41.42)
(417.99)
335.04
(614.97)
(264.38)
((44.26))
((550.73))
(284.36)
-
-
-
(1.41)
(1.41)
((10.88))
((10.88))
580.05
214.40
(41.42)
(419.40)
333.63
(614.97)
(264.38)
((44.26))
((561.61))
(273.48)
4864.74
2748.18
59.29
-
7672.21
(4766.75)
(2694.44)
(72.50)
-
(7533.69)
-
-
-
609.16
609.16
(622.02)
(622.02)
1336.37
1336.37
-
-
-
(1356.12)
(1356.12)
4864.74
2748.18
59.29
1945.53
9617.74
(4766.75)
(2694.44)
(72.50)
(1978.14)
(9511.83)
881.98
301.49
27.18
-
1210.65
(802.31)
(325.77)
(17.85)
-
(1145.93)
-
-
-
1807.48
1807.48
(1996.90)
(1996.90)
881.98
301.49
27.18
1807.48
3018.13
(802.31)
(325.77)
(17.85)
(1996.90)
(3142.83)
85.82
80.80
0.09
-
166.71
(111.03)
(170.74)
(4.81)
-
(286.58)
64.39
76.37
2.24
-
143.00
(66.74)
(64.77)
(1.60)
-
(133.11)
3.13
5.83
0.12
-
9.08
(0.65)
(1.04)
(0.00)
-
(1.69)
211
Annual Report 2015-16
•
Connect with every sip
Notes to Consolidated Financial Statements
b) By Geographical Segments: Rs in Crores India Sales Revenue Segment Assets Purchase of Fixed Assets
UK
USA & Canada
Rest of the World
Total
3137.12
1386.34
2035.14
1423.10
7981.70
(2959.66)
(1443.55)
(1929.84)
(1499.62)
(7832.67)
2193.28
2753.09
2381.97
343.87
7672.21
(1998.14)
(2858.13)
(2269.51)
(407.91)
(7533.69)
77.21
28.60
50.59
10.31
166.71
(104.09)
(95.59)
(51.37)
(35.52)
(286.58)
Notes: a. Business Segments: The internal business segmentation and the activities encomed therein are as follows: Tea : Cultivation, manufacture, blending and sale of tea in packet, bulk or value added forms Coffee and Other Produce : Cultivation of coffee and related plantation crops and sale of coffee in various value added forms Others : Sale of water products and other businesses b. Geographical segments : Sales Revenue is on the basis of the geographical location of the customers. Carrying value of segment assets is based on geographical location of assets c. The segment wise revenue, results, assets and liabilities figures relate to the respective amounts directly identifiable to each of the segments. Unallocable expenditures includes expenses incurred on common services at the corporate level and exceptional items. Unallocable Income includes income from investments and exceptional items. d. Pricing of inter segment transfers are based on benchmark market prices.
47. Additional information, as required under Schedule III of the Companies Act, 2013, of entities consolidated as Subsidiary/ Associates/t Ventures (Refer Note 2b(i)). Name of the Entity
Net Assets
Share in Profit or Loss
As a % of Consolidated Net Assets
Amount (Rs in Crores)
As a % of Consolidated Profit or Loss
Amount (Rs in Crores)
50.64%
2895.90
172.95%
563.67
13.25%
757.79
31.45%
102.50
0.00%
0.00
0.00%
(0.00)
10.14%
579.83
24.69%
80.46
Parent Tata Global Beverages Limited Subsidiaries Indian 1
Tata Coffee Ltd.
2
Tata Tea Holdings Pvt. Ltd.
1
Consolidated Coffee Inc. (Consolidated Financials)
2
Tata Tea Extractions Inc.
5.28%
301.99
4.55%
14.82
3
Zhejiang Tata Tea Extraction Company Ltd.
-0.42%
(24.16)
-7.54%
(24.58)
4
Tata Global Beverages Capital Ltd.
15.18%
868.30
4.24%
13.82
Foreign
212
Corporate Overview 01-48
Statutory Reports 49-124
Financial Statements 125-220
Notes to Consolidated Financial Statements
Name of the Entity
Net Assets
Share in Profit or Loss
As a % of Consolidated Net Assets
Amount (Rs in Crores)
As a % of Consolidated Profit or Loss
Amount (Rs in Crores)
10.98%
35.77
5
Tata Global Beverages Group Ltd.
38.87%
2223.23
6
Tata Global Beverages Holdings Ltd.
29.13%
1666.18
9.43%
30.74
7
Tata Global Beverages Services Ltd.
57.50%
3288.22
-8.61%
(28.06)
8
Tata Global Beverages GB Ltd.
35.01%
2002.28
25.81%
84.13
9
Tata Global Beverages Overseas Holdings Ltd.
-1.21%
(68.99)
-2.05%
(6.67)
10
Tata Global Beverages Overseas Ltd.
0.01%
0.57
-0.01%
(0.02)
11
Lyons Tetley Ltd.
-
-
-
-
12
Drassington Ltd.
-
-
0.00%
0.00
13
Teapigs Ltd.
1.35%
77.05
3.25%
10.59
14
Teapigs US LLC
-0.03%
(1.94)
-0.08%
(0.26)
15
Stansand Ltd.
-
-
-
-
16
Stansand (Brokers) Ltd.
-
-
-
-
17
Stansand (Africa) Ltd.
0.15%
8.72
1.10%
3.59
18
Stansand (Central Africa) Ltd.
0.03%
1.88
0.48%
1.58
19
Joekels Tea Packers (Proprietary) Ltd.
0.21%
12.12
0.94%
3.06
20
Tata Global Beverages Polska sp.zo.o
-0.59%
(33.65)
-4.33%
(14.11)
21
Tata Global Beverages Czech Republic a.s.
0.00%
0.22
-2.02%
(6.59)
22
Tata Global Beverages US Holdings Inc.
7.09%
405.25
-0.74%
(2.41)
23
Tetley USA Inc.
5.00%
286.15
0.66%
2.14
24
Good Earth Corporation.
-0.11%
(6.17)
-0.08%
(0.27)
25
Good Earth Teas Inc.
0.23%
13.18
-4.62%
(15.05)
26
Tata Global Beverages Canada Inc.
1.56%
89.09
2.96%
9.65
27
Tata Global Beverages Australia Pty Ltd.
0.29%
16.36
1.19%
3.89
28
Earth Rules Pty Ltd.
-0.49%
(28.20)
-8.35%
(27.22)
29
Tata Global Beverages Investments Ltd.
66.34%
3793.67
20.78%
67.71
30
Campestres Holdings Ltd.
0.66%
37.85
-29.68%
(96.73)
31
Kahutara Holdings Ltd.
0.66%
37.80
-44.97%
(146.55)
32
Suntyco Holding Ltd. (Consolidated Financials)
-0.25%
(14.04)
-9.58%
(31.21)
-15.40%
(880.69)
-2.37%
(7.72)
Minorities in all Subsidiaries Associates Indian 1
Amalgamated Plantations Pvt. Ltd.
1.21%
69.31
-1.94%
(6.34)
2
Kanan Devan Hills Plantations Co. Pvt. Ltd.
-0.03%
(1.62)
-1.62%
(5.27)
3
TRIL Constructions Ltd.
-0.01%
(0.62)
-0.02%
(0.06)
0.27%
15.69
3.15%
10.26
Foreign Estate Management Services Pvt. Ltd.
213
Annual Report 2015-16
•
Connect with every sip
Net Assets
Share in Profit or Loss
Notes to Consolidated Financial Statements
Name of the Entity
As a % of Consolidated Net Assets
Amount (Rs in Crores)
As a % of Consolidated Profit or Loss
Amount (Rs in Crores)
t Ventures Indian 1
NourishCo Beverages Ltd.
0.10%
5.62
-4.91%
(16.00)
2
Tata Starbucks Pvt. Ltd.
1.77%
101.19
-6.16%
(20.07)
Foreign 1
Empirical Group LLC
0.23%
12.96
6.78%
22.09
2
Southern Tea LLC
0.71%
40.89
1.15%
3.74
3
Tetley ACI (Bangladesh) Ltd.
-0.02%
(0.96)
-0.65%
(2.12)
4
Tetley Clover (Pvt.) Ltd. Consolidation Eliminations/adjustments
Total
0.01%
0.54
-1.01%
(3.30)
-224.34%
(12829.87)
-85.20%
(277.69)
5718.92
325.91
48. Post Retirement Employee Benefits :
a.
The Group operates defined contribution schemes like provident fund and defined contribution superannuation schemes. For these schemes, contributions are made by the Group, based on current salaries, to funds maintained by the Group and, for certain categories contributions are made to State Plans. For certain schemes, contributions are also made by the employees. An amount of Rs 38.89 Crores (Rs 37.10 Crores) has been charged to the statement of profit and loss on of defined contribution schemes.
b.
The Group also operates defined benefit schemes like retirement gratuity, superannuation benefits and post retirement medical benefits. The superannuation benefits and medical benefits are restricted to certain categories of employees/ Directors in the form of pension, medical and other benefits in of a specific policy related to the same (“Others”). The defined benefit schemes offer specified benefits to the employees on retirement. Annual actuarial valuations are carried out by independent actuaries. Wherever funds have been set up, annual contributions are also made by the Group. Employees are not required to make any contribution.
c.
The Group has substantial international operations with approximately 60% of its revenues coming from overseas operations. For the purposes of consolidated financial statements, actuarial gains and losses relating to defined benefit pension scheme of overseas subsidiaries has been ed for in the Reserves instead of the statement of profit and loss, applying the ing principles of consolidation under ing Standard 21 and the policy followed by the overseas subsidiaries and as recognised by the relevant overseas ing framework. Adoption of the above policy is required to reflect a consistent framework amenable for better inter-firm comparison and to reflect the underlying performance. Further, the current policy is consistent with IND-AS 19 – Employee Benefits (mandatorily applicable from April 1, 2016) wherein, the actuarial gains and losses on defined benefit plans are not required to be recognised in the Statement of Profit and Loss.
214
Corporate Overview 01-48
Financial Statements 125-220
Statutory Reports 49-124
Notes to Consolidated Financial Statements
Overseas actuarial gains/losses principally relate to a defined benefit retirement scheme of an overseas subsidiary which is closed for future accruals. These gains/ losses represent increase in the value of future long term payment obligations due to changes in interest rates and other actuarial assumptions based on the market position as at the year end. The actuarial assumptions are subject to significant fluctuations especially under volatile market conditions. Had the company followed the policy of ing overseas actuarial gain/(loss) in the statement of profit and loss, the profit before tax, profit after tax before shares of results of Associate & Minority Interest and profit after tax would have been lower by Rs. 53.15 Crores (Rs 58.67 Crores), Rs. 42.61 Crores (Rs 48.11 Crores ) and Rs. 37.77 Crores (Rs 42.65 Crores) respectively.
The following tables set out the details of funded and un-funded retirement benefit plans and amounts recognised in the financial statements :
d.
i.
Amounts recognised in the Statement of Profit and Loss and charged to Contribution to Provident Fund and Other Funds, Staff Welfare as follows: Rs in Crores Pension
ii.
Others
2015
2016
2015
2016
2015
2016
2015
-
-
5.56
4.55
1.52
1.85
3.01
2.17
44.36
50.67
6.79
6.62
3.29
3.66
3.51
3.43
(47.00)
(52.34)
(5.72)
(5.59)
-
-
-
-
Net actuarial loss/ (gain) recognised during the year
(0.25)
0.16
6.30
4.08
2.19
(4.21)
6.65
3.15
Effects of the limit in Para 59(b) of AS-15
(0.27)
(0.09)
-
(0.01)
0.90
-
-
-
Total recognised in statement of profit and loss
(3.16)
(1.60)
12.93
9.65
7.90
1.30
13.16
8.75
Expected Return on plan assets
Medical
2016 Current Service Cost Interest on obligation
Gratuity
Reconciliation of opening and closing balances of the present value of the obligations: Rs in Crores Pension
Gratuity
Medical
Others
2016
2015
2016
2015
2016
2015
2016
2015
Opening defined benefit obligation 1281.79
1178.84
86.88
77.67
40.27
40.22
56.70
51.27
-
-
5.58
4.55
1.52
1.85
3.01
2.17
Current Service Cost Interest Cost Actuarial loss/ (gain) Liabilities assumed on Acquisition / (settled on Divestiture) etc. Exchange Rate Variation Benefit Paid Closing Defined Benefit Obligation
44.36
50.67
6.79
6.62
3.29
3.66
3.51
3.43
(16.23)
188.15
5.72
4.32
2.19
(4.21)
6.65
3.15
-
-
-
(0.62)
0.90
-
-
-
43.44
(99.24)
-
-
-
-
-
-
(41.56)
(36.63)
(8.08)
(5.66)
(1.03)
(1.25)
(4.31)
(3.32)
1311.80 1281.79
96.91
86.88
47.14
40.27
65.56
56.70
215
Annual Report 2015-16
•
Connect with every sip
Notes to Consolidated Financial Statements
iii)
Reconciliation of opening and closing balances of the fair value of plan assets: Rs in Crores Pension 2016
2015
2016
2015
1111.31
1051.20
77.53
69.17
47.00
52.34
5.72
5.59
(69.13)
129.32
(0.58)
0.24
-
-
-
-
Contribution/ ( Withdrawal) by employer
34.40
-
8.74
8.89
Assets acquired on Acquisition / (settled on Divestiture)
(1.00)
-
-
(0.70)
Exchange Rate Variation
38.70
(85.34)
-
-
(41.17)
(36.21)
(7.84)
(5.66)
1120.11
1111.31
83.56
77.53
(22.12)
181.66
5.14
5.83
2016
2015
0.14%
0.18%
Equity
32.61%
35.07%
Bonds
50.12%
49.77%
7.46%
7.14%
Property
8.07%
7.29%
Others
1.60%
0.55%
100.00%
100.00%
Opening fair value of Plan Assets Expected Return on plan assets Actuarial gain/ (loss) Asset distributed on settlement
Benefits Paid Closing Fair value of Plan Assets Actual Return on Plan Assets
iv.
Gratuity
Major Categories of Plan Assets as a percentage of fair value of the total plan assets:
Govt of India Securities
Insurance managed Funds
Total
v.
Effect of increase/ decrease of one percentage point in the assumed medical inflation rates: Rs in Crores Increase
216
Decrease
2016
2015
2016
2015
Effect on aggregate of interest cost and current service cost
2.77
1.58
(2.19)
(1.98)
Effect on defined benefit obligation
5.85
4.47
(4.68)
(4.01)
Corporate Overview 01-48
Financial Statements 125-220
Statutory Reports 49-124
Notes to Consolidated Financial Statements
vi.
Principal Actuarial assumptions used:
Discount rates
2016
2015
8.05% / 7.90% / 7.80% / 7.60% / 3.40%
8.00% / 9.30% / 9.00% / 3.40%
7.50% / 8.00%
7.50% / 8.85%
8.00%
8.00%
Expected rate of return on plan assets Medical inflation rate
LIC 1994-96 mortality LIC 1994-96 mortality tables/ other tables/ other approved norms for approved norms for overseas schemes overseas schemes
Mortality rates
The estimates of future salary increases considered in the actuarial valuation takes into factors like inflation, future salary increases, supply and demand in the employment market etc. The expected return on plan assets is based on actuarial expectation of the average long term rate of return expected on investments of the Funds during the estimated term of the obligations.
The contribution expected to be made by the Group for the year ending March 31, 2017 is not readily ascertainable.
Amounts recognised in the Balance Sheet are as follows:
vii.
Rs in Crores Particulars
Pension 2016
2015
Gratuity
2014
2013
2012
2016
2015
2014
2013
2012
Present value of funded obligation
1307.91 1277.64 1174.42
957.88
846.28
96.91
86.88
77.67
68.34
56.18
Fair Value of Plan Assets
1120.11 1111.31 1051.20
810.42
694.65
83.56
77.52
69.17
56.37
46.46
187.80 166.33 123.22 147.46 151.63
8.50
11.97
9.72
0.03
-
13.35
9.36
Present Value of Unfunded Obligation
3.89
4.15
4.42
4.63
5.91
-
-
Amount not recognized as an asset (limit in Para 59 (b) of AS -15)
0.42
0.69
0.77
0.66
0.71
-
-
0.02
-
-
(0.99)
-
-
-
-
-
-
-
-
-
191.12 171.17 128.41 152.75 158.25
13.35
9.36
8.52
12.00
9.72
Contribution adjustment Net Liability
217
Annual Report 2015-16
•
Connect with every sip
Notes to Consolidated Financial Statements
Particulars
Medical 2016
2015
2014
Present value of funded obligation
-
-
-
Fair Value of Plan Assets
-
-
-
-
-
-
47.14
40.27
-
47.14
Present Value of Unfunded Obligation Amount not recognized as an asset (limit in Para 59 (b) of AS -15) Net Liability
Others 2013
2012
2016
2015
2014
2013
-
-
-
-
-
-
-
-
-
-
-
-
-
-
-
-
-
40.22
41.94
37.78
65.56
56.70
51.27
38.89
-
-
-
-
-
-
-
-
40.27
40.22
41.94
37.78
65.56
56.70
51.27
38.89
49. Unless otherwise stated, figures in brackets relate to the previous year and have been rearranged / regrouped, wherever necessary.
For Lovelock & Lewes Firm Registration No. 301056E Chartered ants Dibyendu Majumder Partner hip No. 057687 Mumbai 24th May, 2016
218
Cyrus P Mistry Chairman L Krishnakumar Executive Director V Leeladhar Director John Jacob Chief Financial Officer
Ajoy Misra Managing Director Harish Bhat Director Darius Pandole Director V Madan Company Secretary
Tata Global Beverages Group Ltd. Tata Global Beverages Holdings Ltd. Tata Global Beverages Services Ltd. Tata Global Beverages GB Ltd. Tata Global Beverages Overseas Holdings Ltd. Tata Global Beverages Overseas Ltd. Lyons Tetley Limted (Dormant) Drassington Ltd. Teapigs Ltd. Teapigs US LLC Stansand Ltd. (Dormant) Stansand Brokers Ltd. (Dormant) Stansand (Africa) Ltd. Stansand (Central Africa) Ltd. Joekels Tea Packers (Proprietary) Ltd. Tata Global Beverages Polska.sp.zo.o Tata Global Beverages Czech Republic a.s Tata Global Beverages US Holdings Inc Tetley USA Inc. Good Earth Corporation Good Earth Teas Inc. Tata Global Beverages Canada Inc Tata Global Beverages Australia Pty Ltd. Earth Rules Pty Ltd. Tata Global Beverages Investment Ltd. (Refer Note 3) Campestres Holdings Ltd. Kahutara Holdings Ltd. Suntyco Holdings Ltd. Onomento Co Ltd OOO Sunty LLC (Refer Note 1) OOO Teatrade LLC (Refer Note 1) Tata Global Beverages Capital Ltd Tata Coffee Ltd Consolidated Coffee Inc. Eight O Clock Holdings Inc. Eight O Clock Coffee Inc. Tata Tea Extractions Inc. Zhejiang Tata Tea Extraction Company Ltd. (Refer Note 1) Tata Tea Holdings Private Ltd.
1 2 3 4 5
8.37 (81.94) 51.11 14.09 (28.63) 2.17 12.68 739.11 (51.91) (0.47) 104.92 209.24 (100.46)
(17.42) (18.67) 31.88 (1.94) 8.74 0.89 12.06 (118.63) (4.67) (38.66) (618.17) (6.17) (106.66) 80.61 (42.83) (103.80) 1468.36 8.88 47.53 51.95 14.27 90.24 35.65 1588.52 1054.16 403.65 397.11 1612.55 333.77 70.13
63.97 0.19 95.00 5.23 0.05 0.30 35.26 2.24 33.71 23.69 27.24 602.48 319.34 0.11 29.26 155.97 118.62 58.44 3703.21
Rs in Crores 8039.09 1809.22 4962.44 2811.70 460.44
0.49 129.33 0.39 0.13 108.77 33.48 720.40 296.37 58.72 0.75 1110.80 31.79 114.54
81.39 53.58 7.17 26.48 1.35 21.65 64.69 31.36 197.24 33.18 6.27 16.08 67.68 101.32 86.63 3.35
Rs in Crores 5787.61 143.04 1663.74 1089.50 883.44
Total Liabilities
46.89 48.42 1524.11 215.99 396.84 396.84 288.68 -
0.00 598.05 18.73 14.99 25.09
Rs in Crores 7388.61 1702.10 9.55 326.14
Investments
2.58 282.88 15.41 718.18 839.90 94.24 3.08
99.24 8.17 166.39 48.46 95.70 55.95 53.99 130.85 38.27 361.63 141.12 85.25 -
Rs in Crores 197.25 1354.10 -
Turnover
(30.77) (125.35) (0.10) 2.46 (24.51) 0.18 8.30 141.97 46.84 48.72 114.40 20.68 (15.34)
0.33 20.02 (0.26) 5.30 1.80 3.33 (13.50) (6.45) (2.36) 2.39 (0.27) (14.94) 12.18 5.61 (26.95) 33.88
Rs in Crores 47.58 29.49 3.11 7.75 (373.22)
Profit before Taxation
0.00 0.20 (7.54) (0.13) 5.60 (39.47) 0.73 0.09 (36.26) (5.79) -
0.06 (4.01) (1.69) (0.57) (1.00) (0.05) (2.51) (1.68) (24.46)
Rs in Crores 12.38 (6.59) (16.24) 2.09
Provision for Taxation
0.39 16.01 (0.26) 3.61 1.24 2.33 (13.50) (6.45) (2.36) 2.35 (0.27) (14.94) 9.67 3.93 (26.95) 9.42
Rs in Crores 59.96 29.49 (3.48) (8.48) (371.13)
Profit after Taxation
-
-
Rs in Crores
-
65.32 65.32 65.32 65.32 1.08 1.08 98.28 65.32 65.32 65.32 65.32 10.22
98.28 98.28 98.28 98.28 65.32 98.28 98.28 0.65 0.12 4.82 17.01 2.64 65.32 65.32 65.32 65.32 49.87 47.92 47.92 97.88
Rs 98.28 98.28 98.28 98.28 98.28
Average yearly rates for P&L items translation
Statutory Reports 49-124
100.00
100.00 65.00 100.00 100.00 100.00 100.00 100.00 57.48 100.00 100.00 100.00 100.00 81.46
100.00 100.00 100.00 100.00 100.00 100.00 100.00 100.00 100.00 51.00 100.00 100.00 100.00 100.00 100.00 100.00 100.00 100.00 100.00 100.00
% 88.65 100.00 100.00 100.00 100.00
Proposed % of ShareDividend holding (Refer Note 2)
-
0.02 0.13 0.46 0.05 10.10 0.00 855.44 18.68 396.84 396.84 396.84 92.75 56.04
0.19 18.67 9.55 0.05 0.30 0.03 0.00 0.00 77.63 0.56 443.89 904.34 119.85 7.69 60.13 75.61 2231.50
Rs in Crores 7.31 1666.18 3297.17 1722.21 (423.00)
Rs in Crores 2244.17 0.00 1.53 -
Total Assets
39 INR 0.05 (0.05) 0.01 0.01 (0.00) (0.00) Note: 1. Reporting period for all subsidiaries are 31.03.2016 except for OOO Sunty LLC, OOO Teatrade LLC and Zhejiang Tata Tea Extraction Company Ltd. - 31.12.2015. 2. % of shareholding is based on voting power held by the immediate parent. 3 Financial year is of eighteen months as the entity has changed its financial year end from September to March during the year. 4 Balance sheet items have been translated at the exchange rate as on the last day of relevant financial year. 5 The numbers reported above are based on individual financial statements prepared under local GAAP. 6 Above list does not include RBC Hold Co LLC which was dissolved during the year 2015-16. The assets held by the said entity amounting to Rs 0.83 Crores is pending distribution subject to completion of regulatory formalities.
66.25 66.25 66.25 66.25 0.90 0.90 95.47 66.25 66.25 66.25 66.25 10.19
95.47 95.47 95.47 95.47 66.25 95.47 95.47 0.65 0.10 4.50 17.70 2.79 66.25 66.25 66.25 66.25 51.23 50.96 50.96 95.47
Reserves & Surplus
Share Capital
24.28 -
USD USD USD USD RUR RUR GBP INR USD USD USD USD CNH
GBP GBP GBP GBP USD GBP GBP KES MWK SAR PLN CZK USD USD USD USD CAD AUD AUD GBP
Reporting Exchange rate Currency as on last day of relevant financial year (Refer Note 4) Rs GBP 95.47 GBP 95.47 GBP 95.47 GBP 95.47 GBP 95.47
(30.77) (125.35) 0.10 2.46 (32.05) 0.05 13.90 102.50 47.56 48.81 78.14 14.89 (15.34)
26 27 28 29 30 31 32 33 34 35 36 37 38
6 7 8 9 10 11 12 13 14 15 16 17 18 19 20 21 22 23 24 25
Name of the Subsidiary
SL No
Part “A” : Subsidiaries
Statement pursuant to first proviso to sub-section (3) of section 129 of the Companies Act 2013, read with rule 5 of Companies (s) Rules, 2014 in the prescribed Form AOC-1 relating to subsidiaries/Associates companies / t ventures
Corporate Overview 01-48 Financial Statements 125-220
219
220
6 i ii
5
4
3
1 2
-
67000000@ 67.00
(9.61) -
128.20
Not Applicable
(5.58) -
21.90
Not Applicable
Shareholding
28.52%
41.03%
Shareholding
12.33
3976563
61024400 61.02
Associate 31.03.2016
Associate 31.03.2016
Amalgamated Kanan Devan Plantation Hill Plantations Private Limited Limited
(0.06) -
50.17
Not Applicable
Shareholding
66751852 66.75
32.50%
11.75
11748148
10.26 -
62.18
Not Applicable
Shareholding
-
31.85%
14.57
12078406
(3.30) -
1.92
t Venture Agreement Not Applicable
3000000 2.74
50%
32.57
43750000
TRIL Estate Tetley Clover Management (Private) Limited Construction Limited Services Private Limited Associate Associate t Venture 31.03.2016 31.03.2016 30.06.2015
Associate Companies and t Ventures have been determined based on the ing Standards * Profit/(Loss) based on individual Financial Statements drawn up as at 31.03.2016, for consolidation purposes. ** Represents Group's share of profit/(loss) @ redeemable preference shares.
Reason why the associate/t venture is not consolidated Networth attributable to Shareholding as per latest audited Balance Sheet (Rs in Crs) Profit / (Loss) for the year* Considered in Consolidated** (Rs in Crores) Not Considered in Consolidated (Rs in Crores)
ii) Amount of Investment in Associates/t Venture (Rs in Crores) iii) Extent of Holdings Preference Shares i) Number ii) Amount of Investment in Associates/t Venture (Rs in Crores) Description of how there is significant influence
Latest audited Balance Sheet Date Shares of Associate /t Ventures held by the company on the year -end Equity Shares i) Number
Part "B" : Associates and t Ventures Sl Name of Associates/ t Ventures No.
(2.12) -
(4.64)
t Venture Agreement Not Applicable
-
50%
22.16
2000000
t Venture 31.12.2015
Tetley ACI (Bangladesh) Limited
22.09 -
12.96
t Venture Agreement Not Applicable
-
56%
hip Interest-56% -
t Venture 31.03.2016
Empirical Group, LLC
3.74 -
39.99
t Venture Agreement Not Applicable
-
50%
hip Interest-50% 33.74
t Venture 31.12.2015
Southern Tea, LLC
(16.00) -
5.62
t Venture Agreement Not Applicable
-
50%
90.50
90500000
t Venture 31.03.2016
(20.08) -
101.20
t Venture Agreement Not Applicable
-
50%
178.00
178000000
t Venture 31.03.2016
NourishCo Tata Starbucks Beverages Private Limited Limited
Statement pursuant to first proviso to sub-section (3) of section 129 of the Companies Act 2013, read with rule 5 of Companies (s) Rules, 2014 in the prescribed Form AOC-1 relating to subsidiaries/Associates companies / t ventures
Annual Report 2015-16 • Connect with every sip
"
"
GLOBAL BEVERAGES LIMITED ed office: 1, Bishop Lefroy Road, Kolkata 700 020 Corporate Identity Number (CIN) - L15491WB1962PLC031425 E-mail id - [email protected] Website address – www.tataglobalbeverages.com PROXY FORM (Pursuant to Section 105(6) of the Companies Act, 2013 and Rule 19(3) of the Companies (Management and istration) Rules, 2014) Name of the Member(s) : _________________________________________________________________________________________ ed Address : ________________________________________________________________________________________ Email Id : ________________________________________________________________________________________ Folio No. / DP ID NO. / Client ID No. : ________________________________________________________________________________________ I/We, being the member(s) of -----------------shares of Tata Global Beverages Limited, hereby appoint 1. Name ________________________________________________________________________ E-mail id: ________________________ Address:__________________________________________________________________________________________________________ _____________________________________________________________________________ Signature: ________________________ Or failing him Name ________________________________________________________________________ E-mail id: ________________________ 2. Address:__________________________________________________________________________________________________________ _____________________________________________________________________________ Signature: ________________________ Or failing him 3. Name ________________________________________________________________________ E-mail id: ________________________ Address:__________________________________________________________________________________________________________ _____________________________________________________________________________ Signature: ________________________ As my/our proxy to attend and vote (on a poll) for me/us , and on my /our behalf at the fifty third Annual General Meeting of the Company to be held on Wednesday, 24th August 2016 at 10.30 a.m. at the Oberoi Grand, 15, Jawaharlal Nehru Road, Kolkata 700 013 and at any adjournment thereof in respect of such resolutions as are indicated below: 1.
2. 3. 4. 5. 6.
To receive, consider and adopt: (a) the audited financial statements for the financial year ended 31st March 2016, together with the reports of the Board of Directors and Auditors thereon; and (b) the audited consolidated financial statements of the Company for the financial year ended 31st March 2016 together with the report of the Auditors thereon. Declaration of dividend Re-appointment of Mr. Cyrus P. Mistry as Director. Affix Ratification of appointment of auditors Revenue Remuneration of cost auditors Stamp Issue of Non Convertible Debentures on private placement basis
Signed this _________________________day of _________________________2016 Signature of shareholder _______________________________________ Signature of proxyholder(s) __________________________________ Notes: 1.
This Form in order to be effective should be duly completed and deposited at the ed Office of the Company at 1, Bishop Lefroy Road, Kolkata 700 020, not less than 48 hours before the commencement of the Meeting. 2 . Those who have multiple folios may use copies of this Attendance slip/ Proxy.
To, TSR Darashaw Limited Unit: Tata Global Beverages Limited 6-10 Haji Moosa Patrawala Industrial Estate, 20 Dr. E. Moses Road, Mahalaxmi, Mumbai 400 011 Updation of Shareholder Information I / We request you to record the following information against my / our Folio No.: General Information: Folio No.: Name of the first named Shareholder: PAN: * CIN / Registration No.: * (applicable to Corporate Shareholders) Tel No. with STD Code: Mobile No.: Email Id: *Self attested copy of the document(s) enclosed Bank Details: IFSC: (11 digit) MICR: (9 digit) Bank A/c Type: Bank A/c No.: * Name of the Bank: Bank Branch Address: * A blank cancelled cheque is enclosed to enable verification of bank details I / We hereby declare that the particulars given above are correct and complete. If the transaction is delayed because of incomplete or incorrect information, I / we would not hold the Company / RTA responsible. I / We undertake to inform any subsequent changes in the above particulars as and when the changes take place. I / We understand that the above details shall be maintained till I / we hold the securities under the above mentioned Folio No. / beneficiary . Place: ____________________________ Date:
Signature of Sole / First holder
Corporate Information BOARD OF DIRECTORS Cyrus P. Mistry (Chairman) Mallika Srinivasan (Mrs.) Analjit Singh V. Leeladhar Ranjana Kumar (Mrs.) Darius Pandole S. Santhanakrishnan Ireena Vittal (Mrs.) Harish Bhat Ajoy Misra, Chief Executive Officer & Managing Director L. KrishnaKumar, Executive Director & Group Chief Financial Officer V. Madan, Vice President and Company Secretary
BOARD COMMITTEES
ED OFFICE
BANKERS
Audit Committee V. Leeladhar (Chairman) Ranjana Kumar (Mrs.) Darius Pandole S. Santhanakrishnan Ireena Vittal (Mrs.) Harish Bhat
1, Bishop Lefroy Road, Kolkata - 700 020 Telephone : 033-22813779/3891/4422/4747/66053400 Fax : 033-22811199 Website : www.tataglobalbeverages.com
Bank of America Citibank N.A Coöperatieve Centrale Raiffeisen Boerenleenbank B.A. ( RABO BANK) Deutsche Bank HDFC Bank Limited ICICI Bank Limited Standard Chartered Bank State Bank of India State Bank of Travancore The Hongkong and Shanghai Banking Corporation Limited The Royal Bank of Scotland N.V. YES Bank Limited
Nomination and Remuneration Committee Ranjana Kumar (Mrs.) (Chairperson) Cyrus P. Mistry V. Leeladhar Darius Pandole Harish Bhat
SOLICITORS AND LEGAL ADVISERS AZB Partners Cyril Amarchand Mangaldas Dua Associates Khaitan & Co. Orr Dignam & Co. Veritas Legal
AUDITORS Lovelock & Lewes
Stakeholder Relationship Committee V. Leeladhar (Chairman) S. Santhanakrishnan L. KrishnaKumar Executive Committee Cyrus P. Mistry (Chairman) Harish Bhat Ireena Vittal (Mrs.) Ajoy Misra L. KrishnaKumar Corporate Social Responsibility Committee Ranjana Kumar (Mrs.) (Chairperson) V. Leeladhar S. Santhanakrishnan Ajoy Misra Prof. S. Parasuraman (Expert Member) Ethics and Compliance Committee V. Leeladhar (Chairman) Ranjana Kumar (Mrs.) Ajoy Misra
REGISTRARS Equity Shares and Fixed Deposits TSR Darashaw Limited (Formerly Tata Share Registry Limited) (Unit : Tata Global Beverages Ltd.) 6-10, Haji Moosa Patrawala Ind. Estate, 20, Dr. E. Moses Road, Mahalaxmi, Mumbai - 400 011 Telephone : 022-66568484 Fax : 022-66568494 Website : www.tsrdarashaw.com Kolkata Office 1st Floor, Tata Centre, 43, Chowringhee Road, Kolkata - 700 071 Telephone : 033-22883037 Fax : 033-22883097
Tata Global Beverages Limited 1, Bishop Lefroy Road, Kolkata - 700 020 www.tataglobalbeverages.com
Related Documents c2h70

Tgbl Annual Report 2015 16 Web Pdf Filefbe7b6881a2368caa65dff02001c5be1 1z1r49
December 2021 0
Britannia Annual Report 2015-16 3m6057
November 2019 59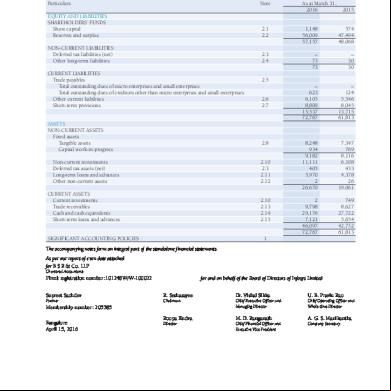
Infosys Annual Report 2015-16 4n6e72
March 2023 0
Burberry Annual Report 2015-16 614i25
October 2019 65
Bhel Annual Report 2015-16 183x42
December 2019 86
Sbi Annual Report 2015 16 244g61
December 2019 104More Documents from "sneha" 3p14i
Plc Lab Manual 5x2k1u
December 2021 0
Tgbl Annual Report 2015 16 Web Pdf Filefbe7b6881a2368caa65dff02001c5be1 1z1r49
December 2021 0
Ppt 5m493o
March 2021 0
6g3p1u
March 2021 0
Rajaram And Tarabai 413c5a
December 2019 46