Lect 3 Microbial Growth Kinetics.ppt 303w4v
This document was ed by and they confirmed that they have the permission to share it. If you are author or own the copyright of this book, please report to us by using this report form. Report 2z6p3t
Overview 5o1f4z
& View Lect 3 Microbial Growth Kinetics.ppt as PDF for free.
More details 6z3438
- Words: 1,566
- Pages: 39
• • •
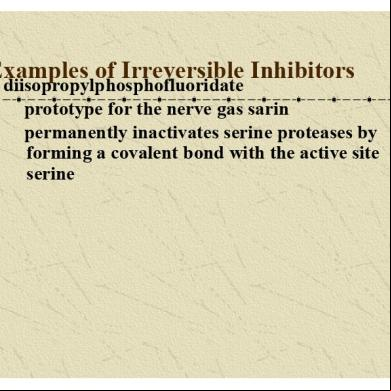
Examples of Irreversible Inhibitors
diisopropylphosphofluoridate prototype for the nerve gas sarin permanently inactivates serine proteases by forming a covalent bond with the active site serine
Penicillin is a suicide inhibitor
Glycopeptide transpeptidase catalyzes the formation of cross-links between D-amino acids in the cell walls of bacteria. This enzyme also catalyzes the reverse reaction, the hydrolysis of peptide bonds. During the course of hydrolyzing the strained peptide bond in penicillin, the enzyme activates the inhibitor (penicillin), which then covalently modifies an active site serine in the enzyme. In effect, the enzyme “commits suicide” by hydrolyzing the strained peptide bond in penicillin.
Suicide inhibitors work by “tricking” the enzyme into activating the inhibitor, which then forms a covalent bond with the enzyme, leading to its permanent inactivation.
Loading…
MICROBIAL GROWTH KINETICS
TYPE OF MICROBIAL GROWTH SYSTEM • • • •
3 major type: Batch culture Continuous or Chemostat Culture Fed-batch Culture
Loading…
BATCH CULTURE
BATCH CULTURE • •
Definition: A closed system with limited amount of nutrient (no additional of medium added) Cells grows through several phases: i) Lag phase ii) Log phase iii) Deceleration phase iv) Stationary phase v) Death phase
• • • • • • • • •
i)Time Lag phase of adaptation of cell to the environment or medium
(reorganization of micro molecular contituents). Length of lag phase may vary (depend on specific circumstances). Shorter lag time is recommended for industry, can be achieved using suitable inoculum (active or not) and environmental condition. Synthesis or inhibition of the enzyme or cell structure components may occur. Typical effects: Low cell number / cell concentration. No changes in substrate pH. No changes in substrate concentration. No product formation.
ii) Log phase • • • • • • • •
Illustrate by a linear line of the plot of log cell mass vs time. During this phase, a growth at steady state where specific growth rate, µ are fixed. Cell growth at maximum attainable rate. Typical effects in log phase: Rapid increase in cell concentration. Rapid changes in substrate pH. Substrate concentration decreased. Product formation starts.
iii) Deceleration phase • • •
Growth rate slowly decreases due to: Consumption of nutrient or essential nutrient become depleted (substrate limitation). Accumulation of toxic product.
iv) Stationary phase
Loading…
iv) Death phase
GROWTH VS MULTIPLICATIO N CURVE
COMPARISON BETWEEN GROWTH AND MULTIPLICATION CURVE GROWTH CURVE
MULTIPLICATION CURVE
A plot of biomass concentration against Incubation time.
A plot of cell number against time.
Lag phase is shorter than the multiplication curve since the growth rate begins to increase earlier than the multiplication rate.
Lag phase longer.
The log phase is substantially longest.
Shorter log phase.
Section 3 of both curve are identical.
Section 3 of both curve are identical.
Death phase sets in earlier.
Death phase sets in later.
Stationary phase is much longer.
Shorter stationary phase.
GROWTH CURVE • •
X = Biomass concentration Individual phases: 1: Lag phase 2: Accelaration phase 3: Balanced growth 4: Deceleration phase 5: Stationary phase 6: Death phase
MULTIPLICATION CURVE • •
N = No of cell Individual phases: 1: Lag phase 2: Accelaration phase 3: Balanced growth 4: Deceleration phase 5: Stationary phase 6: Death phase
PRODUCTION KINETICS
To determine the metabolic parameters • • • • • •
Need data on: substrate uptake with time with and without product formation product generation with time with and without cell growth cell growth with time
•Specific growth rate:
Where: dx = Change in biomass concentration. dt = Change in incubation time. x = biomass concentration. •Specific growth rate, µ expressed in reciprocal time unit (h-1).
•During batch cultivation, specific growth rate changes continuosly from zero to the max value µmax. •µmax depends on microorganisms, physical, chemical conditions. •Typical values of µmax:
Microorganisms
µmax (h-1)
Bacteria
Cultivation Temperature 37ºC
Yeast
30ºC
0.3-0.5
Actinomycetes
28ºC
0.1-0.3
Fungal
28ºC
0.1-0.3
0.6-1.2
• •
By plotting the growth curve of the microorganisms, then determine the instavenous µ value at each sampling time by ascertaining the tangent at the point of on the growth curve. The highest value obtained (from 24-72h) is the µmax.
The Yield Coefficient (Y) •
•
A measure of the overall efficiency of the conversion of substrate to cell mass or specific product:
Parameter
Equation
Cell (Y x/s)
ΔX / ΔS
Product (Y p/s)
ΔP / ΔS
p/x) / ΔX Y isProduct not (Y constant, will varyΔPdepending on organism, pH, temperature and substrate
Substrate Utilization and Product Formation (Yp/s) YP/S = =
g/l product produced g/g carbon sources utilized g/g
Economic yield (Yp/x) YP/X = =
g/l product produced g/L biomass formed g/g
Batch Productivity • • •
Productivity – a measure of product ( or biomass) produced per unit time (g/L/h). Product formation of growth – link product is closely related with growth rate. Productivity in batch culture will be a greatest when growth rate max (µmax).
Productivity (R batch) =
X max Xo T final – T initial
Where; X max = maximum cell concentration at stationary phase Xo = initial cell during inoculation T final = time during which organism growing at µmax T initial = time which organism not growing at µmax, including lag phase, deceleration phase period of batching, sterilizing and so on.
Incubatio dt n Time (h)
1/t
0
[Cell] (g/L)
1/x
dx/dt
µ (h-1)
0.1
0
0.004
0
0.2
10.0
0.004
0.04
0.3
5.0
0.004
0.021
0.3
3.33
0 24
0.042
24
0.1 48
0.021
48
0.2 72
72
0.014 0.3
96 96
0.3 120
120
0.2 144
144
0.1 168
168
0.05 192
192
dx
0.02
CONTINUOUS CULTURE
CONTINUOUS CULTURE • • • •
Fresh fermentation media is continuosly added to the reactor while fermenter broth containing biomass, products and unused nutrient are continuosly removed. Exponential growth in batch culture may be prolonged by the addition of fresh medium to the vessel. Growth can be maintained for long duration Continuous feeding to a culture at a suitable rate formation of new biomass by the culture is balanced by the loss of cell from the vessel STEADY STATE.
Application of Continuous Culture • • •
Biomass production Growth associated product or primary metabolite – e.g: ethanol, citric acid Not suitable for non-growth associated or secondary metabolite – e.g: antibiotic
Loading…
Important •
When referring to continuous culture systems, the used in batch culture (lag, exponential, stationary, death phase) have no meaning because the system is operating continuously and growth cannot segregated into phases
BATCH CULTURE
CONTINUOUS CULTURE
Nutrients added only at start
Nutrients added continuously
Product removed when fermentation stops.
Product continuously removed .
Growth rates and product formation are slower because limiting factors ex: substrate levels/ build up of toxins.
Organism held in exponential growth phase giving higher productivity so can be on a smaller scale.
Slower growth rates = Larger vessels are used. Easy to set up and maintain.
Can be very difficult to maintain conditions so that exponential phase is maintained. Foaming, clumping and blocked inlet pose problems.
If contamination occurs only one batch is wasted.
Contamination can afferct a huge volume of product/ organism.
Less efficient / more time wasted shutting down removing product and starting up again.
Continuous, therefore more efficient use of time.
Product quality can vary between batches.
Product quality more consistent.
FED-BATCH CULTURE
FED BATCH CULTURE •
• • • •
Extending the batch culture by feeding continuously or periodically with medium with no removal of culture from the vessel. Somewhere between batch and continuous culture. A volume of medium is inoculated with the organism and allowed to grow for a batch period of time. Subsequently, a feed is initiated into the fermenter when a “quasi steady state” is obtained. Quasi steady state: when the growth limiting substrate has depleted.
PRODUCT FORMATION
Production kinetics • • • •
Classified based on the relationship between product synthesis and energy generation in the cell Growth associated. Non-growth associated. Mixed-growth associated.
Products • • • ➢ • ➢ • • • ➢ • • • ➢ •
Growth-associated. produced at the same time as cell growth. constitutive enzymes (ones that are normally present). glucose isomerase. metabolic intermediates. pyruvate, citrate, acetate. Non-growth-associated. takes place during the stationary phase (m=0) secondary metabolites. Antibiotics. Mixed - growth associated / Partially growth associated. takes place during growth and stationary phases. metabolic by-products. lactate, ethanol. secondary metabolites.
Primary Metabolite • •
Released as a result of metabolic processes which are essential for the life of the micro-organism e.g. ethanol from Saccharomyces cerevisiae. Thus, primary metabolites are produced throughout the growth of the micro-organism, especially through the exponential phase.
Secondary Metabolite • • •
A substance which is not essential for the life of the micro-organisms and which is not produced as a result of the growth process e.g. penicillin. Secondary metabolites are produced after the exponential growth phase has stopped. This is important because it means that secondary metabolites such as penicillin cannot be produced in continuous fermenters – which deliberately maintain the micro-organism in the exponential growth stage.
• Production of secondary metabolite starts when exponential growth stops and growth of cells starts to slow. • Adding a lot of extra nutrients at time T (see graph) will simply increase the growth of the micro-organism but not formation of the product. • However, by adding a small amount of extra nutrients at this time, the amount of product formed can be increased.
Related Documents c2h70
Lect 3 Microbial Growth Kinetics.ppt 303w4v
December 2019 53
Microbial Growth 353ja
October 2019 56
Microbiology-microbial Growth 1s1q7
December 2019 53
4. Control Of Microbial Growth 176c3u
July 2022 0
Microbial Nutrition, Ecology, And Growth 21f3d
December 2019 53
Controlling Microbial Growth In Vitro 1u636v
April 2022 0More Documents from "Ravanth Dhinakaran" 25605i
Lect 3 Microbial Growth Kinetics.ppt 303w4v
December 2019 53
Principle Of Electrical Machines g2e5q
December 2019 45
Kungumam Thozhi 01-05-2013 1t4w3i
November 2022 0
Engineering Mechanical Engineer Job - Roland Manufacturing Malaysia Sdn Bhd - 3445189 _ Jobstreet 68292x
July 2021 0
Customer Request Form - Axis Bank 41163x
December 2019 128