Law Of Supply 459
This document was ed by and they confirmed that they have the permission to share it. If you are author or own the copyright of this book, please report to us by using this report form. Report 2z6p3t
Overview 5o1f4z
& View Law Of Supply as PDF for free.
More details 6z3438
- Words: 849
- Pages: 26
LAW OF SUPPLY
SCHEDULE AND DIAGRAM
SUPPLY Definition
Quantity of product brought for sale at a price during a particular period of time. Basis
of Supply.
BASIS OF SUPPLY Reservation Price Cost of Production. Nature of Product. Need for money. Expectation regarding future price. Time required for varying supply. Holding Capacity. Warehousing Costs/Facilities.
DETERMINANTS OF SUPPLY 1. TECHNOLOGY. The Way commodity is Produced. New innovation of Products. Ex. Plastic :Due to various varieties of Plastic available results in decline in supply of many traditional products like Bamboo-Baskets.
DETERMINANTS OF SUPPLY 1. INPUT PRICES Prices of raw material and factors of production
Pinput α 1/S
DETERMINANTS OF SUPPLY 1. GOVT. TAXES & SUBSIDIES. Levy taxes on commodities includes Excise, Customs duty, Sales tax etc. Indirect Taxes α Supply Ex. If excise is increased; the Producers realizes lower price from the given price in market.
DETERMINANTS OF SUPPLY 1. PRICE OF RELATED GOODS.
Price of Related commodities Y increases; Thus, Producer of X would tend to devote more resource to Production of Y and less in X; therefore supply of X at given price may fall.
DETERMINANTS OF SUPPLY 1. EXPECTATION ABOUT FUTURE. E α 1/S If Producer expect higher price; they would tend to postpone its sale and reduce supply. If they expect a fall in the Price of X; they would increase their current supply.
THE LAW OF SUPPLY Other
things remaining constant, there is a direct relationship between the quantity supplied of a commodity and its price.
QαP
THE SUPPLY SCHEDULE.
Changes in supply to changes in price. Ex: Supply of Mangoes in a local market.
Quantity Supplied (Kg/day) 100
Price (Rs/Kg)
120
7
140
8
160
9
180
10
6
THE SUPPLY CURVE Price (Rs/Kg)
10 8 6 4 2 0 100
120
140
160
Quantity Supplied (Kg/day)
180
THE SUPPLY SCHEDULE.
Changes in supply to changes in price. Ex: Supply schedule of Product X
Price (Rs/Kg)
Supply (Kg)
4
400
6
800
8
1100
10
1300
12
1400
Price (Rs/Kg)
THE SUPPLY CURVE 14 12 10 8 6 4 2 0 400
800
1100
1300
Supply (Kgs)
1400
INDIVIDUAL & MARKET SUPPLY Price (Rs.)
Market Supply (Quintals) A
B
C
D
Total
400
4
3
5
6
18
600
8
6
9
10
33
800
11
8
12
15
46
1000
13
10
15
20
58
1200
14
11
20
30
75
INDIVIDUAL & MARKET SUPPLY CURVE 1400 1200 A
Price
1000
B
800
C
600
D
400
Md
200 0 0
20
40 Quantity
60
80
LIMITATION OF LAW Prices
of other Products are Constant.
Ex.- Price of Jawar increases; its supply must increase. But If Prices of cotton rises further; farmer's would rather saw cotton than Jawar. And Supply of Jawar would fall.
LIMITATION OF LAW Cost
of Production are Constant. Even if Prices of product rise, If rise in the Production cost more than the gain; Supply would actually decline.
LIMITATION OF LAW State
of Technology is Constant. Technological process would bring down the cost of production with such progress, a slight fall in price may not detain producers to increase supply.
LIMITATION OF LAW Govt.
Tax-Policy is Constant Govt. Lowers Taxes on raw material or electricity, Cost of Production may go Down. Producer may increase production without reduction in Price.
SUPPLY CURVE AS DIVIDING LINE P (Rs/Kg)
Attainable region
8 7
S
Non-Attainable
120 140 160
Q (Kg)
SUPPLY & DEMAND RELATION
P1
Equilibrium pt.
P1
Q1
Q2
Equilibrium Price.
Disequilibrium Excess Supply Q2-Q1
Excess Demand Q2-Q1
INCREASE OF SUPPLY Price Supply Supply 1 2 (Rs) (Qtl.)
200
150
300
300
250
400
400
300
450
600 500
Price
(Qtl.)
700
400
S1 S2
300 200 100 0
500
350
500
600
400
550
0
100
200
300
400
500
Quantity
•Decrease in cost of Production
600
EFFECT OF INCREASE OF SUPPLY •
Whatever the cause, the most likely effect will be that the price of the good will decrease and that more of the good will be sold.
S ↑ => P ↓, Q ↑ •
an increase of supply gets buyers to buy more of the good by lowering the price.
P
S0 S1
P0 P1 D Q0 Q1
Q
DECREASE OF SUPPLY Price Supply Supply 1 2 (Rs) 200 300 400
300 400 450
(Qtl.)
150 250 300
600 500 Price
(Qtl.)
700
400
S1
300
S2
200 100 0 0
500
500
350
600
550
400
100
200
300
400
500
Quantity
Increase in cost of Production
600
EFFECT OF DECREASE OF SUPPLY •
Whatever the cause of the decrease of supply, the most likely effect will be that the price of the good will increase and that less of the good will be sold.
P
S1
S0
P1 P0
S ↓ => P ↑, Q ↓ •
Decrease of supply gets buyers to buy less of the good by raising the price.
D Q1 Q0
Q
Related Documents c2h70
Law Of Supply 459
March 2021 0
Law Of Guardianship Muslim Law 1y5e46
December 2019 73
Definition Of Law-sources Of Law 32j5o
November 2021 0
Nerve Supply Of Face 2r3cx
November 2019 81
Nerve Supply Of Teeth 292bu
October 2019 43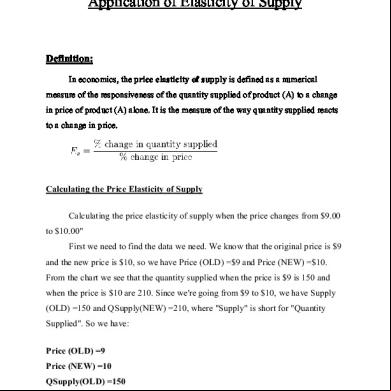
Application Of Elasticity Of Supply 6t235b
October 2019 46More Documents from "amit" 5o1i5s
Law Of Supply 459
March 2021 0
Top 14 Cost ing Problems With Solutions 2v28a
November 2019 126
Financial Ratio Analysis - Best Ppt 2h4f5h
October 2019 133
Determinants Of Organizational Structure 1py5c
December 2019 44
Bbbbh 4ed3z
July 2022 0