Holt Algebra 1_chapter 05 Test.pdf 1684t
This document was ed by and they confirmed that they have the permission to share it. If you are author or own the copyright of this book, please report to us by using this report form. Report 2z6p3t
Overview 5o1f4z
& View Holt Algebra 1_chapter 05 Test.pdf as PDF for free.
More details 6z3438
- Words: 2,939
- Pages: 8
Name ———————————————————————
Date ————————————
Chapter Test A
CHAPTER
5
For use after Chapter 5
Write an equation in slope-intercept form of the line that has the given slope and y-intercept. 3 2. slope: }; y-intercept: 21 4
1. slope: 22; y-intercept: 0
Write an equation in slope-intercept form of the line that es through the given point and has the given slope m. 3. (2, 23); m 5 3
2 5. (3, 21); m 5 } 3
4. (21, 0); m 5 2
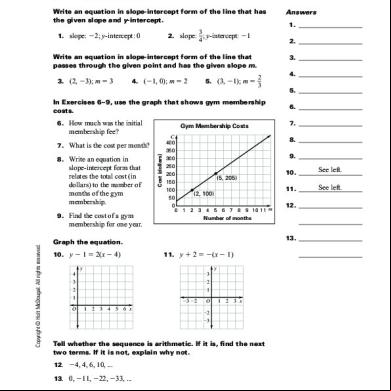
In Exercises 6–9, use the graph that shows gym hip costs. 6. How much was the initial
Gym hip Costs
hip fee?
8. Write an equation in
slope-intercept form that relates the total cost (in dollars) to the number of months of the gym hip.
Cost (dollars)
7. What is the cost per month?
C 400 350 300 250 200 150 100 50
0
Answers 1. 2. 3. 4. 5. 6. 7. 8. 9. 10.
See left.
11.
See left.
(5, 205) (2, 100) 0 1 2 3 4 5 6 7 8 9 10 11 m
9. Find the cost of a gym
12.
Number of months
Copyright © Holt McDougal. All rights reserved.
hip for one year. 13.
Graph the equation. 10. y 2 1 5 2(x 2 4)
11. y 1 2 5 2(x 2 1) y
y 4
3 2 1
3 2 1 O
23 22 1
2
3 4
5
6 x
O
1 2 3 x
22 23
Tell whether the sequence is arithmetic. If it is, find the next two . If it is not, explain why not. 12. 24, 4, 6, 10, ... 13. 0, 211, 222, 233, ...
Algebra 1 Chapter 5 Assessment Book
89
Name ———————————————————————
Chapter Test A
CHAPTER
5
Date ————————————
continued
For use after Chapter 5
Write an equation for a linear function f that has the given values. 14. f(23) 5 2 and f(1) 5 0
Answers 14.
15. f (3) 5 23 and f(4) 5 1 15.
In Exercises 16 and 17, use the following information.
For a school band fundraiser, students are selling seat cushions for $4 each and license plate holders for $6 each. One student raises $304.
16. 17.
16. Write an equation in standard form of the line that models the
possible combinations of seat cushions and license plate holders the student sold.
18.
17. List two of these possible combinations. 18. Write an equation of the line that es through the point (4, 7) and 1 is (a) parallel to and (b) perpendicular to the line y 5 }2 x 2 1.
19.
See left.
20.
In Exercises 19–22, use the table that shows the number of calories in grams of fat. Fat (g)
31
39
19
34
43
39
35
Calories
580
680
410
590
660
640
570
24. 25.
0 10 20 30 40 50 x
20. Describe the correlation. 21. Draw a line of fit for the data. 22. Use the line of fit from Exercise 19 to predict the number of calories
in a hamburger that contains 28 grams of fat. Find the zero of the function. 23. f(x) 5 x 2 8
Algebra 1 Chapter 5 Assessment Book
24. f (x) 5 3x 1 9
1 25. f (x) 5 } x 2 1 2
Copyright © Holt McDougal. All rights reserved.
Calories
23.
y 700 650 600 550 500 450 400
Fat (g)
90
See left.
22.
19. Make a scatter plot of the data.
0
21.
Name ———————————————————————
Date ————————————
Chapter Test B
CHAPTER
5
For use after Chapter 5
Write an equation in slope-intercept form of the line shown. 1.
2.
y 1
3
O
3
4
4 3 2 1
5 x
22
4 25
2. 3.
25 24 23 22
24
1.
y
(25, 4)
1 x
(1, 22)
(0, 25)
Answers
4. 5.
In Exercises 3 and 4, use the following information.
A delivery service charges a base price for an overnight delivery of a package plus an extra charge for each pound the package weighs. A customer is billed $22.85 for shipping a 3-pound package and $40 for shipping a 10-pound package. 3. Write an equation that gives the total cost of shipping a package as a
function of the weight of the package.
6. 7.
See left.
8.
See left.
9.
4. Find the cost of shipping a 15-pound package.
Find the missing coefficient in the equation of the line that es through the given point. 5. Ax 1 y 5 3; (2, 25)
6. 3x 1 By 5 21; (2, 7) 10.
Copyright © Holt McDougal. All rights reserved.
Graph the equation. 2 7. y 2 2 5 }(x 2 4) 3
8. y 1 4 5 23(x 1 2)
y
y
3
3 2 1
2 1 22
1 2
O
3
24
4 x
22 23
22
O
1 2 x
22 23
In Exercises 9 and 10, use the table. x
2
4
6
9
11
y
23
5
13
25
33
9. Explain why the data can be modeled by a linear equation. 10. Write an equation in point-slope form that relates y to x.
Algebra 1 Chapter 5 Assessment Book
91
Name ——————————————————————— CHAPTER
5
Chapter Test B
Date ————————————
continued
For use after Chapter 5
Tell whether the sequence is arithmetic. If it is, find the next two . If it is not, explain why not. 11. 3, 28, 219, 230, ...
Answers 11.
12. 21, 22, 43, 65 ... 12.
Write an equation in standard form of the line that es through the given point and has the given slope m or that es through the given points.
13. 14.
1 13. (24, 3), m 5 } 2
14. (2, 23), m 5 24
15. (22, 21), (2, 26)
16. (22, 5), (3, 5)
15. 16.
In Exercises 17 and 18, use the following information.
17.
A piggy bank contains only nickels and quarters. The total value in the bank is $3.80.
18.
17. Write an equation in standard form that models the possible
combinations of nickels and quarters in the piggy bank. 18. List two of these possible combinations. 19. Write an equation of the line that es through the point (24, 21)
and is (a) parallel to and (b) perpendicular to the line 2x 1 7y 5 14.
19.
Fat (g)
31
39
19
34
43
39
35
Calories
580
680
410
590
660
640
570 20.
20. Make a scatter plot of the data.
22. Use technology to find the equation of
the best-fitting line for the data. 23. Graph the best-fitting line for the data
on the scatter plot.
Calories
21. Describe the correlation.
y 700 650 600 550 500 450 400
0
24. Predict the number of calories in a
hamburger that contains 28 grams of fat.
See left.
21.
0 10 20 30 40 50 x Fat (g)
22. 23. 24.
92
Algebra 1 Chapter 5 Assessment Book
See left.
Copyright © Holt McDougal. All rights reserved.
In Exercises 20–24, use the table.
Name ———————————————————————
Date ————————————
Chapter Test C
CHAPTER
5
For use after Chapter 5
Write an equation in the given form of the line shown. 1. Slope-intercept form
2. Point-slope form
y 5
(21, 3)
22 2 1 O
1.
y
(0, 4)
2.
4 3
3.
23.5 1
2.5 x 1
Answers
2
3 4
23 22
5
3 x
3
4. 5.
22
3. The freezing point of water is 08C or 328F. The boiling point of water
6.
See left.
is 1008C or 2128F. Develop the formula that relates the number of degrees in Fahrenheit to the number of degrees in Celsius.
7.
See left.
Write an equation for a linear function f that has the given values. 4. f(23) 5 2 and f(22) 5 21
3 3 5. f (22) 5 2} and f (25) 5 } 4 4
8. 9. 10.
Graph the equation. 4 6. y 1 2 5 2}(x 1 5) 3
1 7. y 2 4 5 }(x 2 1) 3
y
y 5 4 3
Copyright © Holt McDougal. All rights reserved.
4 2 28 26 24
O
11.
2 4 x
2 1
24 26 28
23 22
O
1 2
3 x
Find the value of k so that the three points lie on the same line. Write the equation of the line in point-slope form. 8. (1, 22), (22, 4), (4, k)
9. (2, 2), (21, 5), (3, k)
Write a rule for the n th term of the sequence. Find a100. 10. 14, 22, 218, 234, ...
11. 12.7, 14.5, 16.3, 18.1
Algebra 1 Chapter 5 Assessment Book
93
Name ———————————————————————
Chapter Test C
CHAPTER
5
Date ————————————
continued
For use after Chapter 5
Write an equation in standard form of the line that es through the given point and has the given slope m or that es through the given points.
Answers
2 12. (25, 24), m 5 } 5
13. (3, 22), m 5 0
13.
14. (4, 9), (4, 21)
15. (22, 4), (4, 1)
12.
14. 15.
16. Determine whether the figure is a right triangle. A right triangle
contains one 90˚ angle. Justify your answer using slopes.
16.
y 3
(4, 2)
2
(25, 1)
1 23 22
25
O
2 3
4 x
17. (22, 23)
23
See left.
18.
In Exercises 17–21, use the table. It shows the gas mileages (in miles per gallon) for cars of different weights (in thousands of pounds). Weight
2
2.4
2.5
2.8
2.9
3.1
3.2
3.5
3.6
3.9
Mileage
34
34
28
23
25
23
23
22
24
18
19.
18. Describe the correlation. 19. Use technology to find the
equation of the best-fitting line for the data. 20. Predict the gas mileage for
a car the weights 3400 pounds.
Miles per gallon
17. Make a scatter plot of the data.
y 36 32 28 24 20 16
0
21.
0 2.0
2.5
3.0
3.5
21. Find the zero of the function
from Exercise 19 and explain what it means in this situation.
94
Algebra 1 Chapter 5 Assessment Book
4.0 x
Weight (thousands of pounds)
Copyright © Holt McDougal. All rights reserved.
20.
Chapter 4, continued SAT/ACT Chapter Test
10. an 5 36.1 1 (n 2 1)22.2; 2233.9
1. E 2. D 3. B 4. D 5. C 6. A 7. B 8. C 9 9. A 10. E 11. D 12. B 13. C 14. } or 1.8 5 15. $12 16. 5 years
11. C 5 12(m 2 1) 1 10 12. $94
1. Complete answers should include: a list of the three methods that can be used to graph a linear equation: make a table, use intercepts, and use the slope and y-intercept; an explanation of how to graph 2x + y = 3 using each method. 2. a. x-intercept: 80; y-intercept: 25 Large plants
b.
6. Lines a and c are parallel. 7. relatively no correlation 8. negative correlation 9. 4 10. 18
Chapter Test A
y 30 25 20 15 10
5 0
3 1 1. y 5 5x 2 7 2. y 5 }x 1 } 2 2 2 3. y 5 2} x 2 6 4. y 5 3x 2 9 5 5. Lines a and b are perpendicular.
3 1. y 5 22x 2. y 5 } x 2 1 3. y 5 3x 2 9 4 2 4. y 5 2x 1 2 5. y 5 } x 2 3 6. $30 7. $35 3 0 16 32 48 64 80 96 x Small plants
8. C 5 35m 1 30 9. $450 10.
plants that can be placed in the garden if no large plants are used. The y-intercept represents the number of large plants that can be placed in the garden if no small plants are used. d. Sample answer: 16 small and 20 large; 32 small and 15 large; 48 small and 10 large 5 5 e. 2} f. y 5 2} x 1 25 16 16
Large plants
3 2 1 23 22
1
2
3 4
5
6 x
1 2 3 x 22 23
12. not arithmetic; There is no common difference. 13. arithmetic; 244, 255 1 1 14. f (x) 5 2} x 1 } 15. f (x) 5 4x 2 15 2 2 16. 4s 1 6l 5 304 17. Sample answer: 1 seat
25
cushion and 50 license plate holders; 10 seat cushions and 44 license plate holders
20 15 10
1 18. Parallel: y 5 } x 1 5; 2
5 0
0 16 32 48 64 80 96 x Small plants
Perpendicular: y 5 22x 1 15 19.
h. The slope remained the same, but the
y-intercept increased by 5 units.
Chapter 5 Quiz 1 1. y 5 2x 2 1 2. y 5 2x 1 1
1 7 4 3. y 5 2} x 1 5 4. y 5 } x 1 } 2 5 5 5. y 1 2 5 3(x 2 2) or y 2 7 5 3(x 2 5)
Calories
Copyright © Holt McDougal. All rights reserved.
y 30
O
y
11.
y 4 3 2 1
c. The x-intercept represents the number of small
g.
ANSWERS
Performance Assessment
Quiz 2
y 700 650 600 550 500 450 400
0
0 10 20 30 40 50 x Fat (g)
20. The scatter plot shows a positive correlation.
As the grams of fat increased, the number of calories tends to increase.
3 3 6. y 2 4 5 }(x 2 6) or y 2 1 5 }(x 2 2) 4 4 7. 3x 1 y 5 3 8. x 2 y 5 2 9. an 5 218 1 (n 2 1)13; 1269
Algebra 1 Assessment Book
A11
Chapter 5, continued 22. 520 calories 23. 8 24. 23 25. 2
y 700 650 600 550 500 450 400
0
0 10 20 30 40 50 x Fat (g)
Chapter Test C 7 4 1. y 5 2} x 1 4 2. y 2 3 5 2}(x 1 1) 5 6 9 3. F(C) 5 } C 1 32 4. f (x) 5 23x 2 7 5 7 1 5. f (x) 5 2} x 2 } 2 4 6.
Chapter Test B 28
4 1. y 5 } x 2 5 2. y 5 2x 2 1 3
7.
y 4 2 24
O
2 4 x
2
24
1 23 22
3. y 5 2.45x 1 15.50 4. $52.25 5. A 5 4 6. B 5 21 8.
3 2 1 22
O
1 2
3
4 x
24
22 23
22
O 22 23
y 1 3 5 4(x 2 2) 11. arithmetic; 241, 252 12. not arithmetic; There is no common difference. 13. 2x 1 2y 5 10 14. 4x 1 y 5 5 15. 5x 1 4y 5 214 16. y 5 5 17. 0.05n 1 0.25q 5 3.80 18. Sample answers:
26 nickels and 10 quarters; 1 nickel and 15 2 15 quarters 19. Parallel: y 5 2}7 x 2 } ; 7 7
Perpendicular: y 5 }2 x 1 13
Calories
y 700
650 600 550 500 450 400
As the grams of fat increase, the number of calories tends to increase. 22. y 5 11x 1 211 23. 24. 519 calories y Calories
12. 2x 2 5y 5 10 13. y 5 22 14. x 5 4 15. x 1 2y 5 6 16. The figure is not a right 1 5 4 triangle because the slopes are 2}3, 2}9, and }6 ,
none of which are negative reciprocals. 17.
y 36 32 28 24 20 16
0
0 2.0
2.5
3.0
3.5
4.0 x
Weight (thousands of pounds)
18. The scatter plot shows a negative correlation.
As the weight of the car increases, the gas mileage tends to decrease. 19. y 5 28x 1 49 20. 22 mi/gal 21. x ø 6; There will be no gas mileage for a car that weighs 6000 pounds. 1. D 2. B 3. C 4. D 5. A 6. B 7. D 8. C
0 10 20 30 40 50 x
21. The scatter plot shows a positive correlation.
700 650 600 550 500 450 400 0 10 20 30 40 50 x Fat (g)
A12
11. an 5 12.7 1 (n 2 1)1.8; 190.9
Standardized Test A
Fat (g)
0
3 x
10. an 5 14 1 (n 2 1)(216); 21570 1 2 x
4 for each increase of 1 in the x-value. 10. Sample answer:
0
1 2
9. k 5 1; Sample answer: y 2 2 5 2(x 2 2)
9. The y-values increase at a constant rate of
20.
O
8. k 5 28; Sample answer: y 2 1 5 22(x 1 2)
y 3 2 1
Miles per gallon
y
7.
y 5 4 3
Algebra 1 Assessment Book
9. A 10. A 11. D 12. B 13. D 14. 24 15. a. The situation can be modeled by a linear
equation because the cost increases by a constant amount. b. $210 c. $40 16. a. y 5 2.5x 1 10 b. y 5 2.5x 1 5 c. The graphs are linear and have the same slope of 2.5. This means that the graphs are parallel. d. Regardless of the number of movies rented, the difference will always be $5. Each person pays the same amount per rental. The only difference is in the registration fee.
Copyright © Holt McDougal. All rights reserved.
ANSWERS
Calories
21.
Date ————————————
Chapter Test A
CHAPTER
5
For use after Chapter 5
Write an equation in slope-intercept form of the line that has the given slope and y-intercept. 3 2. slope: }; y-intercept: 21 4
1. slope: 22; y-intercept: 0
Write an equation in slope-intercept form of the line that es through the given point and has the given slope m. 3. (2, 23); m 5 3
2 5. (3, 21); m 5 } 3
4. (21, 0); m 5 2
In Exercises 6–9, use the graph that shows gym hip costs. 6. How much was the initial
Gym hip Costs
hip fee?
8. Write an equation in
slope-intercept form that relates the total cost (in dollars) to the number of months of the gym hip.
Cost (dollars)
7. What is the cost per month?
C 400 350 300 250 200 150 100 50
0
Answers 1. 2. 3. 4. 5. 6. 7. 8. 9. 10.
See left.
11.
See left.
(5, 205) (2, 100) 0 1 2 3 4 5 6 7 8 9 10 11 m
9. Find the cost of a gym
12.
Number of months
Copyright © Holt McDougal. All rights reserved.
hip for one year. 13.
Graph the equation. 10. y 2 1 5 2(x 2 4)
11. y 1 2 5 2(x 2 1) y
y 4
3 2 1
3 2 1 O
23 22 1
2
3 4
5
6 x
O
1 2 3 x
22 23
Tell whether the sequence is arithmetic. If it is, find the next two . If it is not, explain why not. 12. 24, 4, 6, 10, ... 13. 0, 211, 222, 233, ...
Algebra 1 Chapter 5 Assessment Book
89
Name ———————————————————————
Chapter Test A
CHAPTER
5
Date ————————————
continued
For use after Chapter 5
Write an equation for a linear function f that has the given values. 14. f(23) 5 2 and f(1) 5 0
Answers 14.
15. f (3) 5 23 and f(4) 5 1 15.
In Exercises 16 and 17, use the following information.
For a school band fundraiser, students are selling seat cushions for $4 each and license plate holders for $6 each. One student raises $304.
16. 17.
16. Write an equation in standard form of the line that models the
possible combinations of seat cushions and license plate holders the student sold.
18.
17. List two of these possible combinations. 18. Write an equation of the line that es through the point (4, 7) and 1 is (a) parallel to and (b) perpendicular to the line y 5 }2 x 2 1.
19.
See left.
20.
In Exercises 19–22, use the table that shows the number of calories in grams of fat. Fat (g)
31
39
19
34
43
39
35
Calories
580
680
410
590
660
640
570
24. 25.
0 10 20 30 40 50 x
20. Describe the correlation. 21. Draw a line of fit for the data. 22. Use the line of fit from Exercise 19 to predict the number of calories
in a hamburger that contains 28 grams of fat. Find the zero of the function. 23. f(x) 5 x 2 8
Algebra 1 Chapter 5 Assessment Book
24. f (x) 5 3x 1 9
1 25. f (x) 5 } x 2 1 2
Copyright © Holt McDougal. All rights reserved.
Calories
23.
y 700 650 600 550 500 450 400
Fat (g)
90
See left.
22.
19. Make a scatter plot of the data.
0
21.
Name ———————————————————————
Date ————————————
Chapter Test B
CHAPTER
5
For use after Chapter 5
Write an equation in slope-intercept form of the line shown. 1.
2.
y 1
3
O
3
4
4 3 2 1
5 x
22
4 25
2. 3.
25 24 23 22
24
1.
y
(25, 4)
1 x
(1, 22)
(0, 25)
Answers
4. 5.
In Exercises 3 and 4, use the following information.
A delivery service charges a base price for an overnight delivery of a package plus an extra charge for each pound the package weighs. A customer is billed $22.85 for shipping a 3-pound package and $40 for shipping a 10-pound package. 3. Write an equation that gives the total cost of shipping a package as a
function of the weight of the package.
6. 7.
See left.
8.
See left.
9.
4. Find the cost of shipping a 15-pound package.
Find the missing coefficient in the equation of the line that es through the given point. 5. Ax 1 y 5 3; (2, 25)
6. 3x 1 By 5 21; (2, 7) 10.
Copyright © Holt McDougal. All rights reserved.
Graph the equation. 2 7. y 2 2 5 }(x 2 4) 3
8. y 1 4 5 23(x 1 2)
y
y
3
3 2 1
2 1 22
1 2
O
3
24
4 x
22 23
22
O
1 2 x
22 23
In Exercises 9 and 10, use the table. x
2
4
6
9
11
y
23
5
13
25
33
9. Explain why the data can be modeled by a linear equation. 10. Write an equation in point-slope form that relates y to x.
Algebra 1 Chapter 5 Assessment Book
91
Name ——————————————————————— CHAPTER
5
Chapter Test B
Date ————————————
continued
For use after Chapter 5
Tell whether the sequence is arithmetic. If it is, find the next two . If it is not, explain why not. 11. 3, 28, 219, 230, ...
Answers 11.
12. 21, 22, 43, 65 ... 12.
Write an equation in standard form of the line that es through the given point and has the given slope m or that es through the given points.
13. 14.
1 13. (24, 3), m 5 } 2
14. (2, 23), m 5 24
15. (22, 21), (2, 26)
16. (22, 5), (3, 5)
15. 16.
In Exercises 17 and 18, use the following information.
17.
A piggy bank contains only nickels and quarters. The total value in the bank is $3.80.
18.
17. Write an equation in standard form that models the possible
combinations of nickels and quarters in the piggy bank. 18. List two of these possible combinations. 19. Write an equation of the line that es through the point (24, 21)
and is (a) parallel to and (b) perpendicular to the line 2x 1 7y 5 14.
19.
Fat (g)
31
39
19
34
43
39
35
Calories
580
680
410
590
660
640
570 20.
20. Make a scatter plot of the data.
22. Use technology to find the equation of
the best-fitting line for the data. 23. Graph the best-fitting line for the data
on the scatter plot.
Calories
21. Describe the correlation.
y 700 650 600 550 500 450 400
0
24. Predict the number of calories in a
hamburger that contains 28 grams of fat.
See left.
21.
0 10 20 30 40 50 x Fat (g)
22. 23. 24.
92
Algebra 1 Chapter 5 Assessment Book
See left.
Copyright © Holt McDougal. All rights reserved.
In Exercises 20–24, use the table.
Name ———————————————————————
Date ————————————
Chapter Test C
CHAPTER
5
For use after Chapter 5
Write an equation in the given form of the line shown. 1. Slope-intercept form
2. Point-slope form
y 5
(21, 3)
22 2 1 O
1.
y
(0, 4)
2.
4 3
3.
23.5 1
2.5 x 1
Answers
2
3 4
23 22
5
3 x
3
4. 5.
22
3. The freezing point of water is 08C or 328F. The boiling point of water
6.
See left.
is 1008C or 2128F. Develop the formula that relates the number of degrees in Fahrenheit to the number of degrees in Celsius.
7.
See left.
Write an equation for a linear function f that has the given values. 4. f(23) 5 2 and f(22) 5 21
3 3 5. f (22) 5 2} and f (25) 5 } 4 4
8. 9. 10.
Graph the equation. 4 6. y 1 2 5 2}(x 1 5) 3
1 7. y 2 4 5 }(x 2 1) 3
y
y 5 4 3
Copyright © Holt McDougal. All rights reserved.
4 2 28 26 24
O
11.
2 4 x
2 1
24 26 28
23 22
O
1 2
3 x
Find the value of k so that the three points lie on the same line. Write the equation of the line in point-slope form. 8. (1, 22), (22, 4), (4, k)
9. (2, 2), (21, 5), (3, k)
Write a rule for the n th term of the sequence. Find a100. 10. 14, 22, 218, 234, ...
11. 12.7, 14.5, 16.3, 18.1
Algebra 1 Chapter 5 Assessment Book
93
Name ———————————————————————
Chapter Test C
CHAPTER
5
Date ————————————
continued
For use after Chapter 5
Write an equation in standard form of the line that es through the given point and has the given slope m or that es through the given points.
Answers
2 12. (25, 24), m 5 } 5
13. (3, 22), m 5 0
13.
14. (4, 9), (4, 21)
15. (22, 4), (4, 1)
12.
14. 15.
16. Determine whether the figure is a right triangle. A right triangle
contains one 90˚ angle. Justify your answer using slopes.
16.
y 3
(4, 2)
2
(25, 1)
1 23 22
25
O
2 3
4 x
17. (22, 23)
23
See left.
18.
In Exercises 17–21, use the table. It shows the gas mileages (in miles per gallon) for cars of different weights (in thousands of pounds). Weight
2
2.4
2.5
2.8
2.9
3.1
3.2
3.5
3.6
3.9
Mileage
34
34
28
23
25
23
23
22
24
18
19.
18. Describe the correlation. 19. Use technology to find the
equation of the best-fitting line for the data. 20. Predict the gas mileage for
a car the weights 3400 pounds.
Miles per gallon
17. Make a scatter plot of the data.
y 36 32 28 24 20 16
0
21.
0 2.0
2.5
3.0
3.5
21. Find the zero of the function
from Exercise 19 and explain what it means in this situation.
94
Algebra 1 Chapter 5 Assessment Book
4.0 x
Weight (thousands of pounds)
Copyright © Holt McDougal. All rights reserved.
20.
Chapter 4, continued SAT/ACT Chapter Test
10. an 5 36.1 1 (n 2 1)22.2; 2233.9
1. E 2. D 3. B 4. D 5. C 6. A 7. B 8. C 9 9. A 10. E 11. D 12. B 13. C 14. } or 1.8 5 15. $12 16. 5 years
11. C 5 12(m 2 1) 1 10 12. $94
1. Complete answers should include: a list of the three methods that can be used to graph a linear equation: make a table, use intercepts, and use the slope and y-intercept; an explanation of how to graph 2x + y = 3 using each method. 2. a. x-intercept: 80; y-intercept: 25 Large plants
b.
6. Lines a and c are parallel. 7. relatively no correlation 8. negative correlation 9. 4 10. 18
Chapter Test A
y 30 25 20 15 10
5 0
3 1 1. y 5 5x 2 7 2. y 5 }x 1 } 2 2 2 3. y 5 2} x 2 6 4. y 5 3x 2 9 5 5. Lines a and b are perpendicular.
3 1. y 5 22x 2. y 5 } x 2 1 3. y 5 3x 2 9 4 2 4. y 5 2x 1 2 5. y 5 } x 2 3 6. $30 7. $35 3 0 16 32 48 64 80 96 x Small plants
8. C 5 35m 1 30 9. $450 10.
plants that can be placed in the garden if no large plants are used. The y-intercept represents the number of large plants that can be placed in the garden if no small plants are used. d. Sample answer: 16 small and 20 large; 32 small and 15 large; 48 small and 10 large 5 5 e. 2} f. y 5 2} x 1 25 16 16
Large plants
3 2 1 23 22
1
2
3 4
5
6 x
1 2 3 x 22 23
12. not arithmetic; There is no common difference. 13. arithmetic; 244, 255 1 1 14. f (x) 5 2} x 1 } 15. f (x) 5 4x 2 15 2 2 16. 4s 1 6l 5 304 17. Sample answer: 1 seat
25
cushion and 50 license plate holders; 10 seat cushions and 44 license plate holders
20 15 10
1 18. Parallel: y 5 } x 1 5; 2
5 0
0 16 32 48 64 80 96 x Small plants
Perpendicular: y 5 22x 1 15 19.
h. The slope remained the same, but the
y-intercept increased by 5 units.
Chapter 5 Quiz 1 1. y 5 2x 2 1 2. y 5 2x 1 1
1 7 4 3. y 5 2} x 1 5 4. y 5 } x 1 } 2 5 5 5. y 1 2 5 3(x 2 2) or y 2 7 5 3(x 2 5)
Calories
Copyright © Holt McDougal. All rights reserved.
y 30
O
y
11.
y 4 3 2 1
c. The x-intercept represents the number of small
g.
ANSWERS
Performance Assessment
Quiz 2
y 700 650 600 550 500 450 400
0
0 10 20 30 40 50 x Fat (g)
20. The scatter plot shows a positive correlation.
As the grams of fat increased, the number of calories tends to increase.
3 3 6. y 2 4 5 }(x 2 6) or y 2 1 5 }(x 2 2) 4 4 7. 3x 1 y 5 3 8. x 2 y 5 2 9. an 5 218 1 (n 2 1)13; 1269
Algebra 1 Assessment Book
A11
Chapter 5, continued 22. 520 calories 23. 8 24. 23 25. 2
y 700 650 600 550 500 450 400
0
0 10 20 30 40 50 x Fat (g)
Chapter Test C 7 4 1. y 5 2} x 1 4 2. y 2 3 5 2}(x 1 1) 5 6 9 3. F(C) 5 } C 1 32 4. f (x) 5 23x 2 7 5 7 1 5. f (x) 5 2} x 2 } 2 4 6.
Chapter Test B 28
4 1. y 5 } x 2 5 2. y 5 2x 2 1 3
7.
y 4 2 24
O
2 4 x
2
24
1 23 22
3. y 5 2.45x 1 15.50 4. $52.25 5. A 5 4 6. B 5 21 8.
3 2 1 22
O
1 2
3
4 x
24
22 23
22
O 22 23
y 1 3 5 4(x 2 2) 11. arithmetic; 241, 252 12. not arithmetic; There is no common difference. 13. 2x 1 2y 5 10 14. 4x 1 y 5 5 15. 5x 1 4y 5 214 16. y 5 5 17. 0.05n 1 0.25q 5 3.80 18. Sample answers:
26 nickels and 10 quarters; 1 nickel and 15 2 15 quarters 19. Parallel: y 5 2}7 x 2 } ; 7 7
Perpendicular: y 5 }2 x 1 13
Calories
y 700
650 600 550 500 450 400
As the grams of fat increase, the number of calories tends to increase. 22. y 5 11x 1 211 23. 24. 519 calories y Calories
12. 2x 2 5y 5 10 13. y 5 22 14. x 5 4 15. x 1 2y 5 6 16. The figure is not a right 1 5 4 triangle because the slopes are 2}3, 2}9, and }6 ,
none of which are negative reciprocals. 17.
y 36 32 28 24 20 16
0
0 2.0
2.5
3.0
3.5
4.0 x
Weight (thousands of pounds)
18. The scatter plot shows a negative correlation.
As the weight of the car increases, the gas mileage tends to decrease. 19. y 5 28x 1 49 20. 22 mi/gal 21. x ø 6; There will be no gas mileage for a car that weighs 6000 pounds. 1. D 2. B 3. C 4. D 5. A 6. B 7. D 8. C
0 10 20 30 40 50 x
21. The scatter plot shows a positive correlation.
700 650 600 550 500 450 400 0 10 20 30 40 50 x Fat (g)
A12
11. an 5 12.7 1 (n 2 1)1.8; 190.9
Standardized Test A
Fat (g)
0
3 x
10. an 5 14 1 (n 2 1)(216); 21570 1 2 x
4 for each increase of 1 in the x-value. 10. Sample answer:
0
1 2
9. k 5 1; Sample answer: y 2 2 5 2(x 2 2)
9. The y-values increase at a constant rate of
20.
O
8. k 5 28; Sample answer: y 2 1 5 22(x 1 2)
y 3 2 1
Miles per gallon
y
7.
y 5 4 3
Algebra 1 Assessment Book
9. A 10. A 11. D 12. B 13. D 14. 24 15. a. The situation can be modeled by a linear
equation because the cost increases by a constant amount. b. $210 c. $40 16. a. y 5 2.5x 1 10 b. y 5 2.5x 1 5 c. The graphs are linear and have the same slope of 2.5. This means that the graphs are parallel. d. Regardless of the number of movies rented, the difference will always be $5. Each person pays the same amount per rental. The only difference is in the registration fee.
Copyright © Holt McDougal. All rights reserved.
ANSWERS
Calories
21.
Related Documents c2h70
Holt Algebra 1_chapter 05 Test.pdf 1684t
December 2019 60
Holt Algebra 1_chapter 01 Test.pdf 6x2hf
December 2021 0
Holt Algebra 1_chapter 11_standardized Test 1u6v5y
December 2021 0
Holt Algebra 1_chapter 03 Test 32s2e
December 2021 0
Holt Algebra 1_chapter 11_quiz 2 x6m1j
December 2021 0
Holt Algebra 1_chapter 05_quiz 1 4k3v4n
November 2021 0More Documents from "Stanley Guo" 64t1n
Holt Algebra 1_chapter 5 Test 354e5p
November 2021 0
Holt Algebra 1_chapter 05 Test.pdf 1684t
December 2019 60
Holt Algebra 1_chapter 05_quiz 1 4k3v4n
November 2021 0
Holt Algebra 1_chapter 06 Test.pdf 6u6t3x
December 2021 0
Ez Reader Doc Pdf Lite Jar 2t3dw
December 2019 74