Garrison 13th Edition Chapter 9 486i5v
This document was ed by and they confirmed that they have the permission to share it. If you are author or own the copyright of this book, please report to us by using this report form. Report 2z6p3t
Overview 5o1f4z
& View Garrison 13th Edition Chapter 9 as PDF for free.
More details 6z3438
- Words: 2,283
- Pages: 18
Chapter 9 Profit Planning
Exercise 9-1 (20 minutes) April
1.
May
June
Total
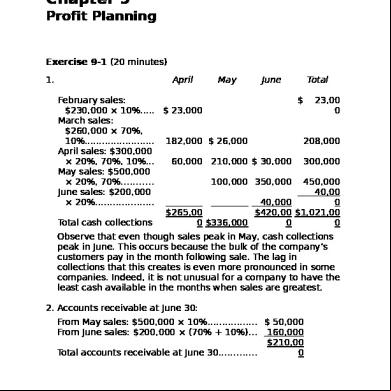
February sales: $ 23,00 $230,000 × 10%..... $ 23,000 0 March sales: $260,000 × 70%, 10%........................ 182,000 $ 26,000 208,000 April sales: $300,000 × 20%, 70%, 10%... 60,000 210,000 $ 30,000 300,000 May sales: $500,000 × 20%, 70%........... 100,000 350,000 450,000 June sales: $200,000 40,00 × 20%.................... 40,000 0 $265,00 $420,00 $1,021,00 Total cash collections 0 $336,000 0 0 Observe that even though sales peak in May, cash collections peak in June. This occurs because the bulk of the company’s customers pay in the month following sale. The lag in collections that this creates is even more pronounced in some companies. Indeed, it is not unusual for a company to have the least cash available in the months when sales are greatest. 2. s receivable at June 30: From May sales: $500,000 × 10%................. $ 50,000 From June sales: $200,000 × (70% + 10%)... 160,000 $210,00 Total s receivable at June 30............. 0
© The McGraw-Hill Companies, Inc., 2010. All rights reserved. Solutions Manual, Chapter 9
1
Exercise 9-2 (10 minutes)
Budgeted sales in units....... Add desired ending inventory*........................ Total needs.......................... Less beginning inventory.... Required production............
Quarte April May June r 215,00 50,000 75,000 90,000 0 7,500
9,000
8,000
8,000 223,00 57,500 84,000 98,000 0 5,000 7,500 9,000 5,000 218,00 52,500 76,500 89,000 0
*10% of the following month’s sales in units.
© The McGraw-Hill Companies, Inc., 2010. All rights reserved. 2
Managerial ing, 13th Edition
Exercise 9-3 (15 minutes) Year 2 Year 3 First Second Third Fourth First Required production in bottles.............. 60,000 90,000 150,000 100,000 70,000 Number of grams per bottle.................. × 3 × 3 × 3 × 3 × 3 Total production needs—grams............. 180,000 270,000 450,000 300,000 210,000 First
Second
Year 2 Third
Fourth
Production needs—grams (above)......... 180,000 270,000 450,000 300,000 Add desired ending inventory—grams... 54,000 90,000 60,000 42,000 Total needs—grams............................... 234,000 360,000 510,000 342,000 Less beginning inventory—grams......... 36,000 54,000 90,000 60,000 Raw materials to be purchased—grams 198,000 306,000 420,000 282,000 Cost of raw materials to be purchased at 150 roubles per kilogram................ 29,700 45,900 63,000 42,300
Year 1,200,00 0 42,000 1,242,00 0 36,000 1,206,00 0 180,90 0
© The McGraw-Hill Companies, Inc., 2010. All rights reserved. Solutions Manual, Chapter 9
3
Exercise 9-4 (20 minutes) 1. Assuming that the direct labor workforce is adjusted each quarter, the direct labor budget is:
Units to be produced................................ Direct labor time per unit (hours)............. Total direct labor-hours needed............... Direct labor cost per hour......................... Total direct labor cost..............................
1st 2nd 3rd 4th Quarter Quarter Quarter Quarter Year 8,000 6,500 7,000 7,500 29,000 × 0.35 × 0.35 × 0.35 × 0.35 × 0.35 2,800 2,275 2,450 2,625 10,150 × × × × × $12.00 $12.00 $12.00 $12.00 $12.00 $ 33,60 $ 29,40 $ 31,50 $121,80 0 $ 27,300 0 0 0
2. Assuming that the direct labor workforce is not adjusted each quarter and that overtime wages are paid, the direct labor budget is:
Units to be produced............................... Direct labor time per unit (hours)............ Total direct labor-hours needed.............. Regular hours paid.................................. Overtime hours paid................................
1st 2nd 3rd 4th Quarter Quarter Quarter Quarter 8,000 6,500 7,000 7,500 × 0.35 × 0.35 × 0.35 × 0.35 2,800 2,275 2,450 2,625 2,600 2,600 2,600 2,600 200 0 0 25
Year
Wages for regular hours (@ $12.00 per $124,80 hour)..................................................... $31,200 $31,200 $31,200 $31,200 0 Overtime wages (@ 1.5 × $12.00 per hour)..................................................... 3,600 0 0 450 4,050 Total direct labor cost............................. $34,800 $31,200 $31,200 $31,650 $128,85 © The McGraw-Hill Companies, Inc., 2010. All rights reserved. 4
Managerial ing, 13th Edition
0
© The McGraw-Hill Companies, Inc., 2010. All rights reserved. Solutions Manual, Chapter 9
5
Exercise 9-5 (15 minutes) 1.
Yuvwell Corporation Manufacturing Overhead Budget
Budgeted direct labor-hours........................ Variable overhead rate................................ Variable manufacturing overhead................ Fixed manufacturing overhead.................... Total manufacturing overhead..................... Less depreciation......................................... Cash disbursements for manufacturing overhead...................................................
1st 2nd 3rd 4th Quarte Quarte Quarte Quarte r r r r Year 8,000 8,200 8,500 7,800 32,500 × $3.25 × $3.25 × $3.25 × $3.25 × $3.25 $26,00 $26,65 $27,62 $25,35 $105,62 0 0 5 0 5 192,00 48,000 48,000 48,000 48,000 0 74,000 74,650 75,625 73,350 297,625 64,00 16,000 16,000 16,000 16,000 0 $58,00 $58,65 $59,62 $57,35 $233,62 0 0 5 0 5
Total budgeted manufacturing overhead for the 2. year (a)................................................................. Total budgeted direct labor-hours for the year (b). . Manufacturing overhead rate for the year (a) ÷ (b)
$297,625 32,500 $ 9.16
© The McGraw-Hill Companies, Inc., 2010. All rights reserved. 6
Managerial ing, 13th Edition
Exercise 9-6 (15 minutes) Weller Company Selling and istrative Expense Budget 1st 2nd Quarter Quarter Budgeted unit sales.................................... 15,000 16,000 Variable selling and istrative × × expense per unit....................................... $2.50 $2.50 $ 37,50 $ Variable expense......................................... 0 40,000 Fixed selling and istrative expenses: Advertising............................................... 8,000 8,000 Executive salaries..................................... 35,000 35,000 Insurance.................................................. 5,000 Property taxes.......................................... 8,000 20,00 20,00 Depreciation............................................. 0 0 68,00 71,00 Total fixed expense..................................... 0 0 Total selling and istrative expenses... 105,500 111,000 20,00 20,00 Less depreciation........................................ 0 0 Cash disbursements for selling and $ 85,50 $ 91,00 istrative expenses........................... 0 0
3rd 4th Quarter Quarter Year 14,000 13,000 58,000 × × $2.50 $2.50 × $2.50 $ $ $145,00 35,000 32,500 0 8,000 35,000 5,000 20,00 0 68,00 0 103,000 20,00 0 $ 83,00 0
8,000 32,000 35,000 140,000 10,000 8,000 20,00 0 80,000 63,00 0 270,000 95,500 415,000 20,00 0 80,000 $ 75,50 $335,00 0 0
© The McGraw-Hill Companies, Inc., 2010. All rights reserved. Solutions Manual, Chapter 9
7
Exercise 9-7 (15 minutes) Garden Depot Cash Budget
Cash balance, beginning.............. Total cash receipts. . Total cash available. Less total cash disbursements....... Excess (deficiency) of cash available over disbursements....... Financing: Borrowings (at beginnings of quarters)*........... Repayments (at ends of quarters) Interest§.................
1st Quarte r $ 20,00 0 180,00 0 200,00 0 260,00 0
2nd Quarte r $ 10,00 0 330,00 0 340,00 0 230,00 0
(60,000 110,00 ) 0
3rd 4th Quarter Quarter Year $ 35,80 $ 25,80 $ 20,00 0 0 0 210,00 950,00 0 230,000 0 245,800 255,800 970,000 220,00 950,00 0 240,000 0 25,80 0
70,000
70,00 Total financing......... 0 Cash balance, $ 10,00 ending................... 0
15,800
20,00 0
70,000 (70,000) (70,000) (4,200 (4,200 ) ) (74,200 (4,200 ) ) $ 35,80 $ 25,80 $ 15,80 0 0 $ 15,800 0
* Since the deficiency of cash available over disbursements is $60,000, the company must borrow $70,000 to maintain the desired ending cash balance of $10,000. §
$70,000 × 3% × 2 = $4,200.
© The McGraw-Hill Companies, Inc., 2010. All rights reserved. 8
Managerial ing, 13th Edition
Exercise 9-8 (10 minutes) Gig Harbor Boating Budgeted Income Statement Sales (460 units × $1,950 per unit)............... Cost of goods sold (460 units × $1,575 per unit)............................................................ Gross margin................................................. Selling and istrative expenses*........... Net operating income.................................... Interest expense........................................... Net income....................................................
$897,00 0 724,500 172,500 139,500 33,000 14,000 $ 19,000
* (460 units × $75 per unit) + $105,000 = $139,500.
© The McGraw-Hill Companies, Inc., 2010. All rights reserved. Solutions Manual, Chapter 9
9
Exercise 9-9 (15 minutes) Mecca Copy Budgeted Balance Sheet Assets
Current assets: Cash*............................................ s receivable...................... Supplies inventory........................ Total current assets........................ Plant and equipment: Equipment.................................... Accumulated depreciation............ Plant and equipment, net................ Total assets..................................... Liabilities and Stockholders' Equity Current liabilities: s payable......................... Stockholders' equity: Common stock.............................. Retained earnings#...................... Total stockholders' equity............... Total liabilities and stockholders' equity...........................................
$12,200 8,100 3,200 34,000 (16,000)
$23,500
18,000 $41,500
$ 1,800 $ 5,000 34,700
39,700 $41,500
* Plug figure. Retained earnings, beginning # balance....................................... Add net income............................. Deduct dividends.......................... Retained earnings, ending balance.......................................
$28,000 11,500 39,500 4,800 $34,700
© The McGraw-Hill Companies, Inc., 2010. All rights reserved. 10
Managerial ing, 13th Edition
Exercise 9-10 (20 minutes)
Cash balance, beginning....................... Add collections from customers............ Total cash available............................... Less disbursements: Purchase of inventory......................... Selling and istrative expenses... Equipment purchases......................... Dividends............................................ Total disbursements.............................. Excess (deficiency) of cash available over disbursements............................ Financing: Borrowings.......................................... Repayments (including interest)......... Total financing....................................... Cash balance, ending............................
Quarter (000 omitted) 1 2 3 4 $ 6 * $ 5 $ 5 $ 5 65 70 96 * 92 71 * 75 101 97 35 * 28 8* 2* 73
45 30 8 2 85
(2)*
(10)
7 0 7 $ 5
* * * * *
15 * 0 15 $ 5
48 30 * 10 * 2* 90
35 * 25 10 2* 72
11 *
25
0 (6) (6) $ 5
Year $ 6 323 * 329 163 113 * 36 * 8 320 9
0 22 (17)* (23) (17) (1) $ 8 $ 8
*Given.
© The McGraw-Hill Companies, Inc., 2010. All rights reserved. Solutions Manual, Chapter 9
11
Exercise 9-11 (30 minutes) 1.
Gaeber Industries Production Budget
Budgeted unit sales........... Add desired ending inventory........................ Total units needed............. Less beginning inventory. . Required production..........
1st Quarter 8,000 1,400
2nd Quarter 7,000 1,200
3rd Quarter 6,000 1,400
4th Quarter 7,000 1,700
Year 28,000 1,700
9,400 1,600 7,800
8,200 1,400 6,800
7,400 1,200 6,200
8,700 1,400 7,300
29,700 1,600 28,100
© The McGraw-Hill Companies, Inc., 2010. All rights reserved. 12
Managerial ing, 13th Edition
Exercise 9-11 (continued) 2.
Gaeber Industries Direct Materials Budget
Required production..................... Raw materials per unit................. Production needs.......................... Add desired ending inventory....... Total needs.................................. Less beginning inventory............. Raw materials to be purchased.... Cost of raw materials to be purchased at $4.00 per pound...
1st Quarter 7,800 ×2 15,600 2,720 18,320 3,120 15,200
2nd Quarter 6,800 ×2 13,600 2,480 16,080 2,720 13,360
3rd Quarter 6,200 ×2 12,400 2,920 15,320 2,480 12,840
4th Quarter 7,300 ×2 14,600 3,140 17,740 2,920 14,820
$60,800
$53,440
$51,360
$59,280 $224,880
Year 28,100 ×2 56,200 3,140 59,340 3,120 56,220
Schedule of Expected Cash Disbursements for Materials s payable, beginning balance...................................... 1st Quarter purchases.................. 2nd Quarter purchases................. 3rd Quarter purchases................. 4th Quarter purchases................. Total cash disbursements for materials....................................
$14,820 45,600
$60,420
$15,200 40,080
$55,280
$13,360 38,520 $51,880
$ 14,820 60,800 53,440 $12,840 51,360 44,460 44,460 $57,300 $224,880
© The McGraw-Hill Companies, Inc., 2010. All rights reserved. Solutions Manual, Chapter 9
13
Exercise 9-12 (30 minutes) 1.
Jessi Corporation Sales Budget 1st 2nd 3rd 4th Quarter Quarter Quarter Quarter Year Budgeted unit sales........... 11,000 12,000 14,000 13,000 50,000 Selling price per unit......... × $18.00 × $18.00 × $18.00 × $18.00 × $18.00 $198,00 $216,00 $252,00 $234,00 $900,00 Total sales......................... 0 0 0 0 0 Schedule of Expected Cash Collections s receivable, beginning balance.......... $ 70,200 st 1 Quarter sales................ 128,700 $ 59,400 2nd Quarter sales............... 140,400 $ 64,800 rd 3 Quarter sales................ 163,800 $ 75,600 th 4 Quarter sales................ 152,100 $198,90 $199,80 $228,60 $227,70 Total cash collections........ 0 0 0 0
© The McGraw-Hill Companies, Inc., 2010. All rights reserved. 14
Managerial ing, 13th Edition
$ 70,200 188,100 205,200 239,400 152,100 $855,00 0
Exercise 9-12 (continued) 2.
Jessi Corporation Production Budget
Budgeted unit sales........... Add desired ending inventory........................ Total units needed............. Less beginning inventory. . Required production..........
1st Quarter 11,000
2nd Quarter 12,000
3rd Quarter 14,000
4th Quarter 13,000
Year 50,000
1,800 12,800 1,650 11,150
2,100 14,100 1,800 12,300
1,950 15,950 2,100 13,850
1,850 14,850 1,950 12,900
1,850 51,850 1,650 50,200
© The McGraw-Hill Companies, Inc., 2010. All rights reserved. Solutions Manual, Chapter 9
15
Exercise 9-13 (30 minutes) 1.
Hareston Company Direct Materials Budget 1st 2nd 3rd 4th Quarter Quarter Quarter Quarter 7,000 8,000 6,000 5,000 ×2 ×2 ×2 ×2 14,000 16,000 12,000 10,000 1,600 1,200 1,000 1,500 15,600 17,200 13,000 11,500 1,400 1,600 1,200 1,000 14,200 15,600 11,800 10,500
Required production........................ Raw materials per unit.................... Production needs............................. Add desired ending inventory.......... Total needs..................................... Less beginning inventory................ Raw materials to be purchased....... Cost of raw materials to be purchased at $1.40 per pound...... $19,880 $21,840 $16,520 $14,700
Year 26,000 ×2 52,000 1,500 53,500 1,400 52,100 $72,940
Schedule of Expected Cash Disbursements for Materials s payable, beginning balance......................................... $ 2,940 1st Quarter purchases..................... 15,904 $ 3,976 2nd Quarter purchases.................... 17,472 $ 4,368 3rd Quarter purchases.................... 13,216 $ 3,304 4th Quarter purchases.................... 11,760 Total cash disbursements for materials....................................... $18,844 $21,448 $17,584 $15,064
© The McGraw-Hill Companies, Inc., 2010. All rights reserved. 16
Managerial ing, 13th Edition
$ 2,940 19,880 21,840 16,520 11,760 $72,940
Exercise 9-13 (continued) 2.
Hareston Company Direct Labor Budget
Units to be produced.................... Direct labor time per unit (hours). Total direct labor-hours needed. . .
1st Quarter 7,000 × 0.60
2nd Quarter 8,000 × 0.60
3rd Quarter 6,000 × 0.60
4th Quarter 5,000 × 0.60
Year 26,000 × 0.60
4,200 4,800 3,600 3,000 15,600 Direct labor cost per hour............. × $14.00 × $14.00 × $14.00 × $14.00 × $14.00 Total direct labor cost.................. $ 58,800 $ 67,200 $ 50,400 $ 42,000 $218,400
© The McGraw-Hill Companies, Inc., 2010. All rights reserved. Solutions Manual, Chapter 9
17
Exercise 9-14 (30 minutes) 1.
Raredon Corporation Direct Labor Budget
Units to be produced.................... Direct labor time per unit (hours). Total direct labor-hours needed. . . Direct labor cost per hour............. Total direct labor cost.................. 2.
1st 2nd 3rd 4th Quarter Quarter Quarter Quarter Year 12,000 14,000 13,000 11,000 50,000 × 0.70 × 0.70 × 0.70 × 0.70 × 0.70 8,400 9,800 9,100 7,700 35,000 × $10.50 × $10.50 × $10.50 × $10.50 × $10.50 $ 88,200 $102,900 $ 95,550 $ 80,850 $367,500
Raredon Corporation Manufacturing Overhead Budget
Budgeted direct labor-hours......... Variable overhead rate................. Variable manufacturing overhead Fixed manufacturing overhead..... Total manufacturing overhead..... Less depreciation......................... Cash disbursements for manufacturing overhead............
1st Quarter 8,400 × $1.50 $12,600 80,000 92,600 22,000
2nd Quarter 9,800 × $1.50 $14,700 80,000 94,700 22,000
3rd Quarter 9,100 × $1.50 $13,650 80,000 93,650 22,000
4th Quarter 7,700 × $1.50 $11,550 80,000 91,550 22,000
$70,600
$72,700
$71,650
$69,550 $284,500
© The McGraw-Hill Companies, Inc., 2010. All rights reserved. 18
Managerial ing, 13th Edition
Year 35,000 × $1.50 $ 52,500 320,000 372,500 88,000
Exercise 9-1 (20 minutes) April
1.
May
June
Total
February sales: $ 23,00 $230,000 × 10%..... $ 23,000 0 March sales: $260,000 × 70%, 10%........................ 182,000 $ 26,000 208,000 April sales: $300,000 × 20%, 70%, 10%... 60,000 210,000 $ 30,000 300,000 May sales: $500,000 × 20%, 70%........... 100,000 350,000 450,000 June sales: $200,000 40,00 × 20%.................... 40,000 0 $265,00 $420,00 $1,021,00 Total cash collections 0 $336,000 0 0 Observe that even though sales peak in May, cash collections peak in June. This occurs because the bulk of the company’s customers pay in the month following sale. The lag in collections that this creates is even more pronounced in some companies. Indeed, it is not unusual for a company to have the least cash available in the months when sales are greatest. 2. s receivable at June 30: From May sales: $500,000 × 10%................. $ 50,000 From June sales: $200,000 × (70% + 10%)... 160,000 $210,00 Total s receivable at June 30............. 0
© The McGraw-Hill Companies, Inc., 2010. All rights reserved. Solutions Manual, Chapter 9
1
Exercise 9-2 (10 minutes)
Budgeted sales in units....... Add desired ending inventory*........................ Total needs.......................... Less beginning inventory.... Required production............
Quarte April May June r 215,00 50,000 75,000 90,000 0 7,500
9,000
8,000
8,000 223,00 57,500 84,000 98,000 0 5,000 7,500 9,000 5,000 218,00 52,500 76,500 89,000 0
*10% of the following month’s sales in units.
© The McGraw-Hill Companies, Inc., 2010. All rights reserved. 2
Managerial ing, 13th Edition
Exercise 9-3 (15 minutes) Year 2 Year 3 First Second Third Fourth First Required production in bottles.............. 60,000 90,000 150,000 100,000 70,000 Number of grams per bottle.................. × 3 × 3 × 3 × 3 × 3 Total production needs—grams............. 180,000 270,000 450,000 300,000 210,000 First
Second
Year 2 Third
Fourth
Production needs—grams (above)......... 180,000 270,000 450,000 300,000 Add desired ending inventory—grams... 54,000 90,000 60,000 42,000 Total needs—grams............................... 234,000 360,000 510,000 342,000 Less beginning inventory—grams......... 36,000 54,000 90,000 60,000 Raw materials to be purchased—grams 198,000 306,000 420,000 282,000 Cost of raw materials to be purchased at 150 roubles per kilogram................ 29,700 45,900 63,000 42,300
Year 1,200,00 0 42,000 1,242,00 0 36,000 1,206,00 0 180,90 0
© The McGraw-Hill Companies, Inc., 2010. All rights reserved. Solutions Manual, Chapter 9
3
Exercise 9-4 (20 minutes) 1. Assuming that the direct labor workforce is adjusted each quarter, the direct labor budget is:
Units to be produced................................ Direct labor time per unit (hours)............. Total direct labor-hours needed............... Direct labor cost per hour......................... Total direct labor cost..............................
1st 2nd 3rd 4th Quarter Quarter Quarter Quarter Year 8,000 6,500 7,000 7,500 29,000 × 0.35 × 0.35 × 0.35 × 0.35 × 0.35 2,800 2,275 2,450 2,625 10,150 × × × × × $12.00 $12.00 $12.00 $12.00 $12.00 $ 33,60 $ 29,40 $ 31,50 $121,80 0 $ 27,300 0 0 0
2. Assuming that the direct labor workforce is not adjusted each quarter and that overtime wages are paid, the direct labor budget is:
Units to be produced............................... Direct labor time per unit (hours)............ Total direct labor-hours needed.............. Regular hours paid.................................. Overtime hours paid................................
1st 2nd 3rd 4th Quarter Quarter Quarter Quarter 8,000 6,500 7,000 7,500 × 0.35 × 0.35 × 0.35 × 0.35 2,800 2,275 2,450 2,625 2,600 2,600 2,600 2,600 200 0 0 25
Year
Wages for regular hours (@ $12.00 per $124,80 hour)..................................................... $31,200 $31,200 $31,200 $31,200 0 Overtime wages (@ 1.5 × $12.00 per hour)..................................................... 3,600 0 0 450 4,050 Total direct labor cost............................. $34,800 $31,200 $31,200 $31,650 $128,85 © The McGraw-Hill Companies, Inc., 2010. All rights reserved. 4
Managerial ing, 13th Edition
0
© The McGraw-Hill Companies, Inc., 2010. All rights reserved. Solutions Manual, Chapter 9
5
Exercise 9-5 (15 minutes) 1.
Yuvwell Corporation Manufacturing Overhead Budget
Budgeted direct labor-hours........................ Variable overhead rate................................ Variable manufacturing overhead................ Fixed manufacturing overhead.................... Total manufacturing overhead..................... Less depreciation......................................... Cash disbursements for manufacturing overhead...................................................
1st 2nd 3rd 4th Quarte Quarte Quarte Quarte r r r r Year 8,000 8,200 8,500 7,800 32,500 × $3.25 × $3.25 × $3.25 × $3.25 × $3.25 $26,00 $26,65 $27,62 $25,35 $105,62 0 0 5 0 5 192,00 48,000 48,000 48,000 48,000 0 74,000 74,650 75,625 73,350 297,625 64,00 16,000 16,000 16,000 16,000 0 $58,00 $58,65 $59,62 $57,35 $233,62 0 0 5 0 5
Total budgeted manufacturing overhead for the 2. year (a)................................................................. Total budgeted direct labor-hours for the year (b). . Manufacturing overhead rate for the year (a) ÷ (b)
$297,625 32,500 $ 9.16
© The McGraw-Hill Companies, Inc., 2010. All rights reserved. 6
Managerial ing, 13th Edition
Exercise 9-6 (15 minutes) Weller Company Selling and istrative Expense Budget 1st 2nd Quarter Quarter Budgeted unit sales.................................... 15,000 16,000 Variable selling and istrative × × expense per unit....................................... $2.50 $2.50 $ 37,50 $ Variable expense......................................... 0 40,000 Fixed selling and istrative expenses: Advertising............................................... 8,000 8,000 Executive salaries..................................... 35,000 35,000 Insurance.................................................. 5,000 Property taxes.......................................... 8,000 20,00 20,00 Depreciation............................................. 0 0 68,00 71,00 Total fixed expense..................................... 0 0 Total selling and istrative expenses... 105,500 111,000 20,00 20,00 Less depreciation........................................ 0 0 Cash disbursements for selling and $ 85,50 $ 91,00 istrative expenses........................... 0 0
3rd 4th Quarter Quarter Year 14,000 13,000 58,000 × × $2.50 $2.50 × $2.50 $ $ $145,00 35,000 32,500 0 8,000 35,000 5,000 20,00 0 68,00 0 103,000 20,00 0 $ 83,00 0
8,000 32,000 35,000 140,000 10,000 8,000 20,00 0 80,000 63,00 0 270,000 95,500 415,000 20,00 0 80,000 $ 75,50 $335,00 0 0
© The McGraw-Hill Companies, Inc., 2010. All rights reserved. Solutions Manual, Chapter 9
7
Exercise 9-7 (15 minutes) Garden Depot Cash Budget
Cash balance, beginning.............. Total cash receipts. . Total cash available. Less total cash disbursements....... Excess (deficiency) of cash available over disbursements....... Financing: Borrowings (at beginnings of quarters)*........... Repayments (at ends of quarters) Interest§.................
1st Quarte r $ 20,00 0 180,00 0 200,00 0 260,00 0
2nd Quarte r $ 10,00 0 330,00 0 340,00 0 230,00 0
(60,000 110,00 ) 0
3rd 4th Quarter Quarter Year $ 35,80 $ 25,80 $ 20,00 0 0 0 210,00 950,00 0 230,000 0 245,800 255,800 970,000 220,00 950,00 0 240,000 0 25,80 0
70,000
70,00 Total financing......... 0 Cash balance, $ 10,00 ending................... 0
15,800
20,00 0
70,000 (70,000) (70,000) (4,200 (4,200 ) ) (74,200 (4,200 ) ) $ 35,80 $ 25,80 $ 15,80 0 0 $ 15,800 0
* Since the deficiency of cash available over disbursements is $60,000, the company must borrow $70,000 to maintain the desired ending cash balance of $10,000. §
$70,000 × 3% × 2 = $4,200.
© The McGraw-Hill Companies, Inc., 2010. All rights reserved. 8
Managerial ing, 13th Edition
Exercise 9-8 (10 minutes) Gig Harbor Boating Budgeted Income Statement Sales (460 units × $1,950 per unit)............... Cost of goods sold (460 units × $1,575 per unit)............................................................ Gross margin................................................. Selling and istrative expenses*........... Net operating income.................................... Interest expense........................................... Net income....................................................
$897,00 0 724,500 172,500 139,500 33,000 14,000 $ 19,000
* (460 units × $75 per unit) + $105,000 = $139,500.
© The McGraw-Hill Companies, Inc., 2010. All rights reserved. Solutions Manual, Chapter 9
9
Exercise 9-9 (15 minutes) Mecca Copy Budgeted Balance Sheet Assets
Current assets: Cash*............................................ s receivable...................... Supplies inventory........................ Total current assets........................ Plant and equipment: Equipment.................................... Accumulated depreciation............ Plant and equipment, net................ Total assets..................................... Liabilities and Stockholders' Equity Current liabilities: s payable......................... Stockholders' equity: Common stock.............................. Retained earnings#...................... Total stockholders' equity............... Total liabilities and stockholders' equity...........................................
$12,200 8,100 3,200 34,000 (16,000)
$23,500
18,000 $41,500
$ 1,800 $ 5,000 34,700
39,700 $41,500
* Plug figure. Retained earnings, beginning # balance....................................... Add net income............................. Deduct dividends.......................... Retained earnings, ending balance.......................................
$28,000 11,500 39,500 4,800 $34,700
© The McGraw-Hill Companies, Inc., 2010. All rights reserved. 10
Managerial ing, 13th Edition
Exercise 9-10 (20 minutes)
Cash balance, beginning....................... Add collections from customers............ Total cash available............................... Less disbursements: Purchase of inventory......................... Selling and istrative expenses... Equipment purchases......................... Dividends............................................ Total disbursements.............................. Excess (deficiency) of cash available over disbursements............................ Financing: Borrowings.......................................... Repayments (including interest)......... Total financing....................................... Cash balance, ending............................
Quarter (000 omitted) 1 2 3 4 $ 6 * $ 5 $ 5 $ 5 65 70 96 * 92 71 * 75 101 97 35 * 28 8* 2* 73
45 30 8 2 85
(2)*
(10)
7 0 7 $ 5
* * * * *
15 * 0 15 $ 5
48 30 * 10 * 2* 90
35 * 25 10 2* 72
11 *
25
0 (6) (6) $ 5
Year $ 6 323 * 329 163 113 * 36 * 8 320 9
0 22 (17)* (23) (17) (1) $ 8 $ 8
*Given.
© The McGraw-Hill Companies, Inc., 2010. All rights reserved. Solutions Manual, Chapter 9
11
Exercise 9-11 (30 minutes) 1.
Gaeber Industries Production Budget
Budgeted unit sales........... Add desired ending inventory........................ Total units needed............. Less beginning inventory. . Required production..........
1st Quarter 8,000 1,400
2nd Quarter 7,000 1,200
3rd Quarter 6,000 1,400
4th Quarter 7,000 1,700
Year 28,000 1,700
9,400 1,600 7,800
8,200 1,400 6,800
7,400 1,200 6,200
8,700 1,400 7,300
29,700 1,600 28,100
© The McGraw-Hill Companies, Inc., 2010. All rights reserved. 12
Managerial ing, 13th Edition
Exercise 9-11 (continued) 2.
Gaeber Industries Direct Materials Budget
Required production..................... Raw materials per unit................. Production needs.......................... Add desired ending inventory....... Total needs.................................. Less beginning inventory............. Raw materials to be purchased.... Cost of raw materials to be purchased at $4.00 per pound...
1st Quarter 7,800 ×2 15,600 2,720 18,320 3,120 15,200
2nd Quarter 6,800 ×2 13,600 2,480 16,080 2,720 13,360
3rd Quarter 6,200 ×2 12,400 2,920 15,320 2,480 12,840
4th Quarter 7,300 ×2 14,600 3,140 17,740 2,920 14,820
$60,800
$53,440
$51,360
$59,280 $224,880
Year 28,100 ×2 56,200 3,140 59,340 3,120 56,220
Schedule of Expected Cash Disbursements for Materials s payable, beginning balance...................................... 1st Quarter purchases.................. 2nd Quarter purchases................. 3rd Quarter purchases................. 4th Quarter purchases................. Total cash disbursements for materials....................................
$14,820 45,600
$60,420
$15,200 40,080
$55,280
$13,360 38,520 $51,880
$ 14,820 60,800 53,440 $12,840 51,360 44,460 44,460 $57,300 $224,880
© The McGraw-Hill Companies, Inc., 2010. All rights reserved. Solutions Manual, Chapter 9
13
Exercise 9-12 (30 minutes) 1.
Jessi Corporation Sales Budget 1st 2nd 3rd 4th Quarter Quarter Quarter Quarter Year Budgeted unit sales........... 11,000 12,000 14,000 13,000 50,000 Selling price per unit......... × $18.00 × $18.00 × $18.00 × $18.00 × $18.00 $198,00 $216,00 $252,00 $234,00 $900,00 Total sales......................... 0 0 0 0 0 Schedule of Expected Cash Collections s receivable, beginning balance.......... $ 70,200 st 1 Quarter sales................ 128,700 $ 59,400 2nd Quarter sales............... 140,400 $ 64,800 rd 3 Quarter sales................ 163,800 $ 75,600 th 4 Quarter sales................ 152,100 $198,90 $199,80 $228,60 $227,70 Total cash collections........ 0 0 0 0
© The McGraw-Hill Companies, Inc., 2010. All rights reserved. 14
Managerial ing, 13th Edition
$ 70,200 188,100 205,200 239,400 152,100 $855,00 0
Exercise 9-12 (continued) 2.
Jessi Corporation Production Budget
Budgeted unit sales........... Add desired ending inventory........................ Total units needed............. Less beginning inventory. . Required production..........
1st Quarter 11,000
2nd Quarter 12,000
3rd Quarter 14,000
4th Quarter 13,000
Year 50,000
1,800 12,800 1,650 11,150
2,100 14,100 1,800 12,300
1,950 15,950 2,100 13,850
1,850 14,850 1,950 12,900
1,850 51,850 1,650 50,200
© The McGraw-Hill Companies, Inc., 2010. All rights reserved. Solutions Manual, Chapter 9
15
Exercise 9-13 (30 minutes) 1.
Hareston Company Direct Materials Budget 1st 2nd 3rd 4th Quarter Quarter Quarter Quarter 7,000 8,000 6,000 5,000 ×2 ×2 ×2 ×2 14,000 16,000 12,000 10,000 1,600 1,200 1,000 1,500 15,600 17,200 13,000 11,500 1,400 1,600 1,200 1,000 14,200 15,600 11,800 10,500
Required production........................ Raw materials per unit.................... Production needs............................. Add desired ending inventory.......... Total needs..................................... Less beginning inventory................ Raw materials to be purchased....... Cost of raw materials to be purchased at $1.40 per pound...... $19,880 $21,840 $16,520 $14,700
Year 26,000 ×2 52,000 1,500 53,500 1,400 52,100 $72,940
Schedule of Expected Cash Disbursements for Materials s payable, beginning balance......................................... $ 2,940 1st Quarter purchases..................... 15,904 $ 3,976 2nd Quarter purchases.................... 17,472 $ 4,368 3rd Quarter purchases.................... 13,216 $ 3,304 4th Quarter purchases.................... 11,760 Total cash disbursements for materials....................................... $18,844 $21,448 $17,584 $15,064
© The McGraw-Hill Companies, Inc., 2010. All rights reserved. 16
Managerial ing, 13th Edition
$ 2,940 19,880 21,840 16,520 11,760 $72,940
Exercise 9-13 (continued) 2.
Hareston Company Direct Labor Budget
Units to be produced.................... Direct labor time per unit (hours). Total direct labor-hours needed. . .
1st Quarter 7,000 × 0.60
2nd Quarter 8,000 × 0.60
3rd Quarter 6,000 × 0.60
4th Quarter 5,000 × 0.60
Year 26,000 × 0.60
4,200 4,800 3,600 3,000 15,600 Direct labor cost per hour............. × $14.00 × $14.00 × $14.00 × $14.00 × $14.00 Total direct labor cost.................. $ 58,800 $ 67,200 $ 50,400 $ 42,000 $218,400
© The McGraw-Hill Companies, Inc., 2010. All rights reserved. Solutions Manual, Chapter 9
17
Exercise 9-14 (30 minutes) 1.
Raredon Corporation Direct Labor Budget
Units to be produced.................... Direct labor time per unit (hours). Total direct labor-hours needed. . . Direct labor cost per hour............. Total direct labor cost.................. 2.
1st 2nd 3rd 4th Quarter Quarter Quarter Quarter Year 12,000 14,000 13,000 11,000 50,000 × 0.70 × 0.70 × 0.70 × 0.70 × 0.70 8,400 9,800 9,100 7,700 35,000 × $10.50 × $10.50 × $10.50 × $10.50 × $10.50 $ 88,200 $102,900 $ 95,550 $ 80,850 $367,500
Raredon Corporation Manufacturing Overhead Budget
Budgeted direct labor-hours......... Variable overhead rate................. Variable manufacturing overhead Fixed manufacturing overhead..... Total manufacturing overhead..... Less depreciation......................... Cash disbursements for manufacturing overhead............
1st Quarter 8,400 × $1.50 $12,600 80,000 92,600 22,000
2nd Quarter 9,800 × $1.50 $14,700 80,000 94,700 22,000
3rd Quarter 9,100 × $1.50 $13,650 80,000 93,650 22,000
4th Quarter 7,700 × $1.50 $11,550 80,000 91,550 22,000
$70,600
$72,700
$71,650
$69,550 $284,500
© The McGraw-Hill Companies, Inc., 2010. All rights reserved. 18
Managerial ing, 13th Edition
Year 35,000 × $1.50 $ 52,500 320,000 372,500 88,000
Related Documents c2h70
Garrison 13th Edition Chapter 9 486i5v
December 2019 41
13th Edition Chapter 4 Test Bank 6t1j62
November 2020 0
Wiley Organizational Behavior - Chapter 2 - 13th Edition 1d232x
December 2021 0
Technical Communication (13th Edition) 1c533n
October 2019 299
Squatter's Handbook (england) - 13th Edition 2w1f2n
October 2019 33
Dynamics 13th Edition Solutions (hibbeler) 4a5h69
July 2022 0More Documents from "Ali Haider" 435k2i

Shahkar By Riffat Siraj-urduinpage.com u6s2c
October 2019 72
Shehr E Yaran By Riffat Siraj-urduinpage.com 4g583s
October 2019 74
Ishq Ka Qaaf By Sarfaraz Ahmad Rahi.urduinpage.com 25185f
December 2019 43
Namal Episode 4 By Nimra Ahmad - Urduinpage.com 573t2n
May 2022 0
Aab E Hayat Episode 15 By Umera Ahmed - Zemtime.com 346k15
October 2019 119