Case Solution - Vershire Company 4i1h2l
This document was ed by and they confirmed that they have the permission to share it. If you are author or own the copyright of this book, please report to us by using this report form. Report 2z6p3t
Overview 5o1f4z
& View Case Solution - Vershire Company as PDF for free.
More details 6z3438
- Words: 2,087
- Pages: 6
1
several
shows
divi-
the
to
1
man-
with largest
the Exhibit Reporting
States.
of
company
packaging division-one
United
division.
the
in
Can
Aluminum
cans
Can
diversified
a
was
Aluminum the
for
beverage
the
Company chart
aluminum
including
Vershire
of
divisions, organization
the
ufacturers
major
1996
Company
In
Vershire
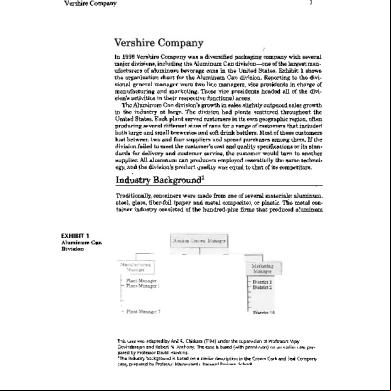
sional general manager were two line managers, vice presidents in charge of manufacturing and marketing. These vice presidents headed all of the division's activities in their respective functional areas.
The Aluminum Can division's growth in salesslightly outpacedsalesgrowth in the industry at large. The division had plants scattered throughout the United States. Each plant served customers in its own geographic region, often producing several different sizes of cans for a range of customers that included
both large and small breweries and soft drink bottlers. Most of these customers had between two and four suppliers and spread purchases among them. If the division failed to meet the customer's cost and quality speciijcations or its stan-
dards for delivery and customer service,the customer would turn to another supplier. All aluminum can producers employed essentially the same technology, and the division's product quality was equal to that of its competitors.
con-
aluminum,
metal
The
materials: plastic.
or
several
of
one composite),
from
made
metal
and
were (paper
fiber-foil
glass,
steel,
containers
Backgroundl
Traditionally,
Industry
tainer industry consisted of the hundred-plus firms that produced aluminum
EXHIBIT 1
AluminumCan
Vijay
Professors
of
supervision
the
(T'94)
Chitkar~
This case was adapted by Anil R.
under
Division
Hawkins.
David
Professor
by
pared
Govindarajanand RobertN. Anthony.The caseis based(with permission)on ~n earliercasepre-
Harvarn
Hamerm~h
Professor
by
prepared
case,
1Theindustry backgroundis basedon a similardescriptionin the Crown Cork and SealCompany R".inA" -:rh~1
2
Company
and tin-plated steel cans. Aluminum cans were used for packaging beverages (beer and soft drinks), while tin-plated steel cans were used primarily for food packaging, paints, and aerosols. In 1970, steel cans ed for 88 percent of metal
pri-
of were
percent
75 containers
over
the
for
had come to dominate
purchased
ed who
cans bottlers
aluminum
but by the 1990s aluminum
drink
soft
1996,
In production.
The
industry.
the can
the metal can production,
cost
64
it for
and
lines
five
ed
was typically
plant
container
materials
a Raw
for line.
scale per
efficient equipment
in
minimum
The
million
$20
ket.
marily small independent franchisees of Coca-Cola and Pepsi Cola, which represented their independent bottlers in negotiating with the container companies. Five beverage container manufacturers ed for 88 percent of the mar-
percent of the production cost. Other costs included labor (15 percent), marketing and general istration (9 percent), transportation (8 percent), depreciation (2 percent), and research and development (2 percent). For beverage processors, the cost of the can usually exceeded the cost of the contents, with the container ing for approximately 40 percent of the to-
tal manufacturing cost.Most beverageprocessorsmaintained two or more suppliers;
and
some
processors
integrated
backward,
manufacturing
cans
themselves.On~ large beveragecompany produced one-third of its own container requirements and ranked ducers in the industry.
as one of the top five beverage container
pro-
efficient,
a more
and
cup even
deep
a become
into had
pushed process
was
metal
of manufacturing
sheet the
flat
a
producing
1996
By
which
in attached.
process was
top
piece
Prior to the early 1970s, cans were produced by rolling a sheet of steel, soldering and cutting it to size, and attaching both the top and the bottom. In 1972 the industry was revolutionized when aluminum producers perfected a two-
over 2,000 cans per minute.
In addition to production efficiency,aluminum had other advantagesover
a
was
reduced
it
and
it pernlitted
aluminum
lithograph;
to
of flavoring;
Additionally;
easier
was
weight.
it lighter
its
because
of
because
packaging costs
attractive
more
steel: It was easier to shape; it reduced the problems
transportation
Vershire
more attractive recycling material, with a ton of scrap aluminum having almost three times the value of a ton of scrap steel. Four global companies supplied alu-
minum to can producers:Alcoa,Alcan, Reynolds,and Kaiser.Two of thesecompanies, Alcoa and Reynolds, also manufactured
Divisions
of Vershire
Company
were structured
aluminum
containers.
to encom
broad product
categories. Divisional general managers were given full control of their busi-
nesseswith two exceptions:the raising of capital and labor relations,which were both centralized at head office. The budget was used as the primary to direct each division's efforts towards common corporate objectives.
tool
In May,eachdivisionalgeneralmanagersubmitteda preliminaryreport to corporate
management
summarizing
the outlook
for sales,
income.
and caDital
3
Company
re-
detailed
not
already
were
was
reports
division
These
each
since
years.
two together
pull
to
subsequent
the
easy
over
fairly
category
usually
each
were
and
in
requirements for the next budget year, and evaluating the trends anticipated
quired to predict market conditions in the current year and to anticipate capital expenditures five years out as part of the strategic planning process. Once the divisional
general
managers
had submitted
these preliminary
re-
to
fore-
budget sales combined
A
forthcoming
were
.
the general
forecasts
these
more
exaInining in and
years division;
each
two
assessment,
market
following
for
the
formal prepared
and
more
a
detail
then
in was
year
velop
ports, the central market researchstaff at corporateheadquartersbeganto de-
cast
Vershire
create a forecast for the entire company. In developing division forecasts, the research staff considered several topics, including general econoInic conditions and their impact on customers, and market share for different products by geographic area. Fundamental assumptions were made as to price, new products, changes in particular s, new
plants, inventory carryovers, forward buying, packaging trends, industry growth trends, weather conditions, and alternative packaging.Each product line, regardlessof size,was reviewed in the samemanner. These foreca~ts were prepared at the head office in order to ensure that basic assumptions were uniform and that overall corporate sales forecasts were
both reasonable and achievable.The completed forecasts were forwarded to their
respective
divisions
for review,
criticism,
and fine-tuning.
The divisional general managers then compiled their own sales forecasts from
the bottom
up, asking
each district
sales manager
to estimate
sales for the
comingbudget year.The district managerscould requesthelp from the head office or the divisional staff but in the end assumed full responsibility for the forecasts they submitted. All district sales forecasts were consolidated at the division level for review by the vice president for marketing, but no changes were made in a district's forecast unless the district manager agreed. Likewise, once the budget had been approved, any changes had to be approved by all those responsible for that budget.
This processwas then repeated at the corporatelevel. When all the responsible parties were satisfied with the sales budget, the figures became fIXed ob-
jectives,with eachdistrict being held responsiblefor its own portion. The entire review
and approval
process
had
four
objectives:
1. To assesseachdivision's competitiveposition and formulate coursesof action to improve
upon
it.
2. To evaluate actions taken to increase market share or to respond to competitors'
activities.
3. To considerundertaking capital expendituresor plant alterations to improve existing
products
or introduce
new products.
4. To developplans to improve cost efficiency,product quality, delivery methods, and service.
~~facturing~~~~~ Mer
final approval at the divisional and corporate levels, the overall sales
budget was translated into a salesbudget for each plant, broken down accord-
4
end use. Onc~ the sales numbers
were estimated,
budgeted
plant
and
the
At volume,
shipped.
each plant
price,
be
to
would according
goods
finished
categorized
the then
which
was
from budget
plants sales
the
to
the
level,
ing
Company
gross profit,
fIXed expenses,and pretax income. Profit was calculated as the sales budget less budgetedvariable costs(including direct material, direct labor, and variable manufacturing overhead-each valued at a standard rate) and the fixed overhead budget. The plant manager was held responsiblefor this budgeted profit number even if actual sales fell below the projected level. Cost standards and cost reduction targets were developed by the plant's industrial engineering department, which also determined budget performance standards for each department, operation, and cost center within the plantincluding such items as budgeted cost reductions, allowances for unfavorable
variancesfrom standards,and fixed costssuch as maintenancelabor. Before plant budgets were submitted, controller staff from the head office visited each plant. These visits were extremely important because they provided an opportunity for plant managers to explain their situation and allowed controllers to familiarize themselves with the reasoning behind the managers' numbers so that they could better explain them when they were presented to corporate management. The controllers also used these visits to provide guidance as to whether the budgeted profits were in line with corporate goals, and
to reinforce the' notion that headquarters was in touch with the plant. Each visit usually lasted about half a day. Most of the time was devotedto
ployees
were
plant
em-
a the
for what)
allocated
(and
also how
was
time
but
themselves
for
see
meetings;
the
could
in
include
controllers
to
so
wished walk-through
agers
reviewing the budget with the plant manager and any supervisors the man-
doing.
On or beforeSeptember1,plant budgetswere submitted to the division head
When
for
was
ap-
asked
for
or
budget
savings. submitted
it
the
additional
budget,
was
approved
the
for
look
either December.
in
budget
who
with
to
asked
satisfied (CEO), consolidated meeting
final
Officer
was
were
managers
Directors
of
Board
The
Executive
manager
plant
general Chief the
at
modifications.
the
divisional
to certain
sent
the
expectations,
office, where they were consolidated and presented to the divisional general managers for review. If the budgets were not quite in line with management's
proval
Vershire
Oncea budget had been approved,it was difficult to change.Any problems that arose between sales and production at a given plant were expected to be solved by people in the field. If a customer called with a rush order that would disrupt production, for example, production could recommend various courses of
action but it was the salesmanager'sresponsibility to get the product to the customer. If the sales manager determined that it was essential to ship the product
right away,that would be done.The customerwas alwaysthe primary concern. Performance
--
Measurement
and
Evaluation
On the secondbusinessday after the closeof eachmonth, every plant faxed certain critical operating varianceswhich were combinedinto a "variance analysis sheet."A compilation of all variance sheetswas distributed the following morning to interested management. Plant managers were not supposed to wait until these monthly statements were prepared to identify unfavorable variances;
Vershire Comoanv
5
rather, they were expectedto be aware of them (and to take correctiveaction)on a daily
basis.
which budgetedtargets had not beenmet.The focuswason net sales,in-
in
areas
Four business days after the close of every month, each plant submitted a report showing budgeted and actual results. Onee these reports were received, corporate management reviewed the variances for those items where figures exceededbudgetary amounts, thus requiring plant managers to explain only the cluding price and mix changes, gross margin, and standard manufacturingcosts. The budgeted and actual information submitted is summarized in Exhibit 2. Supplemental information was provided by ing documents (see Exhibit
3). Both reports were consolidatedfor eachdivision and for the entire company, and distributed
the next day.
The fIXedcostswere examinedto seeif the plants had carried out their various programs,if the programs had met budgetedcosts,and if the results were expectations.
deliv-
and
and
mix, operations
sales plant
price,
for
the
for responsibility
had
had plant
The
department
sales schedules.
The ery
plant
responsibility
Incentives
Man~~~1!_t
sole
with
manager
in line
profits:
Plant managers were motivated to meet their profit goals in a number of ways. First, only capable managers were promoted, with profit performance being a main factor in determining capability. Second, plant managers' compensation packages were tied to achieving profit budgets. Third, each month a
chart was compiled showing manufacturing efficienct by plant and division. These comparative efficiency charts were highly publicized by most plant managers despite the inherent unfairness in comparing plants that produced different products requiring different setup times, etc. Some plants ran internal competitions between production lines and departments to reduce certain cost items, rewarding department heads and foremen for their accomplishments.
Questions 1. Outline the strengths and weaknesses ofVershire Company's planning and control
system.
2. Trace the profit budgeting process at Vershire, starting in May and ending
with the Board of.Directors' meeting in December.Be prepared to describe the activities that took place at each step of the processand present the rationale for each. 3. Should the plant managersbe held responsiblefor profits? Why?Why not? 4. How do you assessthe performanceevaluation systemcontainedin Exhibits 2 and
3?
5. On balance,would you redesign the managementcontrol structure at Vershire
Company?
If so, how
and why?
Vershire Company
'Numbers
in this exhibit
6
have been'omitted,
--
~,'
.
several
shows
divi-
the
to
1
man-
with largest
the Exhibit Reporting
States.
of
company
packaging division-one
United
division.
the
in
Can
Aluminum
cans
Can
diversified
a
was
Aluminum the
for
beverage
the
Company chart
aluminum
including
Vershire
of
divisions, organization
the
ufacturers
major
1996
Company
In
Vershire
sional general manager were two line managers, vice presidents in charge of manufacturing and marketing. These vice presidents headed all of the division's activities in their respective functional areas.
The Aluminum Can division's growth in salesslightly outpacedsalesgrowth in the industry at large. The division had plants scattered throughout the United States. Each plant served customers in its own geographic region, often producing several different sizes of cans for a range of customers that included
both large and small breweries and soft drink bottlers. Most of these customers had between two and four suppliers and spread purchases among them. If the division failed to meet the customer's cost and quality speciijcations or its stan-
dards for delivery and customer service,the customer would turn to another supplier. All aluminum can producers employed essentially the same technology, and the division's product quality was equal to that of its competitors.
con-
aluminum,
metal
The
materials: plastic.
or
several
of
one composite),
from
made
metal
and
were (paper
fiber-foil
glass,
steel,
containers
Backgroundl
Traditionally,
Industry
tainer industry consisted of the hundred-plus firms that produced aluminum
EXHIBIT 1
AluminumCan
Vijay
Professors
of
supervision
the
(T'94)
Chitkar~
This case was adapted by Anil R.
under
Division
Hawkins.
David
Professor
by
pared
Govindarajanand RobertN. Anthony.The caseis based(with permission)on ~n earliercasepre-
Harvarn
Hamerm~h
Professor
by
prepared
case,
1Theindustry backgroundis basedon a similardescriptionin the Crown Cork and SealCompany R".inA" -:rh~1
2
Company
and tin-plated steel cans. Aluminum cans were used for packaging beverages (beer and soft drinks), while tin-plated steel cans were used primarily for food packaging, paints, and aerosols. In 1970, steel cans ed for 88 percent of metal
pri-
of were
percent
75 containers
over
the
for
had come to dominate
purchased
ed who
cans bottlers
aluminum
but by the 1990s aluminum
drink
soft
1996,
In production.
The
industry.
the can
the metal can production,
cost
64
it for
and
lines
five
ed
was typically
plant
container
materials
a Raw
for line.
scale per
efficient equipment
in
minimum
The
million
$20
ket.
marily small independent franchisees of Coca-Cola and Pepsi Cola, which represented their independent bottlers in negotiating with the container companies. Five beverage container manufacturers ed for 88 percent of the mar-
percent of the production cost. Other costs included labor (15 percent), marketing and general istration (9 percent), transportation (8 percent), depreciation (2 percent), and research and development (2 percent). For beverage processors, the cost of the can usually exceeded the cost of the contents, with the container ing for approximately 40 percent of the to-
tal manufacturing cost.Most beverageprocessorsmaintained two or more suppliers;
and
some
processors
integrated
backward,
manufacturing
cans
themselves.On~ large beveragecompany produced one-third of its own container requirements and ranked ducers in the industry.
as one of the top five beverage container
pro-
efficient,
a more
and
cup even
deep
a become
into had
pushed process
was
metal
of manufacturing
sheet the
flat
a
producing
1996
By
which
in attached.
process was
top
piece
Prior to the early 1970s, cans were produced by rolling a sheet of steel, soldering and cutting it to size, and attaching both the top and the bottom. In 1972 the industry was revolutionized when aluminum producers perfected a two-
over 2,000 cans per minute.
In addition to production efficiency,aluminum had other advantagesover
a
was
reduced
it
and
it pernlitted
aluminum
lithograph;
to
of flavoring;
Additionally;
easier
was
weight.
it lighter
its
because
of
because
packaging costs
attractive
more
steel: It was easier to shape; it reduced the problems
transportation
Vershire
more attractive recycling material, with a ton of scrap aluminum having almost three times the value of a ton of scrap steel. Four global companies supplied alu-
minum to can producers:Alcoa,Alcan, Reynolds,and Kaiser.Two of thesecompanies, Alcoa and Reynolds, also manufactured
Divisions
of Vershire
Company
were structured
aluminum
containers.
to encom
broad product
categories. Divisional general managers were given full control of their busi-
nesseswith two exceptions:the raising of capital and labor relations,which were both centralized at head office. The budget was used as the primary to direct each division's efforts towards common corporate objectives.
tool
In May,eachdivisionalgeneralmanagersubmitteda preliminaryreport to corporate
management
summarizing
the outlook
for sales,
income.
and caDital
3
Company
re-
detailed
not
already
were
was
reports
division
These
each
since
years.
two together
pull
to
subsequent
the
easy
over
fairly
category
usually
each
were
and
in
requirements for the next budget year, and evaluating the trends anticipated
quired to predict market conditions in the current year and to anticipate capital expenditures five years out as part of the strategic planning process. Once the divisional
general
managers
had submitted
these preliminary
re-
to
fore-
budget sales combined
A
forthcoming
were
.
the general
forecasts
these
more
exaInining in and
years division;
each
two
assessment,
market
following
for
the
formal prepared
and
more
a
detail
then
in was
year
velop
ports, the central market researchstaff at corporateheadquartersbeganto de-
cast
Vershire
create a forecast for the entire company. In developing division forecasts, the research staff considered several topics, including general econoInic conditions and their impact on customers, and market share for different products by geographic area. Fundamental assumptions were made as to price, new products, changes in particular s, new
plants, inventory carryovers, forward buying, packaging trends, industry growth trends, weather conditions, and alternative packaging.Each product line, regardlessof size,was reviewed in the samemanner. These foreca~ts were prepared at the head office in order to ensure that basic assumptions were uniform and that overall corporate sales forecasts were
both reasonable and achievable.The completed forecasts were forwarded to their
respective
divisions
for review,
criticism,
and fine-tuning.
The divisional general managers then compiled their own sales forecasts from
the bottom
up, asking
each district
sales manager
to estimate
sales for the
comingbudget year.The district managerscould requesthelp from the head office or the divisional staff but in the end assumed full responsibility for the forecasts they submitted. All district sales forecasts were consolidated at the division level for review by the vice president for marketing, but no changes were made in a district's forecast unless the district manager agreed. Likewise, once the budget had been approved, any changes had to be approved by all those responsible for that budget.
This processwas then repeated at the corporatelevel. When all the responsible parties were satisfied with the sales budget, the figures became fIXed ob-
jectives,with eachdistrict being held responsiblefor its own portion. The entire review
and approval
process
had
four
objectives:
1. To assesseachdivision's competitiveposition and formulate coursesof action to improve
upon
it.
2. To evaluate actions taken to increase market share or to respond to competitors'
activities.
3. To considerundertaking capital expendituresor plant alterations to improve existing
products
or introduce
new products.
4. To developplans to improve cost efficiency,product quality, delivery methods, and service.
~~facturing~~~~~ Mer
final approval at the divisional and corporate levels, the overall sales
budget was translated into a salesbudget for each plant, broken down accord-
4
end use. Onc~ the sales numbers
were estimated,
budgeted
plant
and
the
At volume,
shipped.
each plant
price,
be
to
would according
goods
finished
categorized
the then
which
was
from budget
plants sales
the
to
the
level,
ing
Company
gross profit,
fIXed expenses,and pretax income. Profit was calculated as the sales budget less budgetedvariable costs(including direct material, direct labor, and variable manufacturing overhead-each valued at a standard rate) and the fixed overhead budget. The plant manager was held responsiblefor this budgeted profit number even if actual sales fell below the projected level. Cost standards and cost reduction targets were developed by the plant's industrial engineering department, which also determined budget performance standards for each department, operation, and cost center within the plantincluding such items as budgeted cost reductions, allowances for unfavorable
variancesfrom standards,and fixed costssuch as maintenancelabor. Before plant budgets were submitted, controller staff from the head office visited each plant. These visits were extremely important because they provided an opportunity for plant managers to explain their situation and allowed controllers to familiarize themselves with the reasoning behind the managers' numbers so that they could better explain them when they were presented to corporate management. The controllers also used these visits to provide guidance as to whether the budgeted profits were in line with corporate goals, and
to reinforce the' notion that headquarters was in touch with the plant. Each visit usually lasted about half a day. Most of the time was devotedto
ployees
were
plant
em-
a the
for what)
allocated
(and
also how
was
time
but
themselves
for
see
meetings;
the
could
in
include
controllers
to
so
wished walk-through
agers
reviewing the budget with the plant manager and any supervisors the man-
doing.
On or beforeSeptember1,plant budgetswere submitted to the division head
When
for
was
ap-
asked
for
or
budget
savings. submitted
it
the
additional
budget,
was
approved
the
for
look
either December.
in
budget
who
with
to
asked
satisfied (CEO), consolidated meeting
final
Officer
was
were
managers
Directors
of
Board
The
Executive
manager
plant
general Chief the
at
modifications.
the
divisional
to certain
sent
the
expectations,
office, where they were consolidated and presented to the divisional general managers for review. If the budgets were not quite in line with management's
proval
Vershire
Oncea budget had been approved,it was difficult to change.Any problems that arose between sales and production at a given plant were expected to be solved by people in the field. If a customer called with a rush order that would disrupt production, for example, production could recommend various courses of
action but it was the salesmanager'sresponsibility to get the product to the customer. If the sales manager determined that it was essential to ship the product
right away,that would be done.The customerwas alwaysthe primary concern. Performance
--
Measurement
and
Evaluation
On the secondbusinessday after the closeof eachmonth, every plant faxed certain critical operating varianceswhich were combinedinto a "variance analysis sheet."A compilation of all variance sheetswas distributed the following morning to interested management. Plant managers were not supposed to wait until these monthly statements were prepared to identify unfavorable variances;
Vershire Comoanv
5
rather, they were expectedto be aware of them (and to take correctiveaction)on a daily
basis.
which budgetedtargets had not beenmet.The focuswason net sales,in-
in
areas
Four business days after the close of every month, each plant submitted a report showing budgeted and actual results. Onee these reports were received, corporate management reviewed the variances for those items where figures exceededbudgetary amounts, thus requiring plant managers to explain only the cluding price and mix changes, gross margin, and standard manufacturingcosts. The budgeted and actual information submitted is summarized in Exhibit 2. Supplemental information was provided by ing documents (see Exhibit
3). Both reports were consolidatedfor eachdivision and for the entire company, and distributed
the next day.
The fIXedcostswere examinedto seeif the plants had carried out their various programs,if the programs had met budgetedcosts,and if the results were expectations.
deliv-
and
and
mix, operations
sales plant
price,
for
the
for responsibility
had
had plant
The
department
sales schedules.
The ery
plant
responsibility
Incentives
Man~~~1!_t
sole
with
manager
in line
profits:
Plant managers were motivated to meet their profit goals in a number of ways. First, only capable managers were promoted, with profit performance being a main factor in determining capability. Second, plant managers' compensation packages were tied to achieving profit budgets. Third, each month a
chart was compiled showing manufacturing efficienct by plant and division. These comparative efficiency charts were highly publicized by most plant managers despite the inherent unfairness in comparing plants that produced different products requiring different setup times, etc. Some plants ran internal competitions between production lines and departments to reduce certain cost items, rewarding department heads and foremen for their accomplishments.
Questions 1. Outline the strengths and weaknesses ofVershire Company's planning and control
system.
2. Trace the profit budgeting process at Vershire, starting in May and ending
with the Board of.Directors' meeting in December.Be prepared to describe the activities that took place at each step of the processand present the rationale for each. 3. Should the plant managersbe held responsiblefor profits? Why?Why not? 4. How do you assessthe performanceevaluation systemcontainedin Exhibits 2 and
3?
5. On balance,would you redesign the managementcontrol structure at Vershire
Company?
If so, how
and why?
Vershire Company
'Numbers
in this exhibit
6
have been'omitted,
--
~,'
.
Related Documents c2h70
Case Solution - Vershire Company 4i1h2l
December 2019 31
Vershire Company Case Print 30141s
April 2021 0
Case Study - Vershire Company 59205l
April 2021 0
Dashman Company Case Solution. 4k172j
January 2022 0
Solution Case Birch Paper Company 4f2r5x
December 2021 0
Baldwin Bicycle Company Case Solution Excel File 40231m
November 2019 103More Documents from "Jerelleen Rodriguez" 3g1570
Case Solution - Vershire Company 4i1h2l
December 2019 31
Quality Metal Service Center - Final 5u5d57
December 2021 0
6g3p1u
December 2019 88
6g3p1u
December 2019 135
6g3p1u
May 2021 0