Bio Ia Template 174d6s
This document was ed by and they confirmed that they have the permission to share it. If you are author or own the copyright of this book, please report to us by using this report form. Report 2z6p3t
Overview 5o1f4z
& View Bio Ia Template as PDF for free.
More details 6z3438
- Words: 506
- Pages: 4
Biology Internal Assessment () Practical Research question Independent variable (range of values), Dependent variable (how data is collected), controlled variables, control experiment (positive/negative). Broad aim Background information Lit review Mode of mechanism – cellular/ molecular level? Biological aspect If spectrophotometer – choice of wavelength Hypothesis
Table of materials S/No 1 2 3
Material
Concentration
Quantity
Apparatus 10cm3 measuring cylinder 25cm3 measuring cylinder 50cm3 measuring cylinder 100cm3 measuring cylinder Ruler Electronic stopwatch Electronic mass balance Laboratory thermometer Spectrophotometer 50cm3 burette 5cm3 syringe 8mm cork borer 50cm3 beaker 100cm3 beaker 250cm3 conical flask White tile
Quantity
Uncertainty ±0.1cm3 ±0.5cm3 ±0.5cm3 ±1cm3 ±0.1cm3 ±0.01s ±0.01g ±0.5ºC ±0.005 A ±0.01cm3 -
Table of apparatus S/No
1 1 1 1 1
Table of control of variables
Variables
Independent Variable Ways of controlling Apparatus used
Values of variable
Positive Control (has an effect on exp)
Negative Control (no effect on exp) e.g. non-germinating Table 3.1: Table of independent variables showing the values of the independent variables, how they are controlled and the materials used
Variable
Dependent Variable Method(s) of Assessing Apparatus used
Unit of measurement
Table 3.2: Table of dependent variables showing the ways of assessing and the apparatus used.
Variable
Controlled Variable Significance
Way(s) of controlling
Table 3.3: Table of controlled variables showing the variables to be controlled, their significance and how they are controlled.
Procedure *mention control Qualitative Data Aspect observed
Table of formulae
Photograph(s)
Observations *no numbers e.g. conditions of seeds walls of respiratory chamber – water vapour?
Formula
Worked example
Rationale
Calculation of Mean Average
åx
Formula Sample calculation of 10°C mean absorbance
n 0.758 + 0.644 + 0.546 + 0.836 + 0.846 5 = 0.726
Table 5.1: Calculation of Mean average. The values for sample calculation were obtained from Table 4.1, the raw data.
Calculation of Standard Deviation
å(x - x )
Formula
2
(n -1) (0.758 - 0.726)2 + (0.644 - 0.726)2 +... + (0.846 - 0.726)2 (5 -1)
Sample calculation of 10°C Standard Deviation
= 0.129
Table 5.2: Calculation of Standard Deviation. The values for sample calculation were obtained from
Calculation of Enzyme Activity Method Sample calculation of 10°C Enzymatic Activity
Means absorbanceControl - Mean AbsorbanceVariable
1.177 - 0.726 = 0.451
Table 5.3: Calculation of Enzyme activity. The values for sample calculation were obtained from the mean absorbance of the positive control and the variable from Table 6.1.
Quantitative Data *keeping figures to x d.p. for meaningful comparison **data following uncertainty (2m) The following graphs in fig 4, 5 and 6 are depicted to calculate the rate of cell respiration by taking the gradient of the respective trendlines using Microsoft Excel 2007 equation function. Graph of processed data *Error bars showing ±standard deviation for 5 replicates Discussion CE1: Description of trend (section 1 info Molecular level)
(cite references, footnote) Limitations/large stan dv ‘will be discussed in the evaluation’ T-test: MUST BE DISCUSSED. Parallel to other reports (optional) Prove trends/results are significant/reliable b/c they concur w/ research papers Conclusion
Limitations and improvements Procedure
Limitation Ways of collecting data Failure to control controlled variables
Improvement
Related Documents c2h70

Bio Ia Template 174d6s
December 2021 0
Ib Bio Ia Rubric 2016 q1x1l
February 2023 0
Character Bio Template 3i1m3j
October 2019 78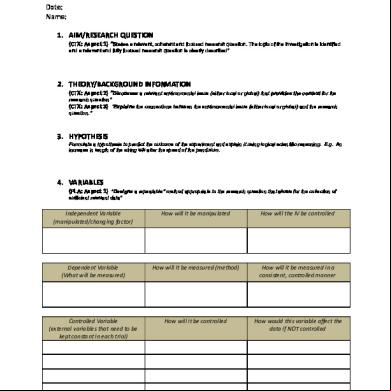
Lab Report Template Ia Ess 3u661b
December 2021 0
Ia 6k1m36
January 2023 0